CERS-IE WORKING PAPERS | KRTK-KTI MŰHELYTANULMÁNYOK
INSTITUTE OF ECONOMICS, CENTRE FOR ECONOMIC AND REGIONAL STUDIES, BUDAPEST, 2020
Industry dynamics and high-growth firms' contribution to productivity growth
MÁRTA BISZTRAY – FRANCESCA DE NICOLA – BALÁZS MURAKÖZY
CERS-IE WP – 2020/47
November 2020
https://www.mtakti.hu/wp-content/uploads/2020/11/CERSIEWP202047.pdf
CERS-IE Working Papers are circulated to promote discussion and provoque comments, they have not been peer-reviewed.
Any references to discussion papers should clearly state that the paper is preliminary.
Materials published in this series may be subject to further publication.
ABSTRACT
This paper investigates the contribution of high-growth firms (HGFs) to aggregate productivity growth. Four stylized facts emerge. First, HGFs mainly contribute to productivity growth during their high-growth phase but not afterwards. Second, their contribution varies substantially across industries and it is not necessarily positive.
Third, the impact on productivity depends on how HGFs are defined. Output-based HGFs substantially outperform employment-based ones in terms of their productivity contribution while the difference in terms of job creation is low. Fourth, HGFs' contribution to productivity is higher in industries where industry dynamics favor growing firms, captured by the strength of reallocation and the relationship between productivity growth and size growth. We present a simple model to show that these patterns arise naturally under realistic correlation structures. Our results suggest that policies supporting HGFs may focus on firms increasing their sales, and these can effectively be complemented by framework policies promoting efficient reallocation.
JEL codes: L25, O40
Keywords: high-growth firms, productivity growth, reallocation, industry dynamics
Márta Bisztray
Centre for Economic and Regional Studies, Budapest and
Corvinus University Budapest, CERGE-EI Foundation Teaching Fellow e-mail: bisztray.marta@krtk.mta.hu
Francesca de Nicola
World Bank, Washington DC e-mail: fdenicola@worldbank.org
Balázs Muraközy
University of Liverpool Management School, Liverpool and
Centre for Economic and Regional Studies, Budapest
e-mail: Balazs.Murakozy@liverpool.ac.uk
Iparági dinamika és a gyors növekedésű cégek hozzájárulása a termelékenység növekedéshez
BISZTRAY MÁRTA – FRANCESCA DE NICOLA – MURAKÖZY BALÁZS
ÖSSZEFOGLALÓ
Tanulmányunk a gyors növekedésű cégek aggregált termelékenység növekedéshez való hozzájárulását vizsgálja. Négy stilizált tényt állapíthatunk meg. Először, a gyors növekedésű cégek elsősorban a gyors növekedési periódus alatt járulnak hozzá az aggregált termelékenység növekedéséhez, utána már nem. Másodszor, a hozzájárulásuk iparáganként lényegesen eltérő és nem feltétlenül pozitív.
Harmadszor, a termelékenységre gyakorolt hatás függ a pontos definíciótól. A gyors árbevétel növekedésű cégek termelékenységhez való hozzájárulása lényeges nagyobb, mint a gyors létszám növekedésűeké, míg a munkahelyteremtés tekintetében sokkal kisebb köztük a különbség. Negyedszer, a gyors növekedésű cégek termelékenység növekedéshez való hozzájárulása magasabb ott, ahol az iparági dinamika kedvez a növekvő cégeknek, amit a reallokáció erősségével, illetve a termelékenység és méretnövekedés közti kapcsolattal mérhetünk. Egy egyszerű modell segítségével bemutatjuk, hogy ezek a mintázatok természetesen adódnak realisztikus korrelációs struktúrák esetén. Mindezek alapján a gyors növekedésű vállalatokat célzó intézkedéseknek érdemes lehet az árbevételüket növelő cégekre összpontosítani, valamint ezeket jól kiegészíthetik a hatékony reallokációt ösztönző általánosabb intézkedések.
JEL: L25, O40
Kulcsszavak: gyors növekedésű vállalatok, termelékenység növekedés, reallokáció,
iparági dinamika
Industry dynamics and high-growth firms’ contribution to productivity growth
M´ arta Bisztray
1Francesca de Nicola
2Bal´ azs Murak¨ ozy
3November 18, 2020
Abstract
This paper investigates the contribution of high-growth firms (HGFs) to aggregate productivity growth. Four stylized facts emerge. First, HGFs mainly contribute to productivity growth only during their high-growth phase but not afterwards. Second, the contribution during this phase varies substan- tially across industries and it is not necessarily positive. Third, the impact on productivity depends on how HGFs are defined. Output-based HGFs substantially outperform employment-based ones in terms of their productivity contribution while the difference between the two firm groups is much lower in terms of job creation. Fourth, HGFs’ contribution to productivity is higher in industries where industry dynamics favor growing firms, captured by the strength of reallocation and the relationship between productivity growth and size growth. We present a simple model to show that these patterns arise naturally under realistic correlation structures. Taken together, these results suggest that specific policies supporting HGFs may focus on firms which increase their sales, and HGF policies can effectively be complemented by more general framework policies promoting efficient reallocation.
Keywords: high-growth firms, productivity growth, reallocation, industry dynamic, Hungary
1Centre for Economic and Regional Studies, Budapest and Corvinus University Budapest, CERGE-EI Foundation Teaching Fellow
2World Bank, Washington DC
3Corresponding author. University of Liverpool Management School, Liverpool and CERS, Budapest. email mu- rakozy@liverpool.ac.uk, Chatham St, Liverpool L69 7ZH, UK. We thank Jozef Konings and Mikl´os Koren for their insightful suggestions. We thank the Hungarian Academy of Sciences for funding this research as part of its Momentum Grant ”Firms, Strategy and Performance”.
1 Introduction
High-growth firms (HGFs) have increasingly attracted the attention of policy makers mainly for their job- creating role. However, when evaluating the high-growth phenomenon and the policies that support it, it is not only the number of jobs created that is relevant, but also the “quality” of those jobs. An important measure of quality is the productivity level of these new jobs: do HGFs create exceptionally productive jobs—
as often assumed—or are these jobs mostly less productive, contributing little to aggregate productivity growth?
This paper sheds light on this question by quantifying the contributions of HGFs to industry-level TFP and labor productivity growth based on detailed microdata from Hungary. We present results for all of the most common HGF definitions in the literature including the “OECD definitions”, which require firms to increase their employment or sales by 20% per year for 3 years, and the “Birch definitions”, which rely on an average of absolute and relative growth.
A useful way to think about how a group of firms contribute to productivity growth is to start from the framework of Foster et al. (2008). This framework decomposes industry-level productivity growth of (continuing) firms into three components.1 First, the within term captures the contribution resulting from firms increasing productivity, but disregarding any changes in their market share. Second, thebetween (reallocation) term captures the extent to which the expansion of initially more productive firms contributes to the increase in industry-level productivity. Third, the cross term captures the contribution from the correlation between size growth and productivity growth.
This additive decomposition allows distinguishing between HGFs and other firms’ contributions to productivity growth within an industry (similarly to Haltiwanger et al. 2016). Quantifying the within, between and cross terms separately for HGFs and other firms allows us to account for two possible channels of productivity growth. First, HGFs may improve their productivity during their high growth phase. This should be reflected both by the HGF within term (because high-growth firms also experience improving
1We abstract away from entry and exit, because most definitions of HGFs assume that the firm initially operates above a certain size threshold and, by definition, HGFs cannot exit during their high-growth phase.
productivity) and the cross term (because there is a positive correlation between size and productivity growth within the HGF group). Second, HGFs may already be exceptionally productive to begin with, hence reallocating resources towards them improves overall productivity, as captured by the HGF between term.
We document four stylized facts using data from Hungary. First, on average, HGFs raise productiv- ity only during their high-growth phase, if at all, but not afterwards. Therefore, our analysis—and probably policymakers’ attention—should focus on the high-growth phase.
Second, the contribution during the high-growth phase varies widely across industries and years.
While HGFs contribute more than 50% to industry-level productivity growth in about 25% of the cases,2their contribution is actually negative for 25% of the (industry-period level) observations. Negative contribution mainly comes from negative productivity growth during the high-growth phase.
Third, the definition of HGFs matters when assessing HGFs’ contribution to aggregate productiv- ity growth. The most frequently-used HGF definitions differ in two key dimensions. The first dimension is whether they focus on input, i.e. employment, or output, i.e. sales, growth.3 We find that output-based HGFs tend to experience positive productivity growth (15% on average) while input-based HGFs typically face a fall in their productivity (-24% on average).4 Even though this difference in within-firm productivity growth is somewhat offset by the lower initial productivity of the sales HGFs, the average (median) contri- bution of sales-based HGFs is 1.6 (2.6) percentage points higher than that of employment-based HGFs for the 3-year period.5 The second key dimension of HGF definitions is whether they are based solely on rela- tive growth (OECD definitions) or also take absolute growth into account (Birch definitions).6 Definitions identifying HGFs solely based on relative growth are likely to capture small firms, therefore, their aggregate
2Except for the OECD employment definition discussed later.
3While alternative measures also exist, the literature suggests that sales and employment are the preferable ones for mea- suring HGFs (Delmar et al. (2003)).
4This is in line with other findings of the literature. Daunfeldt et al. (2014) show that Swedish firms with high sales growth are also likely to have high productivity growth, but firms with high employment growth do not. Du & Temouri (2015) find a higher post-high-growth period productivity growth for UK HGFs defined based on sales. Haltiwanger et al. (2016) emphasize that sales-based HGFs make a disproportionate contribution to productivity growth in the US. Mason & Brown (2013) show that in spite of their higher than average productivity, employment-based HGFs in Scotland have a limited contribution to aggregate productivity growth. For Italian firms, Arrighetti & Lasagni (2013) find that only sales-based HGFs have typically high productivity.
5All numbers are based on the OECD definitions.
6See the review paper of Coad et al. (2014) for further details on HGF-measurement in the literature.
contribution is typically more limited.
Our fourth finding is that some basic characteristics of industry dynamics, captured by two key moments, substantially influence the contribution of HGFs to industry-level productivity growth. The first key moment is the correlation between the initial productivity level and subsequent size growth, which captures the strength and efficiency of reallocation within the industry. Under stronger reallocation, HGFs tend to be more productive initially, which leads to a more positive HGFbetween component. The second moment is the correlation between size growth and productivity growth. This correlation captures the magnitude of financial and other constraints firms face when growing. We show that a stronger correlation between productivity growth and size growth leads to a higher productivity contribution of HGFs via higher withinandcrossterms.
After presenting the results, we build a simple model and simulation to explain the key patterns in the data. This model starts from a joint distribution of the variables relevant for HGF productivity con- tribution: initial size, initial productivity, productivity growth and size growth. Correlations between these variables capture the key empirical moments of industry dynamics. Our aim with this exercise is threefold.
First, we aim at explaining qualitatively the empirical patterns we find based on simple assumptions. By finding that even this highly simplified framework reproduces all our results, we conclude that they mostly come from industry-level correlations rather than from some peculiarities of HGFs. Second, the framework may help policymakers in designing effective policies by emphasizing the role of some easily interpretable and quantifiable industry and firm characteristics. Finally, the framework can be generalized to model and understand the productivity contributions of other groups of firms, for example SMEs, as we discuss. The simple model we build can reproduce the patterns we find in the empirical exercise.
We argue that these findings are of high policy interest. The productivity evolution of high-growth firms is not relevant only because of HGFs’ direct contribution to productivity growth but also because more spillovers may be expected from more productive firms (e.g. Stoyanov & Zubanov 2012). The insight that sometimes HGFs do actually contribute negatively to productivity growth should warn policy makers that HGF promotion policies can have negative side-effects on aggregate productivity, thus these effects should
be quantified when designing and evaluating such a policy. The second conclusion on the importance of HGF definitions implies a key trade-off across definitions between productivity growth and job creation. A policy focusing on employment growth (i.e. input-based HGFs) may generate a small or negative productivity effect, while, according to our results, output-based HGFs create only somewhat fewer jobs but contribute to productivity growth substantially. Policies limited to firms which are very productive to start with may miss out these firms. Our final insight emphasizes that HGFs are likely to contribute more in environments which are in general conducive to efficient reallocation. This implies that general framework policies improving reallocation can strongly complement specific policies promoting HGFs.
We contribute to four strands of the literature. First, there is some evidence from the literature on the links between the productivity of firms and their HGF status. HGFs tend to have a higher productivity level (Acs et al. 2008, Bianchini et al. 2017, Moschella et al. 2019), but not necessarily when high growth is measured in terms of employment (Arrighetti & Lasagni 2013). Firms with high TFP growth are more likely to become sales-based HGFs, and sales-based HGFs tend to have a higher productivity growth after their high-growth period (Du & Temouri 2015). At the same time, Daunfeldt et al. (2014) suggest a trade-off between growth in terms of employment and in terms of productivity. As Grover Goswami et al. (2019) concludes, in general there seems to be no strong connection between productivity and high growth status.
Our results reinforce the conclusion that high growth and productivity are interlinked in complex ways and sheds more light on this relationship by systematically reviewing how different HGF definitions are related to initial productivity level and productivity growth during the HGF phase.
Second, we know from previous studies that there exists a large heterogeneity in the growth patterns of high-growth firms, thus the way one define HGFs is crucial. Among others, Delmar (2006) and Shepherd
& Wiklund (2009) compare the various definitions used in the previous literature. HGF definitions differ in terms of the indicator used: the definitions are most frequently based on sales and employment, but it can also be a combination of these two (Acs et al. 2008, Moschella et al. 2019), productivity or value added (Daunfeldt et al. 2014), more rarely firm performance, market share or assets (Delmar 2006)), in terms of the formula for measuring growth (relative or absolute growth (Delmar 2006), or a combination of the two
(Birch 1981). Definitions also differ in terms of the the time span considered (1, 3 or 5 years most frequently Delmar 2006), and in the type of growth (organic or the result of acquisition). The literature has studied many dimensions along which HGFs defined in various ways can differ. This includes the persistence of HGF status7, different characteristics of HGFs8, and the factors predicting HGF status9. In the current paper we also emphasize the differences between the various HGF measures in the context of their contribution to aggregate productivity growth.
Third, while many papers have shown that HGFs create a large share of new jobs (see the meta- analysis of Henrekson & Johansson 2010), there are only few papers investigating the contribution of HGFs to aggregate productivity growth. Daunfeldt et al. (2014) shows that the within contribution of HGFs to aggregate economic growth, employment growth, sales growth and productivity growth varies across the different HGF measures and can be even negative in some cases. Considering a 7-year period they find that the total productivity growth of employment-based HGFs is negative, while that of sales-based HGFs is positive but relatively low, about 7-8% of the aggregate productivity growth. In the current paper we go deeper, and by extending the Foster et al. (2008) framework we also consider the reallocation contribution and show that it is a substantial part of HGFs’ contribution. Additionally, we also consider cross-industry heterogeneity in HGFs contribution to aggregate productivity, and the industry characteristics which influence the magnitude of this contribution. The paper of Haltiwanger et al. (2016) is the closest to ours, as beyond looking at HGFs contribution to employment and real output growth they decompose the contribution of HGFs to industry-level productivity growth, focusing on the role of reallocation. They find that both HGFs and rapidly declining firms have a considerable contribution to aggregate productivity growth through reallocation. Compared to these results, we also look at the factors leading to cross-industry differences in the between and within terms of HGFs’ contribution to industry-level productivity. Moreover,
7We know from the literature that high growth is rather a temporary feature than a persistent firm characteristic (Daunfeldt
& Halvarsson 2015), but H¨olzl (2014) show that Birch-type HGFs are more persistent than the OECD-type HGFs, and Daunfeldt et al. (2014) has the same result for HGFs defined using absolute growth rather than relative one.
8As Coad et al. (2014) emphasizes, different HGF definitions capture a different set of firms. HGFs are generally younger but not only startups, not necessarily small and present in all sectors (Acs et al. 2008, Coad et al. 2014, Grover Goswami et al. 2019, e.g.), but only more productive and having more concentrated ownership if they are defined based on sales growth (Arrighetti & Lasagni 2013).
9There are some characteristics with which firms are more likely to become HGFs, like higher previous employment growth, lower inventories, higher short-term liabilities (Coad & Srhoj 2019), certain human resource practices, newness or access to credit (Lopez-Garcia & Puente 2012). Coad & Srhoj (2019) emphasize that certain factors like exports or growth in assets, are sensitive to the growth indicator, and they conclude that it is difficult to predict HGF status.
we explicitly focus on differences by HGF definition comparing OECD and Birch type measures as well.
Lastly, we also provide a simple model to show that the observed differences can be explained by a few moments of industry dynamics.
Finally, we contribute to the literature on reallocation (Foster et al. 2008, Hsieh & Klenow 2009, Bartelsman et al. 2013, Restuccia & Rogerson 2017, Baqaee & Farhi 2020). Some papers already looked at how specific firm groups, like foreign-owned (Balsvik & Haller 2006, Harris & Moffat 2013) or exporters (Gleeson & Ruane 2009, Fuss & Theodorakopoulos 2018) contribute to aggregate productivity via within- firm growth and reallocation. We focus on the role of HGFs in aggregate reallocation and by linking that contribution to parameters characterizing the overall strength of reallocation, which has already been found important for aggregate productivity growth via different channels (e.g. Andrews et al. 2015, 2016). We show that framework conditions are important for the contribution of a firm group to industry-level productivity, and by mapping general framework conditions to simple correlations of growth dynamics parameters, we provide an intuitive mechanism for that.
In what follows we first introduce our data and the decomposition methodology in Section 2. Section 3 introduces the different HGF definitions we use and presents descriptive statistics to investigate differences between them. Section 4 presents our findings on the contribution of HGFs to aggregate productivity and the impact of industry characteristics. Section 5 introduces our model and Section 6 concludes.
2 Data and methods
2.1 Hungarian firm-level data
Our main source of information is the database of the firm-level corporate income tax statements during the period 2001-2016 from the Hungarian National Tax Authority (NAV). The dataset has almost universal coverage as it includes all firms that require double-entry bookkeeping. The sample covers more than 95% of employment and value added of the business sector and about 55% of the full economy in terms of GDP. The
dataset includes the most important balance sheet items and information on a wide range of matters such as ownership, employment, industry at the NACE 2-digit code level and the location of the headquarters. The Centre for Economic and Regional Studies (CERS-HAS) has extensively cleaned and harmonized the data.
Nominal variables are deflated by the appropriate 2-digit industry level deflators from OECD STAN.10
Given the scope of our analysis, we restrict the data in several ways. First, we exclude non-profit organizations. Second, we drop firms that operate either in agriculture or in the non-market service sectors of the economy. Third, we drop all firms which never had more than 4 employees, because standard HGF definitions require firms to have at least 5 or 10 employees.
When quantifying productivity, we mainly rely on TFP, estimated with the method proposed by Ackerberg et al. (2015). We present robustness checks by using labor productivity, calculated as log value added per employee.
2.2 Decomposition
Our decomposition is based on Foster et al. (2008), who distinguish aggregate productivity growth in within, between, cross and net entry terms.
The original decomposition starts with the change between t0 and t (in our empirical exercise t=t0+ 3) in aggregate productivity (∆P RODt):
∆P RODt=X
i∈C
θi,t0∆prodi,t
| {z }
within
+X
i∈C
(prodi,t0−P RODt0)∆θi,t
| {z }
between
+X
i∈C
∆prodi,t∆θi,t
| {z }
cross
+
X
i∈N
θi,t(prodi,t−P RODt0)−X
i∈X
θi,t0(prodi,t0−P RODt0)
| {z }
net entry
where θi,t is the employment share of firm i in year t, prodi,t and P RODt are productivity measures at the firm and aggregate level, respectively. ∆ always denotes the change between t0 and t. C stands for
10The same data and definitions have been used in previous papers on Hungarian TFPs, including the cross country study coordinated by the World Bank (Grover Goswami et al. 2019) and de Nicola et al. (2019).
continuing firms,N for new entrants andX for exiting firms.
Thewithinterm captures the sum of firm-level productivity changes for continuing firms, weighted by their initial employment share. This term is large if firms, especially large firms, increased their pro- ductivity quickly. Thebetweenterm captures the main channel of reallocation by quantifying the extent to which initially more productive firms grew faster in terms of employment. Thecrossterm captures whether firms increasing their employment share were also able to improve their productivity. Thenet entryterm is positive if new entrants were more productive relative to exiting firms.
Importantly, the reallocation is additive and all these terms are sums of firm-level moments. There- fore, we can further distinguish between the contribution of HGFs and other continuing firms (similarly to Haltiwanger et al. 2016).11 The decomposition becomes:
∆P RODt= X
i∈HGF
θi,t0∆prodi,t+ X
i∈otherC
θi,t0∆prodi,t
| {z }
within
+
X
i∈HGF
(prodi,t0−P RODt0)∆θi,t+ X
i∈otherC
(prodi,t0−P RODt0)∆θi,t
| {z }
between
+
X
i∈HGF
∆prodi,t∆θi,t+ X
i∈otherC
∆prodi,t∆θi,t
| {z }
cross
+
X
i∈N
θi,t(prodi,t−P RODt0)−X
i∈X
θi,t0(prodi,t0−P RODt0)
| {z }
net entry
The total contribution of HGFs will be the sum of the three HGF terms, i.e. P
i∈HGF θi,t0∆prodi,t+ P
i∈HGF(prodi,t0−P RODt0)∆θi,t+P
i∈HGF∆prodi,t∆θi,t.
The terms in this formula suggest that HGF contribution is likely to be large in two cases. First, if high-growth firmsincrease their productivityduring their high-growth phase, both the within and cross terms tend to be positive. The HGFwithin term captures whether HGFs increase their productivity. The HGF
11As the definition of HGFs requires these firms to be present before the HGF phase and by definition HGFs should still operate int, there is no entry and exit of HGFs betweent0andt.
crossterm ∆θi,t is positive by definition for all HGFs and, therefore, the sign of thecrossterm is primarily determined by the sign of productivity changes. Therefore, both terms are mainly driven by productivity growth during the high-growth phase, but thewithinterm weights firm-level productivity changes with their initial size while the cross term weights them by their size growth. The second way HGFs can contribute positively is via reallocation. If high-growth firms aremore productive initially, reallocation of resources to them will improve aggregate productivity. This channel is captured by thebetweenterm.
In our main exercise we decompose productivity growth for 3-year periods between 2001 and 2016 for each 2-digit industry. Productivity decomposition is usually less noisy in such ‘medium-term’ periods and they may better reflect the timeline of such economic processes as reallocation. 3-year periods also correspond to the time span of the standard OECD HGF definition. We present these decompositions separately for different cohorts of HGFs. The cohort of year t consists of firms which were in their high-growth phase betweentandt+ 3.
3 Definitions
The focus of this section is to introduce the different HGF definitions we use and to present a number of patterns. These help us to understand how the different types of HGFs contribute to aggregate productivity growth and to investigate the relevant differences between the firms captured by the different definitions.
To present the patterns in a transparent way, the figures and tables in this section mainly focus on firms which were HGFs between 2013 and 2016 (the 2013 cohort), our last cohort. The patterns are similar for other cohorts, and we note any exception.
3.1 HGF definitions
The literature provides multiple definitions for HGFs (OECD 2010), differing across two key dimensions.
First, any type of size change can be measured in absolute or relative terms. One class of definitions relies
solely on relative growth, while definitions in a second class use a combination of relative and absolute growth. For simplicity, we refer to the former as the OECD (based on OECD 2010), and the latter as the Birch (Birch 1981) method. Second, firms’ performance can be assessed based on employment (more generally, input) or sales (output) dynamics.
Table 1 presents the typical definitions used in the literature. Within the relative definitions, one can distinguish between employment (input) and sales (output) based OECD definitions. The OECD definition requires a firm to grow by 20% on average per annum for three years. The Birch definition captures firms which are in the top 5 percentile based on an average of absolute and relative growth. Again, we will distinguish between labor and sales growth based definitions. To make the results comparable, we will use the 3-year time frame in all cases.
Table 1: HGF definitions
Input-based output-based
Relative (OECD) definition
Average annualized employment growth greater than 20% per annum, over a three-year period
Average annualized turnover or sales growth greater than 20% per annum, over a three-year period
Absolute + Relative (Birch) definition
Top 5 percentiles of the three-year average growth distribution, where growth in each period is measured by: (empt−empt−3)empempt
t−3
Top 5 percentiles of the three-year average growth distribution, where growth in each period is measured by (salest−salest−3)salessalest
t−3
3.2 How dissimilar are the different HGFs?
We now show to what extent and how firms covered by the different definitions are dissimilar from each other.
For its policy implications, it is important to assess whether differences in productivity growth contributions stem from the use of different definitions. We proceed in three steps. First, we document the overlap between the different definitions. Second, we show how the economic footprint and its change differ across groups.
Finally, and most relevantly for the productivity decomposition, we quantify productivity and employment growth during and around the high-growth phase.
We find that if two definitions differ in only the growth measure, the overlap is between 45-63%, while if they differ in both dimensions, the overlap is closer to 26-46% (Table 2). In other words, the various
HGF measures overlap to some extent but capture a quite different set of firms.12 Based on these differences it is plausible that differently defined HGFs contribute very differently to aggregate productivity.
Table 2: Overlap between different HGF definitions, 2013
OECD (emp) OECD (sales) Birch (emp) Birch (sales)
OECD (emp) 100.0% 57.9% 57.1% 26.0%
OECD (sales) 57.9% 100.0% 46.1% 62.5%
Birch (emp) 57.1% 46.1% 100.0% 45.3%
Birch (sales) 26.0% 62.5% 45.3% 100.0%
Note: The overlap between any definition pairs i and j is calculated as:overlapi,j=min(NNi
i;Nj), whereNis the number of firms in a set.
Next, we document the footprint, in terms of the number of firms, of the different types of HGFs.
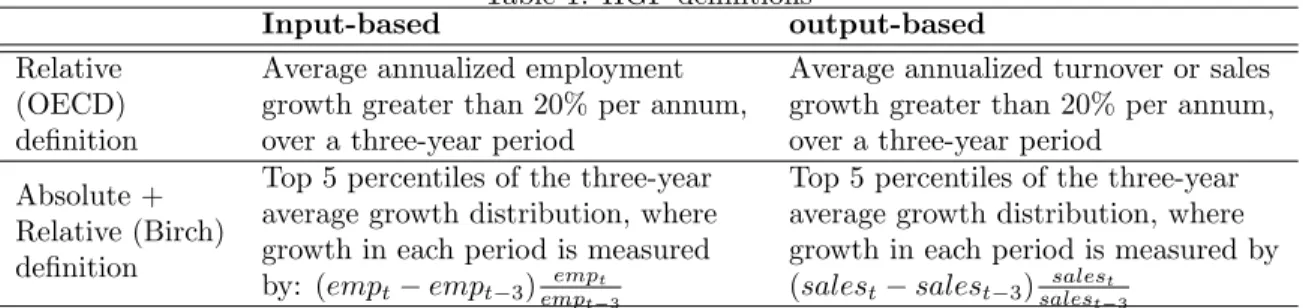
By definition, the Birch definitions cover 5% of firms, therefore, the question is only relevant for the OECD definitions. Figure 1 shows the share of HGFs in 2013 by industry for the two OECD definitions.13 With few exceptions, the share of employment OECD HGFs is between 1 and 6% and that of sales HGFs is between 3 and 10%.14 The key pattern is that the OECD sales definition captures a significantly larger group of firms compared to the employment definition. Therefore, a substantial subset of sales HGFs actually expand their sales faster then their employment during the 3-year period, which suggests that increased productivity is a key source of growth for many sales HGFs.15 This is the first indication that sales HGFs are more likely to increase their productivity and, therefore, to contribute more to industry productivity growth.
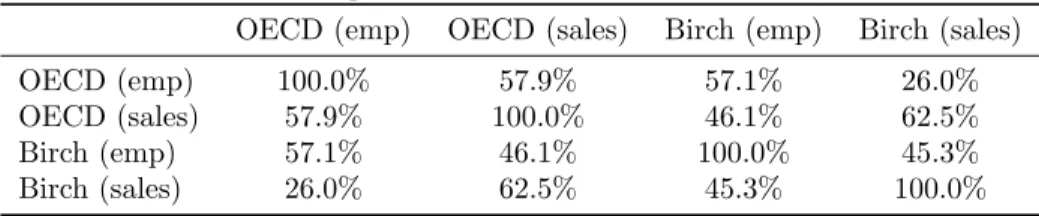
The empirical relevance of the two dimensions which distinguish between the different HGF defini- tions can be more clearly seen when we quantify the economic footprint of HGFs by their industry share in terms of employment and sales. This is illustrated by Figure 2, which shows HGFs’ employment and sales share at the beginning of the period (horizontal axis) and after 3 years (vertical axis) by 2-digit industry.
The 45-degree line represents no change in employment share.
HGFs captured by the OECD and Birch definitions have a very different economic footprint. For
12As a comparison, Delmar et al. (2003) show that from the Swedish HGFs defined based on absolute growth about 15% has high growth only in sales but not in employment and 20% has high growth only in employment but not in sales. Shepherd &
Wiklund (2009) find that the correlation between employment and sales growth is moderate. Daunfeldt et al. (2014) show that within employment HGFs the correlation between Birch-type composite and relative-growth based measures is 47% in Sweden.
13The figure omits the outlier industry 7 (Mining of metal ores), where the number of firms is very low and the share of sales HGFs is 25%. Note that the share of HGFs according to the Birch definitions is fixed for each year. Also, recall that our sample consists of firms with 5 or more employees in at least one year.
14While the magnitudes are similar, HGF prevalence depends strongly on the macro cycle. These numbers are similar to what was found in comparison countries, Grover Goswami et al. (2019), Figure 1.1.
15Clearly, instead of productivity growth an increasing use of other inputs (materials or capital) might also explain this pattern. However, as we will see later, TFP growth is the main explanation.
Figure 1: Share of HGFs in the total number of firms, 2013
5
6
8 9
10 11
12
13
14 16 15
17 18
19
20 21
22
23
24 25 2726
28
29 30
31 32 33 4547 46
49
50 51
55 56 52
58 59
60 61
63 62
69
70 71
72
73
74 75 77
78
79
80 82 81
0 5 10 15
Share of OECD sales HGFs (% of firms)
0 2 4 6 8 10
Share of OECD emp HGFs (% of firms)
The figure shows the share of firms which were HGFs between 2013 and 2016 according to the OECD (employment) and OECD (sales) HGF definitions by 2-digit industry. The sample includes firms which had at least 5 employees at any point.
OECD HGFs, the median initial employment and sales shares are around 4% and 8%, respectively, while the typical initial shares are around 20-30% for Birch HGFs. By definition, HGFs’ industry share increases during their high-growth phase, represented by the cluster of industries being above the 45-degree line.
Regarding employment and sales HGFs, there are three clear patterns in the figures. First, both types of firms increase their share both in terms of employment and sales. Second, as expected, HGFs increase their share more in the dimension corresponding to the definition. Combining these two observations implies that sales-based HGFs are more likely to increase their productivity and still create jobs, though to a smaller extent than employment-based HGFs. Finally, the differences between the employment and sales-based HGFs are more pronounced for the OECD definitions compared to the Birch definitions. This is likely to be driven by the larger fluctuations that characterize smaller firms.
The above patterns suggest that the different definitions cover markedly different firms with a different productivity performance. Table 3 investigates the latter question more explicitly with TFP, while
Figure 2: Employment and sales shares of different HGFs in the beginning and at the end of the high-growth period 2013
5 6 78 9
1011
12 13 14
15
16 17 18 192120
22 23
24 25 2627 28
29 30
31 32 33
45 46 47
49
50
51
52
55 56
58 59
60 61
62 63 69
70 71
72 73 74 7577
78
79 80
81 82
0 .1 .2 .3 .4
Share (2016)
0 .05 .1 .15
Share (2013)
(a) OECD (emp), employment share
5 6 78 9
10 11
12 13
14
15
16
17 18 192120
22 232425 26
27 28
3029 31
32 33
45
4746 49
50
51
52
55 56
58
59
60 61
62
63
69 70
71
72 73 74
7775
78
79
8180 82
0 .1 .2 .3
Share (2016)
0 .05 .1 .15 .2 .25
Share (2013)
(b) OECD (emp), sales share
5
6
7
911810 12
13 14 15
16 17
18
19 2120
22 2423
25 26
28 27 29
30
31 32
33 45 4746 49 50
51 5255
56 5958
60 61
62
69 63 70
717273 7475 77
78
79 80
81 82
0 .2 .4 .6 .8
Share (2016)
0 .2 .4 .6
Share (2013)
(c) OECD (sales), employment share
5
6
7
8 9
1011 12
13 14 15
16 17
18
192120 23242522 26
27
28 29
30
31 32
33 45
4746 49 5150
5255 595658 6061
62
6963 70 71
72 73 74
7775
78
798081 82
0 .2 .4 .6 .8 1
Share (2016)
0 .2 .4 .6
Share (2013)
(d) OECD (sales), sales share
5
6
7
8
9
10
11 12
13 14
15
16 17 18
19
20
21 222324
25 26
27 28
2930 31
32
33 45 4647
49
50
51
52
55 56
58
59 60
62 61 63 69
7170 72
73 74 75
77 78
79 8180
82
0 .2 .4 .6 .8
Share (2016)
0 .2 .4 .6 .8
Share (2013)
(e) Birch (emp), employment share
5
6
7
8 9
10
1112 13
14
15
16 1817
19
20
21 222324 25
26
28 27
29 30 31
32
33 45
46 4947
50
51
52 55 56
58
59
60
61 62
63 69 7170
72
73 74
75 77
78
79 80 81
82
0 .2 .4 .6 .8 1
Share (2016)
0 .2 .4 .6 .8 1
Share (2013)
(f) Birch (emp), sales share
5
6 7
8 9
10 11
12 13 14
15
16 17
18
19
20
21 22
23 24
25
26
27 28
3029 31 32
33 45 46
47 49
50
51
52 55
56 58 59
60
61
62
63 69
70 71
72
73 74
75 77
78
79 80
81 82
0 .2 .4 .6 .8 1
Share (2016)
0 .2 .4 .6 .8
Share (2013)
(g) Birch (sales), employment share
5
6 7
8
9
10
11
12 13
14
15
16
17
18
19
20
21
22 23 24
25
26
27 28
29 30
31 32
33
45
46 47
49
50
51
52 55
58 56 59
60
61
62 63
69
70 71
72
73 74
75
77 7978 80
81 82
0 .2 .4 .6 .8 1
Share (2016)
0 .2 .4 .6 .8 1
Share (2013)
(h) Birch (sales), sales share This figure shows the employment and sales share in 2013 and 2016 of firms which were HGFs in 2013 according to the different definitions. The numbers show the NACE code of 2-digit industries and the line is the 45-degree line. The sample includes firms which had at least 5 employees at any point.
Table A2 repeats this exercise in terms of labor productivity. The tables show HGF performance one year before (t-1) and four years after (t+4) the beginning of the high-growth phase. The premia are expressed as the (unweighted) average number of employees and total factor productivity of HGFs relative to that of the average firm (scaled to be 100%).
Let us start with the relative/absolute dichotomy. We find that the two OECD definitions identify firms that are initially significantly smaller than the average firm. On average, these HGFs employ 27-42%
fewer employees before their high-growth phase than the average firm, and 18-86% more after that. In contrast, according to the Birch method, HGFs are 104-204 percent larger than the average firm even before the high-growth phase.
Related to their larger size, Birch HGFs are also more productive.16 The initial productivity premia are substantially larger for the Birch definitions (25-87%) compared to the OECD definitions (-8-37%). These differences in initial productivity premia suggest a larger potential reallocation effect for Birch HGFs.
In line with the patterns in Table 2, irrespective of the definition used, HGFs create a significant number of jobs. As expected, average employment growth is somewhat higher under the employment-based than under the sales-based definition. Using employment-based definitions, relative to the average firm, the average HGFs’ employment grows by 118 percentage points based on the OECD definition, and by 290 percentage points based on the Birch definition. Using sales-based definitions yields smaller estimates, but the magnitudes are still noteworthy: 58 and 166 percentage points according to the OECD and the Birch definition, respectively.
Regarding productivity, we find that input-based OECD-type HGFs are more productive initially:
their initial productivity premium is 25% on average while it is -3% for output-based HGFs. The pattern is just the opposite for the Birch definition. Additionally, while output-based HGFs have stable (for Birch) or growing (around 15 percentage points for OECD) productivity during the high-growth phase, HGFs that are defined based on input growth experience a productivity decline of a similar magnitude (-24 percentage
16As an example, Medrano-Ad´an et al. (2019) present a model which explains the pattern of positive correlation between size and productivity. Leung et al. (2008) also refer to theoretical and empirical evidence.
points for the OECD and -31 percentage points for the Birch definition).
An important message of this table — in line with the previous figures — is that there seems to be some, but not very strong trade-off between job creation and productivity growth: employment-based HGFs create more jobs while sales-based HGFs increase their productivity more. However, the difference between the two groups in terms of productivity growth is much more characteristic than their difference in job creation. Sales-based HGFs increase their productivity substantially and create a large number of jobs at the same time, while employment-based HGFs face declining productivity.
3.3 HGF dynamics
When we want to evaluate the effect of HGFs on the economy, the appropriate time frame is far from evident.
It is possible that, for example, the high growth in employment is followed by a productivity increase many years later. Alternatively, HGFs may follow quite risky strategies, and any gains generated during the high-growth phase may be undone by regression to the mean or increased probability of exit. The aim of this subsection is to provide descriptive evidence for these eventualities. We do so in three steps. First, we investigate the productivity trends after the high-growth phase by further analyzing Table 3. Second, we use a transition matrix approach to check the persistence of the HGF status itself and whether the same firm is likely to undergo different types of growth subsequently. Finally, we check whether HGFs are more likely to exit compared to other firms.
Table 3 allows us to follow the firms before and after their high-growth phase. Compared to the developments during the high-growth period, the productivity and employment changes before and after are relatively small. Still, the high-growth phase seems to be typically preceded by productivity growth for all the different definitions, although to a different extent.17 The gains in productivity seem to largely persist until 3 years after the high-growth phase, while the employment level increases further.
The fact that these pre and post trends are relatively modest suggest that high growth seems to be
17This is in line with Moschella et al. (2019), who find for Chinese firms that firms with higher productivity are more likely to become HGFs, defined as a combination of sales and employment growth.
Table 3: Employment and TFP before and after the high-growth phase by definition oecd3 (emp)
employment TFP
year t-4 t-1 t+4 t+7 t-4 t-1 t+4 t+7
1999 60.2% 171.1% 182.9% 137.4% 104.1% 104.7%
2002 53.9% 58.3% 174.3% 171.7% 116.5% 134.3% 103.4% 106.7%
2005 63.2% 67.0% 186.3% 193.2% 111.5% 123.6% 102.9% 104.2%
2008 58.8% 58.1% 185.0% 92.9% 112.9% 93.5%
2011 64.9% 62.6% 111.7% 115.9%
average 60.2% 61.3% 179.2% 182.6% 108.1% 124.8% 100.9% 105.2%
oecd3 (sales)
employment TFP
year t-4 t-1 t+4 t+7 t-4 t-1 t+4 t+7
1999 70.9% 118.4% 127.6% 99.2% 109.2% 103.8%
2002 70.2% 73.9% 134.7% 145.6% 95.0% 102.6% 113.4% 111.4%
2005 65.7% 70.3% 129.5% 138.8% 93.2% 94.2% 111.0% 109.9%
2008 70.5% 68.1% 134.5% 86.5% 97.9% 114.7%
2011 72.1% 71.2% 92.9% 91.9%
average 69.6% 70.9% 129.3% 137.3% 91.9% 97.2% 112.1% 108.4%
birch3 (emp)
employment TFP
year t-4 t-1 t+4 t+7 t-4 t-1 t+4 t+7
1999 203.8% 499.5% 545.7% 152.4% 109.5% 110.8%
2002 210.2% 210.9% 498.3% 531.7% 132.2% 142.0% 110.0% 111.9%
2005 259.4% 246.3% 568.7% 603.0% 131.4% 151.4% 113.9% 116.2%
2008 221.9% 204.7% 477.1% 113.8% 124.8% 103.6%
2011 233.5% 237.6% 119.8% 129.5%
average 231.2% 220.7% 510.9% 560.1% 124.3% 140.0% 109.2% 113.0%
birch3 (sales)
employment TFP
year t-4 t-1 t+4 t+7 t-4 t-1 t+4 t+7
1999 304.5% 480.8% 522.5% 186.6% 164.7% 154.3%
2002 257.4% 246.1% 432.0% 496.2% 163.9% 172.6% 173.5% 156.1%
2005 249.3% 253.9% 436.5% 487.1% 165.1% 175.2% 171.6% 164.5%
2008 207.7% 205.5% 348.3% 151.5% 159.1% 175.2%
2011 278.8% 283.0% 153.9% 164.8%
average 248.3% 258.6% 424.4% 501.9% 158.6% 171.7% 171.3% 158.3%
This table shows HGF performance one year before (t-1) and four years after (t+4) the beginning of the high-growth phase, as well as an additional 3 years before (t-4) and after that (t+7). The premia are expressed as the (unweighted) average number of employees and labor productivity of HGFs relative to that of the average firm (scaled to be 100%).
a transitory phase in most firms’ life.18 From an empirical point of view, this finding suggests that one can safely focus on the changes during the high-growth phase when assessing the contributions of these firms to aggregate productivity and can mostly ignore what happens before and after the high-growth phase.19
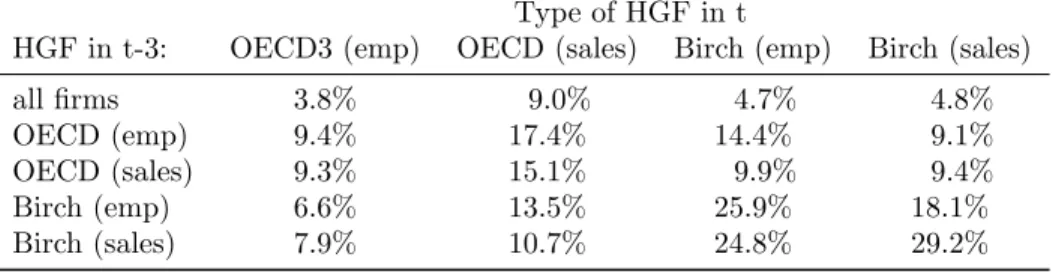
While Table 3 provides no evidence for extra productivity growth on average after the high-growth period, it is still possible that for many firms the high-growth phase takes substantially longer than 3 years, or that one type of high growth is typically followed by another type (for example, employment-based by sales-based). A straightforward way to test for these possibilities is a transition matrix approach. Table 4, shows the probability that a firm which was a HGF between t-3 and t is also a HGF (according to the different definitions) between t and t+3. A key pattern is that HGF status is persistent: depending on the definition, a firm which was HGF between t-3 and t is about 2.5-6 times more likely to become the same type of HGF again between t and t+3 than the average firm. The persistence of a Birch-type HGF status is much stronger than that of the OECD-type HGF status. The main driver of this pattern might be the importance of firm size, quite a persistent feature, in the Birch-type definition. Note, however, that persistence is limited: the overwhelming majority of HGFs will not remain a HGF in the next period, and high-growth status is often only a phase rather than a permanent characteristic of a firm’s life.
Table 4 also provides some limited evidence for different types of high-growth periods following each other.20 For example, employment OECD HGFs are slightly more likely to become sales OECD HGFs in the next period than sales OECD HGFs do, but the difference is small. In the case of Birch firms, we find evidence for the opposite phenomenon: sales-based HGFs are more likely to become sales-based HGFs in the next period than employment-based HGFs do.21
18Previous research already provides evidence for the temporary nature of the high-growth phase (see e.g. Acs et al. (2008) using US data, Daunfeldt & Halvarsson (2015) using Swedish data or H¨olzl (2014) using Austrian data). Delmar et al. (2003) show that high employment or sales growth comes from a single year in 22% and 27% of all Swedish HGFs respectively. On the other hand, Coad & Srhoj (2019) find that Croatian and Slovenian firms with higher previous employment growth become HGFs with a higher probability. Additionally, Lopez-Garcia & Puente (2012) demonstrate that more than half of Spanish HGFs were already HGFs in the previous period.
19As we will see in the next section, the Birch (sales) definition is a partial exception. These firms are highly productive prior to their high-growth phase, and grow both in size and productivity in the pre-period. As a result, they contribute substantially to productivity growth even betweent−3 andt, because both their between and within terms are positive.
20Davidsson & Wiklund (2006) suggest that change in demand first leads to a change in sales, and it might change the level of employment only afterwards. As opposed to that, Delmar et al. (2003) emphasize the high variability in growth patterns.
21These patterns are similar for the other periods, and they are also in line with the findings of H¨olzl (2014) or Daunfeldt et al. (2014), who show for Austrian and Swedish firms that Birch HGFs have more persistent growth than OECD HGFs.
Table 4: Transition matrix between different types of HGFs, t=2013 Type of HGF in t
HGF in t-3: OECD3 (emp) OECD (sales) Birch (emp) Birch (sales)
all firms 3.8% 9.0% 4.7% 4.8%
OECD (emp) 9.4% 17.4% 14.4% 9.1%
OECD (sales) 9.3% 15.1% 9.9% 9.4%
Birch (emp) 6.6% 13.5% 25.9% 18.1%
Birch (sales) 7.9% 10.7% 24.8% 29.2%
This table shows the probability that a firm which was a HGF between t-3 and t is also a HGF (according to the different definitions) between t and t+3.
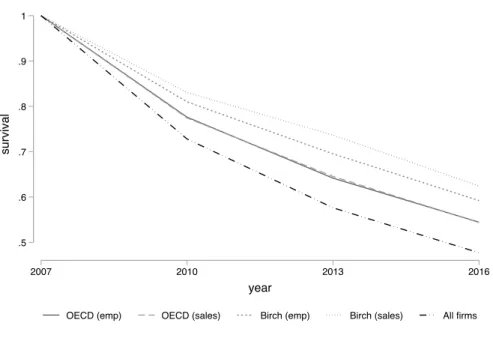
As we have mentioned, if HGFs are more likely to exit because their growth strategies are more risky, their long-term contribution may be small. To explore this possibility, Figure 3 shows survival rates calculated from 2007 for firms that were HGFs between 2004 and 2007 and for other firms.22 We find that all types of HGFs are actually less likely to exit than non-HGFs.23 The least likely to exit are the sales-based Birch-type HGFs followed by the employment-based Birch-type HGFs and then the two types of OECD HGFs. The differences become smaller but still visible when we control for industry, size and age.
The evidence presented in this subsection suggests that productivity change is concentrated in the high-growth phase. This observation is reinforced by finding that HGF status is typically transitory. Also, excessive exit is unlikely to be an important factor determining long-term HGF contributions.
4 HGFs’ contribution to total productivity growth
While the previous section has provided descriptive evidence about HGFs’ productivity and employment growth, here we focus explicitly on HGFs’ contribution to productivity growth, which is the main interest of this paper.
We rely on the decomposition methodology presented in Subsection 2.2. Our unit of observation
22We have chosen this early cohort so that we can follow their survival in the long run. By definition, HGFs cannot exit in their high-growth phase, therefore calculating survival from 2004 would be ‘unfair’ to non-HGFs. That is why the figure starts from 2007 and compares firms which were in their high-growth phase in 2004 with all the firms that were active in 2004 and survived up to 2007. To be conservative, we do not include new entrants in the non-HGF group.
23Acs et al. (2008) find that only 4% of US HGFs exit in the 4-year period after their high-growth phase, and Choi et al.
(2017) and Mohr et al. (2014) show evidence for the positive impact of early-phase high-growth status on subsequent survival probability. On the other hand, Delmar et al. (2013) find a negative effect of growth on survival. Gjerløv-Juel & Guenther (2019) show that high employment growth of young firms is linked with a higher subsequent survival probability only if there is low employee turnover after the growth phase.
Figure 3: Survival by HGF definition
.5 .6 .7 .8 .9 1
survival
2007 2010 2013 2016
year
OECD (emp) OECD (sales) Birch (emp) Birch (sales) All firms
The figure shows the survival rate of firms already existing in 2004 from 2007 on by their HGF status between 2004 and 2007.
is a cohort (c) in industry (j). We denote the base year of cohort c bytc0 and firms are considered as part of the cohort if their annual growth rate betweentc0 andtc0+ 3 was above the threshold prescribed by the relevant definition. The productivity contribution of cohort c in industry j between tc0 and tc0+ 3 will be denoted bycontjc. These objects, which are defined at the industry-cohort (year) level, will be our units of observation.
4.1 How much do HGFs contribute during their high-growth phase?
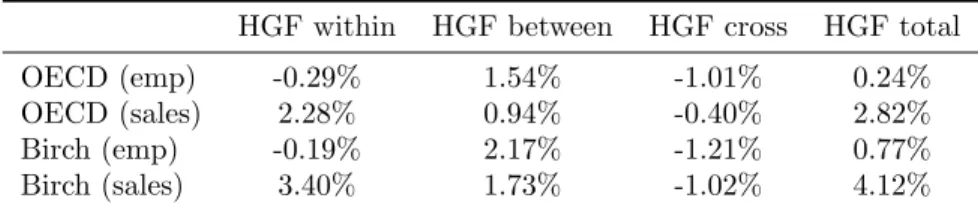
Let us start with the overall average of HGF contributions across industries and cohorts,contjc(Table 5).
The total HGF contribution differs strongly across definitions. In general, it is larger for Birch definitions than for OECD definitions and it is larger for sales-based definitions compared to employment- based definitions. Birch-sales HGFs contribute the most on average (4.12 percentage points), followed by OECD-sales HGFs (2.82 pp.). The contribution of employment HGFs is substantially lower, with 0.24 pp.
for the OECD and 0.77 pp. for the Birch definition.
The productivity decomposition exercise reveals the source of these differences. First, the within
contribution of the sales-based definitions is strongly positive while that of the employment-based definitions is small and negative. This results from the fact that productivity typically increases (or is stable) for sales- based definitions while it falls for the employment-based definitions (Table 3). The averagebetweeneffect is positive for all the definitions, showing that HGFs are typically more productive than their peers. There is some variation, mainly resulting from the differences in initial productivity advantage and the employment growth rate during the high-growth period. The relatively low between contribution of OECD (sales) HGFs results from their lower initial productivity level. Finally, thecrosscontribution is negative for all definitions.
This reflects that overall there is a negative correlation between size and productivity growth, as we will discuss in the next subsection.
Table 5: Decomposing the HGF contribution to TFP growth HGF within HGF between HGF cross HGF total
OECD (emp) -0.29% 1.54% -1.01% 0.24%
OECD (sales) 2.28% 0.94% -0.40% 2.82%
Birch (emp) -0.19% 2.17% -1.21% 0.77%
Birch (sales) 3.40% 1.73% -1.02% 4.12%
This table presents the employment weighted average (across year-cohorts) of the different components of the total HGF contribution for the four definitions.
A policy-relevant insight from this pattern is that output HGFs, which contribute more than input HGFs, typically contribute via their withinterm while their initial productivity level is not especially high (Figure 3). Therefore, HGF policies which only target firms with high initial productivity levels (in the implicit hope of a strong within contribution) will capture potential input HGFs and miss potential output HGFs. Similarly, HGF policies centered on promoting employment growth rather than output growth may capture firms which contribute less to productivity growth.
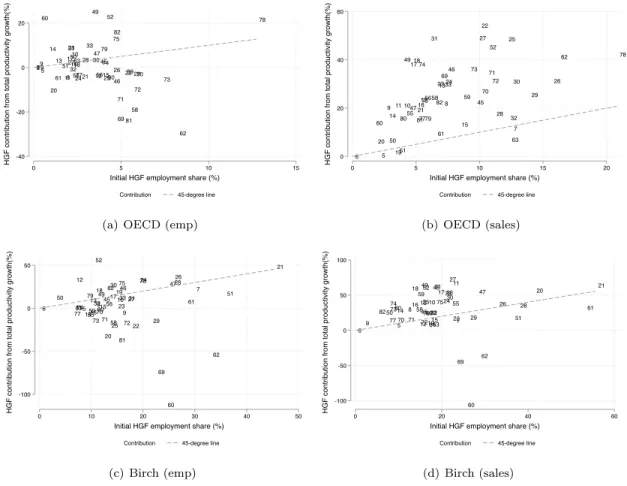
While these absolute numbers are of some interest, it is probably more relevant to ask whether HGFs contribute more than the average firm. In other words, whether the share of HGFs’ contribution is larger than their (initial) share in terms of inputs or outputs. Figure 4 illustrates this relationship at the industry level, with the average initial employment share of HGF cohorts on the horizontal and the average ratio of total HGF contribution and industry-level TFP growth on the vertical axis.24
24Here we omit observations where industry-level productivity growth was negative, because in such cases the ratio is hard to interpret.