SOME FAIRYTALES ABOUT RISK MANAGEMENT
Péter Medvegyev
INTRODUCTION
When I started writing this paper, I thought I would only be writing about the parallel between the mathematical theory of inventory and production – as a fa- miliar model of operations research – and liquidity management. And then dur- ing the writing process, predictably enough I must say, the scandals surrounding the Buda-Cash and Quaestor brokerages erupted. Likewise in this period, the de- bate about foreign currency lending gained fresh impetus; about who made which mistakes when, or whether there was anyone who didn’t make mistakes. Th e most surprising twist revealed in the Buda-Cash and Quaestor cases – beyond alleged losses running into several hundreds of billions of forints – was that all this could be accumulated in 15 years of selfl ess eff ort. And even if this information proves to be comment born of initial over-excitement, it still demands an explanation one way or another. If it’s true, then how can this be? And if it isn’t, then what made it appear as if this is what happened? Th e questions and contradictions are obvious.
But the main questions are these: What do risk managers actually do? What do we pay them for? And how far can we trust them?
JEL codes: G00, B41
Keywords: risks, paradigms, martingales
As always, it’s worth beginning from the beginning: What is fi nancial theory about? As evident from the title of this paper, my view is that, despite the very serious mathematical deliberations it entails, modern fi nancial theory largely consists of fairytales. Or, to put it more elegantly, fairytales written in fi nely em- bossed language. Naturally, I need to refi ne this somewhat in order to make my observation completely clear. By fairytale I mean a stylised chain of thought with a useful moral, relating to reality in an indirect and very oblique way. I wouldn’t be so bold as to claim I can construe an entire worldview from, say, the well- known fairytale of Little Red Riding Hood, but the story still reveals that it isn’t necessarily the best idea for young girls to wander alone in the woods in short red dresses. Or take the touching story of Cinderella, where steadfast eff ort and self-sacrifi ce bring their own reward, or where not everything is as it seems. Or perhaps it is aft er all?
Th e good thing about a fairytale is that it mixes desires and reality. In other words, there is a core of truth in every fairytale – but only the core. In fairytales there is
much truth and a lot of garnish, the aim of which is to conceal the naked truth and the brutal reality with sanctimony and euphemism. Th is is why we tell them.
Th e more popular a fairytale, the more useful, colourful and many-layered the inherent morsel of truth it contains. A good fairytale is one that means something to everyone. It can be told in a thousand ways, it has a thousand interpretations, and anyone can represent and quote it as they see fi t. At the same time, every fairytale is also a work of literature, so that not only the content but the form, too, is highly important. Th e truly great storytellers can spin a little yarn into a novel hundreds of pages long – or round out a mathematical deduction – by embel- lishing otherwise irrelevant details. Clever hints, bravura non sequiturs, oblique circumlocution and a parade of linguistic invention: these are things which make a fairytale truly pleasurable. A true fairytale is a triumph of form over content, where appearance obscures reality.
THE FIRST FAIRYTALE: A TALE OF DUALITY
A signifi cant portion of modern economic theories are based on a very simple mathematical theory, namely the duality of convex sets.1 If we really want to sim- plify things, we could say the following: economic theory holds that everyone will try – one way or another and as circumstances permit – to improve their situa- tion. It follows from this that the main tool in modelling is constrained optimisa- tion. Th e basic idea2 is that the prevailing production constraints must be multi- plied by the appropriate prices – in technical language the Lagrange multipliers – and added to the direct objective function; the function thus constructed, the Lagrange function, must then be optimised without constraints.3 Th e question obviously arises of how we calculate the magical Lagrange multipliers; in other words, how do we determine the prices? Th is is where the aforementioned duality theory comes in. Th e essence of the duality theory is the observation that if the intersection of two convex sets is empty, then there is a linear function of which the greatest value is smaller in one set than the smallest value included in the other. In other words, the giant among the dwarves is not larger than the dwarf among the giants. Th ere is a value which separates the giants from the dwarves.
Whoever falls below this is a dwarf, no matter how big they grow, and whoever is above it is a giant, even if short in stature. In mathematical language we say
1 Th e writing on duality in mathematics and economics is vast. Th e most signifi cant work in Hun- garian is Ernő Zalai’s Mathematical Economics (2011–2012), Vol. I–II, Budapest, Akadémiai Kiadó.
2 Somewhat irreverently: since the Phoenicians invented money, everything has a price.
3 Th e Lagrange multipliers are used mainly in solving theoretical problems. Numerous methods are known in the actual numerical resolution of problems, but these are not related to the theory of duality.
that the two convex sets are separated. Th e disjointness serving as the basis of the separation mostly arises when the production set containing the possible production processes does not contain any “positive” elements; in other words, there is no production vector which produces something from nothing, which is also to say that each component of every possible production vector must be non-negative4 and that every production process is built on the utilisation of a given resource. To put it another way: something will not come from nothing.
Th ere is therefore no common point between non-negative vectors and the set of production possibilities.5 It is easy to see that the coeffi cients of the linear function guaranteed by duality cannot be negative6 and that these non-negative weights are precisely what provide the sought-aft er Lagrange multipliers; i.e. the prices of the constraints interpreted as a resource. And now, putting it another way, the essential point: the prices are the direct mirror images of prevailing technical and production constraints. Th eir value depends purely on how the set of possible production solutions is positioned; in other words, prices are functions of the geometry of the production set. Th is is to say that the formation of prices is not an independent economic category, but a consequence or – as mathematicians would have it – a dual pair or mirror image of the current status of resources and production possibilities. Th is kind of mental process was unquestionably popular in the second half of the 20th century, particularly among theorists of the planned economy. Of the numerous models, it is worth highlighting one of the simplest, the so-called von Neumann model.7 According to this model, there are two given matrices, A and B, which represent expenditures and output for each product and production process.8 Th e elements of the A and B matri- ces are functions of the prevailing technical and technological constraints, and are thus essentially technological parameters. With the aid of the matrices, two problems can be formulated: on the one hand, on the primal side, where expen- ditures at any given time must be covered by output; and on the other hand on the dual side, which dictates that costs and revenues must be in equilibrium. Th e model describes a dynamic condition, i.e. one that changes in time. More pre- cisely, the model is only stationary, and thus assumes that in a state of equilib- rium the proportions of primal and dual solutions remain unchanged, but on the
4 Th is is why the word “positive” appears in quotation marks. Th e coordinates can be zero as well, but if there is a positive coordinate then there must also be a negative.
5 If we want to be really precise, then the point of zero can be a common point.
6 Th is is to say that increasing the multiplier along the negative coordinate we may obtain an arbi- trarily low value, which contradicts the separation.
7 Th ere is a wide range of writing in Hungarian on the von Neumann model. Th e model and related generalisations are discussed extensively in Ernő Zalai’s aforementioned work.
8 Given that the model has fi nite dimensions, the number of production processes and products is fi nite. When we attempt to introduce randomness into the model, then we must deal with an infi nite number of cases, which upsets the fundamental mathematical structure of the model.
primal side the dynamics of variables in time are described by a λ growth rate, and on the dual side by a μ interest rate. If in any given period the structure of production is described by an x vector,9 then the Bx vector is precisely the amount of manufactured products. Due to the condition of steady growth, the structure of production in the ensuing period is λx, for which the required resources are A(λx) = λAx. Th is must be covered from the aforementioned Bx vector. In other words, the λAx ≤ Bx inequality must by all means exist. Or to put it another way, the expenditure for the ensuing period must be covered from the production in the current period. If λ is the greatest possible rate of growth that can be achieved, then (B – λA)x cannot be positive, because if it was then λ could be increased.
Due to the aforementioned separation theorem, the structure of the (B – λA)x set provides the vector of possible prices, as well as the μ growth rate of the produc- tion value. And what is the essential point for us: disregarding a few special cases, the values behind the two Greek letters coincide. Th is is to say that in the von Neumann fairytale world, the rate of return in the dual fi nancial sector cannot be greater than the maximum rate of growth in production. Or to put it another way, if in an economy there is a low possible rate of growth on the primal side construed as production, then the return on fi nancial investments must also be low. Miracles still do not exist, and the fi nancial sector does not generate value; in other words, it is only possible to distribute what we have produced anyway. Or, to put it in some- what stronger terms, whoever promises more than the maximum possible growth rate of the economy is a fraudulent gambler, and must be treated as such.10 Anyone can suggest that the von Neumann model and all its associated generali- sations are too simple, and that the conclusions thus have no relevance. Obviously, aft er all it’s only a fairytale. However, it is a fairytale that has since been told very oft en by a great many people. Th e latest and currently very fashionable form of the fairytale, arbitrage pricing theory, is built on these same conceptual elements, ex- cept that the new storytellers substitute the simple and now threadbare trappings of the von Neumann model and the convex cones of fi nite-dimensional spaces for the dazzling objects of probability variables and stochastic processes. (Th eir ballads nevertheless remain obscure about the provenance of the risk-free interest rate, the magical r; in other words, they do not specify the connection between λ and r, alias μ.) In general mathematical terms, there is no diff erence between the duality theorem of the von Neumann model and the arbitrage theorems of asset pricing. Both are duality theorems. Th e sole diff erence is that while in the von Neumann model the A and B matrices are interpreted to contain production co-
9 We assume that the x vector cannot be negative.
10 Th omas Piketty’s famed r>g inequality asserts that there is no equality arising from the von Neumann model. But the reason for this is precisely the shouldering of risk which is the subject of the next fairytale. Cf. Thomas Piketty(2015): Capital in the Twenty-First Century, published in Hungarian by Kossuth Kiadó.
effi cients, the basic data of arbitrage theory are random yields. Financial models feature not production processes but fi nancial assets, and not products but yields or losses deriving from random outcomes. In other words, the basic information is not how much a given production process uses or produces of a given product, but rather how much yield or loss a given fi nancial asset produces in a given ran- dom position.11 Th e x vector of the production structure is replaced by portfolio weights. Th e von Neumann model combines production processes, while modern fi nancial theory12 “manufactures” portfolios of individual fi nancial products. Th e von Neumann model concludes from the maximal nature of the growth rate that no positive output is possible without actual expenditure, while fi nancial theory explicitly declares the same thing with the condition of no arbitrage. It is the same mathematical story, with diff ering interpretations. Aside from the fact that we write stochastic integral instead of scalar product, and disregarding the decora- tive style, the essence still remains unchanged.
Th ere is, however, an essential element we cannot pass by without comment.
Modern fi nancial theory as it is currently taught speaks for itself, irrespective of elements of the economy surrounding the fi nancial sector, so that it does not connect the rate of economic growth with the growth rate of fi nancial assets. It simply declares that fi nancial assets have a “natural” growth rate, the risk-free interest rate. Th is is an external circumstance, the yield on a risk-free product.
In this way, however, precisely the most important relationship is omitted from the model and the essential point itself is not explained: What is the relationship between the natural growth rate of the fi nancial sector and the rate of economic growth? Within what limits does the profi tability of the fi nancial sector move?
If, however, the risk-free interest rate is the same as the rate of economic growth, then how can we obtain a high – or at least higher – yield in a slowly growing economy? If we cannot do it risk-free, then we must do it with risk. Greater risk, however, means that we accept a greater loss in hope of a greater profi t. Obviously if we win, all is well, as we have made good use of our professional knowledge and expect to be paid an appropriate premium. But if we lose, then we attempt to rebalance the scales by taking an even greater risk. If we are lucky, then this will succeed and we have got away with it; if not, then we take on a still greater risk.13 Th is is very similar to a pyramid scheme, but only partly so. It is customary to call this strategy the martingale or suicide strategy. Here, too, we throw more and more new money out of the window and race quicker and quicker into the abyss.
Th is leads us to the next fairytale.
11 It is worth noting the use of words: It produces a loss.
12 Th e icing on the cake is that these are termed “fi nancial products,” and are sold and marketed by the industry as such. To no avail, the word is power.
13 If the noose is really tightening, this may even include open fraud.
THE SECOND FAIRYTALE: A TALE OF MARTINGALES
Th e martingale is a central concept of modern fi nancial literature. I am not fa- miliar with the precise origin of the term martingale.14 Numerous theories and contradictory stories revolve around the connection between the martingale con- cept and the equine world, since it is well-known that, before fi nancial theory embraced the notion, “martingale” was a word used more familiarly to describe a special strap attached to a horse’s head. What we can know, however, is that the phrase was adopted by writers on mathematics from French gamblers. In casinos, the martingale concept applied to gamblers who were convinced that they had a winning strategy. Th ese strategies were known as martingale or suicide strate- gies. Th e essence of these strategies was that a sure profi t could theoretically be obtained by endlessly increasing the risk, or at least this was the intention. Its best-known example is the doubling strategy employed in the game of tossing a coin, where the bet is always doubled aft er each loss and the gambler thus plays with an exponentially increasing stake. A precise mathematical defi nition of the martingale is excessively technical in nature. For us, the original intuitive con- cept suffi ces: by martingale we mean a random process which, when resources are limited, cannot be defeated in any way on average. Besides limited resources, the emphasis here is on the stipulation of on average. In other words, for example, while it is possible to form a strategy using limited resources with a high probabil- ity of winning, the fl ipside of this likely winning strategy is the small probability of a major loss. A great many people conceive of martingales along the lines of a random walk. A random walk is a symmetric martingale. At the same time,
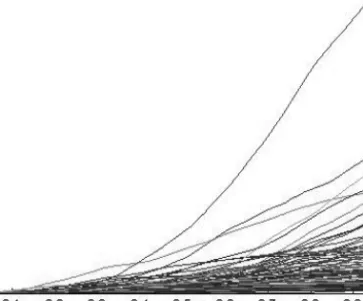
“true” martingales are asymmetric, meaning – for example – that the high prob- ability of small profi ts is balanced out by the small probability of major losses. As an example let us look at Figure 1, which depicts a Wiener process.15
14 A thorough and detailed inquiry and analysis can be found in: Roger Mansuy (2009): Th e Origins of the Word “Martingale”. Electronic Journal for History of Probability and Statistics, Vol. 5, No. 1, June.
15 Th e Wiener process is a continuous martingale. But martingales may also be discontinuous. Be- cause of this discontinuity, naïve strategies that suppose a gambler can exit with a fi xed loss do not work. I am deliberately disregarding such discontinuity and the problem of fat-tailed distributions associated with it, since the basic problem can also be demonstrated through a classical textbook example, the benign and gentle Wiener process.
Figure 1 Wiener process
Th e Wiener process is symmetric and can be regarded as the best-known martin- gale. As obvious from its name, it is a process, and so is represented by time along the horizontal axis. Th e vertical axis shows the value of the process, and the graph as a whole portrays various trajectories of the process. Figure 2 shows the stochas- tic integral of the Wiener process with respect to itself. Here, too, time is implic- itly represented along the horizontal axis while the vertical axis again shows the value of the process, with the graph as a whole describing the possible trajectories.
We will deal more with stochastic integrals later. For us, the essential point here is that the second graph also portrays a martingale. Th e diff erence is conspicuous.
In order to aid a better understanding and interpretation, we have refl ected the stochastic integral in the time axis, thus transposing the profi t and loss. It can be seen from the graph that in most cases the process generates a solid profi t. Th e upper portion of the graph is mildly positive and very densely packed. A great many trajectories run above the zero axis. Th e value of potential profi t, however, is a maximum of only 5. Th ese small-profi t trajectories are “equalised” by a few trajectories that end in a major loss. In the case of loss-making trajectories, the loss may reach as much as fi ve times the amount of the maximum profi t. At the same time, the lower portion of the graph is sparsely populated. Th e number of trajectories that generate truly great losses is negligible. It must be noted that both graphs show that while the expected value of the martingales is constant, in this case zero, the standard deviation grows ever greater, meaning that the “risk” of the processes steadily increases. It can also be seen that the standard deviation
increases much more rapidly in the case of the second graph than in the fi rst. Th e second graph derives from the same random process, the second process being a mathematical transformation of the fi rst. However, the transformation does not change the martingale nature, so that the average in the present case remains zero, although the transformation does increase the risk considerably.
Figure 2
Integral of the Wiener process with respect to itself
Here it is worth stopping for a moment for a brief digression. General equilibrium theory, the classical theory of mathematical economics of which the von Neu- mann model is a prominent element, confronted a number of fundamental math- ematical diffi culties immediately aft er its creation which it has not fully resolved since. From the mathematical perspective the problem is of a fundamentally logi- cal or technical nature, but from the point of view of the evolution of economic theory these diffi culties carry crucial signifi cance. Neither the temporal dimen- sion nor the random aspect has been convincingly, elegantly and fully integrated into models of equilibrium theory. Th e mathematical reasons for this are obvious:
the duality theorems of convex sets that play a key role in the theory are consider- ably simpler in fi nite dimensional space – and their application entails far fewer constraints – than in infi nite dimensional spaces containing probability variables or functions that change in time.16
16 A vivid sense of the potentially complicated nature of the duality theory in infi nite dimen- sional spaces, necessary for fi nancial theory, is provided in the excellent but extremely challeng- ing work by Delbaen, F. – Schachermayer, W. (2008):Th e Mathematics of Arbitrage. Springer Finance, Springer.
However, before we condemn mathematics for the failings of mathematical eco- nomics, it is worth noting that an applied model can only be mathematically re- solved if the conceptual elements are otherwise in order. When Dirac introduced his celebrated б function, which is zero everywhere except at the point zero, where its value is infi nite, and infi nite precisely to the extent that the integral of the function must be exactly 1, in other words eff ectively a density function, then most mathematicians knitted their brows. At the same time, given that the use and intuitive content of the function was consistent and clear, it took only a few years for the theory to be successfully tidied up and resolved mathematically. Th e music, melody, feeling and meaning belong to economics, and only the orchestra- tion to mathematics. In economic theory, the explanation for diffi culties that arise in connection with randomness and dynamics is not mathematical in nature.
Th e problems primarily arise because there are at least three diff erent senses in which we can speak of the random quality of fi nancial processes, or of economic processes in general. Firstly we can speak of the randomness described by classi- cal probability calculations, which it is customary to call risk. Next we can speak of volatility, and thirdly of uncertainty.
It is worthwhile briefl y recalling these concepts.17
In the case of risk, the rules of probability calculation are valid, especially giv- en that we are dealing with a repetitive phenomenon and there is a probability around which the relative frequency fl uctuates. We might say that positive and negative shift s balance each other out in the longer term. Th e main worry is that, on the one hand, the positive and negative shift s are not identical in size, while on the other hand it may happen that we have to wait a very long time for a shift in the right direction and we are unable to fi nance the wait for this favourable shift from the resources at our disposal. It is precisely because of the latter that, when defi ning a martingale, we must emphasise that the available time or resources must be limited.
A second concept related to randomness is volatility. It is a frequent habit to iden- tify volatility with standard deviation. However, this is only correct if it is a sta- tionary process. If the nature of the process changes in time, then the standard deviation can be as meaningless and misleading as the average. It is an important and oft -emphasised observation that volatility can be predicted; that although we cannot foresee the direction of growth, we can predict the size of the growth.
Th e expected value of a martingale is zero, but its volatility is not constant. One
17 A detailed analysis may be found, for example, in a 2013 paper by Iván Bélyácz (2013): Th e changing role of risk in calculating value: Hungarian Academy of Sciences.
mathematical model of volatility is the quadratic variation.18 Figure 3 shows the quadratic variation of the asymmetric process depicted in Fig. 2.
Figure 3
Quadratic variation
As is apparent from the graph, the quadratic variation, or the volatility, on the one hand is diff erent for each of the possible trajectories in the process (meaning that it is in itself a random process), but on the other hand is very visibly diff erentiable.
Diff erentiability means that the derivatives on the right and the left are identical.
In the case of a diff erentiable function, we can calculate the derivative on the left based on the past, while the derivate on the right relates to the future; given that the two are identical, we can calculate the future from the past; in other words, we can make a forecast. With the quadratic variation, our aim is to measure how stormy a sea we need to navigate.19 In the case of the Wiener process, the quadratic variation is deterministic and identical for each trajectory of the elapsed time. For
18 Th e quadratic variation is essentially a deviation along the time axis. Th e concept of volatility is not unique to fi nance. For example, a watch which is “reliably” slow by a fi xed degree is usually regarded as preferable to a watch which, though generally accurate, has a degree of inaccuracy that varies in time, and which is highly dependent – for example – on the surrounding temperature or the method of its wearing. Th e degree of unreliability is usually measured by calculating the change in the error at various points in time, then squaring this and calculating an average. Th is is very reminiscent of the calculation method for the quadratic variation. For the sake of comparison, a fi xed, oft en randomly selected testing order is employed, meaning that the watch’s environment is modifi ed in an order prescribed for each test, but determined at random prior to the test.
19 In other words, for example, to measure how unreliable the watch is.
other martingales, however, the volatility for certain trajectories may grow very large indeed, while remaining very small for other trajectories.20
Th e reason for this is relatively simple to understand. As already mentioned, mar- tingales occurring in fi nancial theory are mostly stochastic integrals. A fi nancial interpretation of stochastic integrals is self-evident: the integrator is the price of a fi nancial product, a change in which must be multiplied by the amount currently held in the portfolio, with the losses and profi ts thus obtained then to be added together. In other words, at a given point in time the value of the stochastic inte- gral is the net profi t or loss resulting from continuous trading over the relevant time span. If the original price process formed a martingale, then, based on the intuitive content of the martingale, it is clear that the stochastic integral is also a martingale, because if not then on average the original martingale could be ma- nipulated through the composition of the portfolio. In other words, the average profi ts and losses balance each other out. But this is not true of the volatilities. As the graph reveals, in certain cases it is necessary to play increasingly high stakes in order for the process as a whole to reach an average result of zero. When play- ing with high stakes, the current losses and profi ts obviously multiply, so that volatility also increases. To put it another way, if things somehow slip out of place and the stakes have to be continually raised, then the volatility of the portfolio increases to a degree potentially many times the volatility of the original fi nancial process prior to the transformation. In the case illustrated by the graph, the vola- tility of the basic process, the Wiener process, is 1 at the outermost point, but the volatility of the portfolio at the highest point is 500. In other words, while we did not modify the martingale nature in forming the portfolio, we raised the volatil- ity to the roof. Volatility is not a concept for calculating probability, inasmuch as average volatility is not really of interest. Only the volatility that happens to be experienced on a given trajectory is important. Volatility is a concept that lies between risk and uncertainty. It has relevance in judging individual cases, but theoretically can still be modelled mathematically; its value in a good model can be predicted, thus making it usable in formal models.
Th e third concept is uncertainty. Uncertainty stems from individual situations developing at random. At such times the rules for calculating probability do not apply. Given that the situation cannot be repeatedly replayed, the average or prob- ability has no signifi cance. In a certain sense, it is a question of perception to decide when we may be dealing with uncertainty and when with risk. It goes without saying that it is essentially impossible to manage uncertainty by math- ematical or statistical means; at the same time, in most real situations it is gener- ally uncertainty that must be confronted, rather than risk. Th e gap between the
20 Once again it’s worth taking the example of a watch. For a watch like this, we would say it runs in fi ts and starts; even its unreliability is unreliable.
two concepts is theoretically fi lled by a fresh source of risk known as model risk.
Problems in the whole approach to risk management spring precisely from this.
To take a specifi c example of how we might question the relevance of statistical conclusions drawn from similar cases: How much solace is provided by the aver- age result of treatment of a given illness in the event of a specifi c patient’s death?21 Due to the diffi culties that arise when modelling uncertainty, it is very easy to confuse desires with reality – or to put it somewhat more strongly, to confuse reality with what we would like to see or be seen. Where reliable data exist, it is diffi cult to provide a model which the supervisory authorities will accept if the model does not refl ect reality. At such times, as the saying goes, the facts speak for themselves. If this is not the case, however, then the scope for manipulation is very broad indeed. What’s more, this is generally the case. An entire industry has been built on evaluating the data of fi nancial enterprises operating in an uncer- tain environment using models which have been created within the conceptual framework of probability calculation. While manipulation is clearly discernible aft er the event at such times, it is very diffi cult to uncover problems in advance, particularly when the resources and interests of the opposing parties are not the same.
Putting things another way, problems appearing in the fi nancial sector essen- tially derive from two sources. One is uncertainty, which is not the object of risk management. Let’s face it, this is not how the profession is described: we don’t say uncertainty managers, we say risk managers. Th e other source – given that the fi nancial sector wishes to ensure an income larger than the value generated in the primal sector of the economy for groups that wield great infl uence in society – is the deliberate increasing of risk and the consequent spreading of losses that result from this higher risk to society as a whole. Th e way to do this is through transformation of the basic processes. We cannot change the martingale nature of a process through the latter, but we can divert incomes over a comparatively long period. Given that the martingale nature of a process does not change during transformation, it is very much to be feared that – in order to conceal the losses that inevitably arise – the fi nancial sector will embark on a martingale strategy, assuming greater and greater risk and continuing to do so until the moment of truth arrives and resources run out. Th is is when the exponentially increased risk suddenly breaks exponentially to the surface. Th e scissors snap shut, the balance of the positive and negative sides is zero, and the paper falls in two.
Naturally, the prevention of martingale strategies is the task of those supervis- ing the process. Th ere are many signs indicating that, just as a lion cannot be
21 Or, when we miss a specifi c train on a specifi c day, what use is it to us if on average our watch is otherwise accurate, meaning that the occasions on which the watch is slow or fast balance each other out?
driven to eat grass, the fi nancial sector cannot be persuaded to reduce risk as it is fundamentally interested in increasing it: without risk, there is no business. On the primal side, the resources are concentrated in increasingly few hands, and of course it becomes increasingly diffi cult to generate new value. At the same time, the ever-broadening stratum of society squeezed out of production and the dual sector still wants to attain a high income level. Everyone wants to invest their own available capital – whether it takes the form of cash, skills, mathematical or scientifi c knowledge, or social contacts – with the promise of a high yield. Th is process appears to be unstoppable.
Th e whole story is reminiscent of the game of musical chairs, when one chair is al- ways taken away and when the music stops someone is left without money – sorry, without a chair. With billions disappeared, an unsuspecting populace is dragged into a variety of schemes of price or property speculation. Th ese are various forms of the same story. Th e diffi culties emerging on the primal side are shift ed over to a portion of society on the dual side; to the weak and defenceless, we might say. But as we know, the chairs are always dwindling and an ever-increasing number are left without a chair. So where does it all end?
Th is is the subject of the next fairytale.
THE THIRD FAIRYTALE: THE TALE OF THE NEWSVENDOR
A key concept in the literature on risk management is value at risk.22 Th e concept holds that fi nancial institutions must set aside reserves great enough to provide cover for the majority of losses. Th e notion of “majority of losses” and the scale of such losses diff ers for each model and risk factor, but generally it means a very substantial safety level of as much as 99.9%, which – we should add – is unrealisti- cally high. I don’t believe that success in any economic activity can be guaranteed with 99.9% certainty. If a borrower were to be that certain of success, then lenders would literally pay to grant them a loan.
Th e concept has been criticized from numerous angles. Among these is the obser- vation relating to fat-tailed distributions. Th is holds that the distribution function of losses incurred in fi nancial processes converges very slowly, and that conse- quently it may happen even at extremely high probability levels that a loss con- siderably higher than the calculated value is realized. Th ere is a very broad body of writing that deals with how the risk indicator can be altered, and how to fi nd an indicator that can better and more accurately determine the actual loss in ad- vance. Th ese models, and the estimation of the distribution function of losses, fi ll volumes and provide work for hundreds of fi nance graduates.
22 Cf. Jorion, P. (1999): Value at Risk. Published in Hungarian by Panem Kft , Budapest.
Our last fairytale is more than 100 years old23: it is the tale of the newsvendor.
Th e tale is customarily told as a story of optimal cash reserves or optimal inven- tory levels.
Once upon a time a newsvendor was trying to work out how he could minimise his costs and thus increase his profi t. He quickly realised that his biggest prob- lem was that demand for newspapers follows a stochastic pattern. Having studied statistics and mathematics, but unluckily having not found a job commensurate with his qualifi cations, the newsvendor browsed through books on modern risk management and, among the recommended distribution functions, picked the one which best conformed to observed data. Knowing that an estimate alone is not suffi cient, he verifi ed the distribution using a Kolmogorov-Smirnov test. Sci- ence may as well not be science if we simply guess.
Aft er determining the magical distribution function F(x) of random demand, the newsvendor set about rationalising costs. As every risk manager knows, there are two costs to reckon with. Th e fi rst cost is the loss deriving from unsold newspa- pers. If our vendor orders too many newspapers, then unsold copies must be paid for at cost price. If he orders too few, however, he will not be able to serve all his customers. On the one hand he will suff er a direct loss as a result of lost profi t, but more importantly, dissatisfi ed customers will go to other newsvendors so that our vendor not only posts a lower return from sales in the present, but will also see his revenues decline in the future. Just how much this hurts the newsvendor depends on his risk preference. Designate h to represent the loss due to being left with an unsold newspaper, and designate p for the loss deriving from failure to satisfy demand for a newspaper. Designate D to represent the random demand with dis- tribution function F(x), and designate S for the number of newspapers ordered by the newsvendor. Designate E as the expected value. Th e goal of the newsvendor is therefore to minimise the following cost function:
J(S) = h*E(max(0, S – D) + p*E(max(D – S)).
If S > D, meaning the number of newspapers ordered is greater than demand, then we lose a unit of h on every single newspaper left unsold. If D > S, however, meaning that demand is greater than supply, then we lose a unit of p on every sin- gle newspaper that might potentially have been sold. Th e goal is to minimise aver- age losses. With a very simple calculation derived from S, we obtain the following:
In order to minimise expected costs, the optimal S value must be determined so that the equation F(S) = p/(h + p) is satisfi ed.
23 Th e model can be traced back to Edgeworth, F.’s 1888 paper entitled “Th e Mathematical Th eory of Banking”; Journal of the Royal Statistical Society, Vol. 51, pp. 113–127. Th e model has subsequently appeared repeatedly in numerous forms in the specialist literature.
Th e interpretation of the equation is very clear: p/(h + p) is a ratio, and the optimal S is the value at risk corresponding to this ratio. Th e defi nition of the distribu- tion function is written as P(D < S) = p/(h + p). In other words, in the case of the optimal S level of newspapers ordered, p/(h + p) is the probability that a customer will not be satisfi ed. If we now write losses in the place of newspapers, then we can say that p/(h + p) is the probability that the loss will be less than S, and that h/
(h + p) means our loss will be greater than S. In other words, S is the value at risk corresponding to the h/(h + p) confi dence level.
Before proceeding further, it is worth making one last general observation. Th e fundamental diff erence between economics and, for example, the engineering sciences lies in the relationship between theory and reality. Disregarding the pedantic argument that reality does not even exist, we can state without fear of contradiction that a signifi cant portion of economic propositions relate to only an abstract virtual reality. So does the F distribution function now exist? It does in the fairytale, just as the wolf exists in the fairytale. But is the wolf also there in reality? Yes and no, or as the observer or model maker wants it to be. Th is is the true nature of the uncertainty principle.
On some level, risk management relates to reality as chess relates to war. Knight takes F2, but what does this mean? Evisceration, a bullet in the brain, or decapita- tion? It is not only the knight taking F2. It is an abstract move, guided by logical and aesthetic elements. When we speak of portfolios that are not performing, we don’t see the suff ering in the background. We only see knight taking F2.
Regulatory authorities generally prescribe the level of value at risk and attempt to verify whether the estimation of losses has been carried out using the appropri- ate methodology. Th e approach can be disputed from numerous angles, but here only one element is worth highlighting. From a fi nancial institution’s point of view, only the costs p and h matter, or more precisely the h/p ratio. Th e regulatory authorities specify the h/p ratio by prescribing the level of value at risk. Economic thinking comprises very few theorems verifi ed repeatedly through experience.
One of these few theorems is that prices cannot be prescribed, that these are re- fl ections of the production structure. If the authorities prescribe the h/p ratio, which is not the same as the “real” h/p ratio, then unsurprisingly a game begins:
playing tricks with the distribution function, derivatives products, mathematical modelling and everything imaginable.24 In the virtual world of fi nance, a virtual reality is built to conceal the fact that the prescribed and “real” h/p ratios are not the same. It is oft en heard that the problems of the fi nancial sector are due to excessive bonuses, meaning that h is too great. Th is may be true, or it may also be true that p is too small; in reality, though, the h/p ratio is what is important.
24 Including the falsifi cation of data.
Given that h is in the hands of the fi nancial institution, the regulatory author- ity can only really do one thing, which is to increase the value of p. Th e letter p is the fi rst letter of the English words penalty or punishment. For as long as p is an abstract category, a move on a chessboard, a number in a virtual world, risk management is nothing but a premium business for consulting fi rms and a major source of income for bank “experts.”
THE MORAL OF THE STORY
In a fairytale, it’s not the done thing to draw an explicit moral. Th e moral takes shape in the mind of the listener, and this is precisely what makes a fairytale an eff ective educational tool. We don’t pronounce the Truth, since the young mind will generally not tolerate this; instead, the storyteller merely manipulates and directs the listener. Th is is true not just for one, but for three fairytales. Despite this, I would like to make a few more observations.
How can we get out of this mess?
1. As I have said, basically by altering the h/p ratio. Society has several means of shaping this. Society and the government can achieve this, for example by increasing the tax on income from fi nancial speculation.25 Generally, decreas- ing items of taxation – and through this, reducing the role of the state – is to be welcomed, but income from fi nancial speculation is an exception. Naturally, the activity of the fi nancial sector is fundamentally useful,26 while speculation and increasing risk are extremely harmful. If a green tax can be imposed on environmental pollution, then we can also tax speculative activity. Of course, this is when a chorus of voices stands up and breaks into an assembled cry of:
“Where’s the limit? How do we separate the good from the bad? All the capital will fl ee abroad!”27 Naturally, this is all true. But even so, we still can and must try. Even if there’s no perfect solution, it’s still worth doing something. Th ere is never a perfect solution to social questions, but there are a great many bad and harmful solutions. Th e goal of speculation is to transform the balance of incomes, while the goal of the tax system is correction.
25 In this regard, I think the aforementioned work by Piketty contains many important and note- worthy ideas.
26 Extreme examples are always useful. Th ink about how we would buy food without money. Or just imagine what life was like without bank cards, or how simple it is to bank through the internet.
It’s always easy to get used to good things and to think of them as natural.
27 Again I can only refer to the book by Piketty. In this matter international cooperation seems unavoidable. Piketty generally talks about capital, but what he writes applies emphatically to spec- ulative money capital.
2. In regrettable fashion, the fi nancial sector has donned the mask of science28 in education; it has now managed to reach the point where even the toughest mathematical theorems can be sold provided we describe them not as stochas- tic analysis, but as fi nancial mathematics. Th e most talented students swarm to the word fi nance like dizzy bees to honey to admire the ingenuity of the hu- man mind. Financial education has simply adopted the image the fi nancial sec- tor has created and propagated about itself. But amid all the mathematics and tricky diagrams, it’s rare to hear anyone say: Look out, all this is just a fairytale!
Th e Wizard of Oz is at work.
3. Increasing p can take several forms. It is not only a question of needing to make personal responsibility more explicitly clear. Of course, who would have it oth- erwise? It stands to reason. Without this, there is nothing. But there are other, perhaps more eff ective methods of increasing p. For example, there is the issue of moral responsibility. To take an example, it seems to me that the greatest blunder made by Hungary’s fi nancial community – foreign currency lending – was caused by the weather. I guess it was too hot at the time. To hell with that damned global warming, that’s why my neighbour Frici went broke. While I believe in the fundamental importance of increasing p, I don’t think it should be done directly. In society not only handcuff s have deterrent power. A far more eff ective tool is the pen. Or rather the word processor today. Th e behav- iour of society is fundamentally infl uenced by literature, the arts and education as a whole. Th e fi lm Th e Wolf of Wall Street did more for increasing p than if punishments had been doubled. Th e arts and philosophy can do much to dis- courage young minds from being overly dazzled by the fi nancial world and by money in general. But for as long as the fi rst question asked when choosing a job or career is how much it pays, there is really nothing that can be done.29 4. Th e current regulation and entire perception of risk management are proceed-
ing on a fundamentally wrong path. Th e various documents and directives have reached a level of complexity which, taken together, rivals the documen- tation of an atomic power station. Th is is essentially in the interests of the fi - nancial sector, which tries to act as if risk were some kind of stroke of fate
28 Trading in milliseconds, data mining in gigantic databases, the employment of physicists versed in quantum mechanics – all taking place in offi ces of marble and glass. No wonder everyone is dizzy.
29 Somewhat more generally, my feeling is that the intelligentsia on the whole – and I only know its Hungarian representatives – has surrendered the weapon of criticism. When I was at secondary school, I was taught that Haydn was a simple servant, that Mozart was a servant but it bothered him, and that Beethoven slammed down the piano lid and announced that he would not play for such an ignorant audience. Because of their helpless fi nancial situation, today’s intellectuals do not dare stand up against the powers-that-be with their material clout. Th e limit of their ambition is to be a servant of a major foreign bank, with the security thus gained making it possible for them to fi nd their own Papagena or Papageno. Th e lack of criticism is clearly a consequence of their defenceless pecuniary position, the social cost of which is immeasurable.
against which it holds a shield to protect the savings of the common people – with a 99.9% level of confi dence. Th e commandments of risk management should be simple and transparent. Th e fi rst commandment is already etched in stone.30 Th e fi nancial sector must get used to the idea that it carries out a simple bureaucratic function, and must rid itself of the self-congratulatory trappings that surround it, including the Basel regulatory framework. What is needed is simple common sense, not complex regulations. It won’t be easy, as common sense doesn’t pay much.31
5. In conclusion, let us take a quote from W. M. Th ackeray’s work Th e History of Samuel Titmarsh and the Great Hoggarty Diamond. According to the foreword to the work, the fi nal edition was completed for print in January 1849. Th e story revolves around a fraud in connection with an insurance company, and ends with the following words: “…bidding all gents who peruse this, to be cautious of their money, if they have it; to be still more cautious of their friends’ money; to remember that great profi ts imply great risks; and that the great, shrewd capital- ists of this country would not be content with four per cent for their money if they could securely get more; above all, I entreat them never to embark in any specula- tion, of which the conduct is not perfectly clear to them, and of which the agents are not perfectly open and loyal.”
Th ere is nothing new under the sun.
30 Or rather the eighth, although the ninth and tenth also belong here: “You shall not steal. You shall not give false testimony against your neighbor. You shall not covet your neighbor’s house. You shall not covet your neighbor’s wife, or his male or female servant, his ox or donkey, or anything that belongs to your neighbor.” (Exodus 20:15–17)
31 Naturally this is not a problem in Hungary. We are too small for this. All we can do is follow the global trends. If, for one reason or another, the world speaks in the language of complex math- ematical models and increases risk, then we must do the same. Moreover, if a good standard of math- ematical training means we are able to export our good fi nancial mathematicians, then produce and export them we must. Business is business, and we don’t make the rules. In other words, ignorance in itself is not an asset and does not equate with common sense.