Do we need to cure the Baumol’s disease on regional level?
Written by: Ágnes Hegyi-Kéri
PhD student
University of Miskolc, World- and Regional Department, 3515 Miskolc-Egyetemváros, 06-46-565-111,
hkagi@uni-miskolc.hu
Table of Contents
Introduction
Theoretical and methodological framework
Examination of the productivity growth on regional level
Summary
Introduction
Classical question of the economic researches, if still the manufacturing productivity is the driving force of the growth ?
According Thirlwall (2002) there is a strong correlation between the
manufacturing output and the economic growth.
According to our calculation
examined 27 European countries.
(R
2= 0,835)
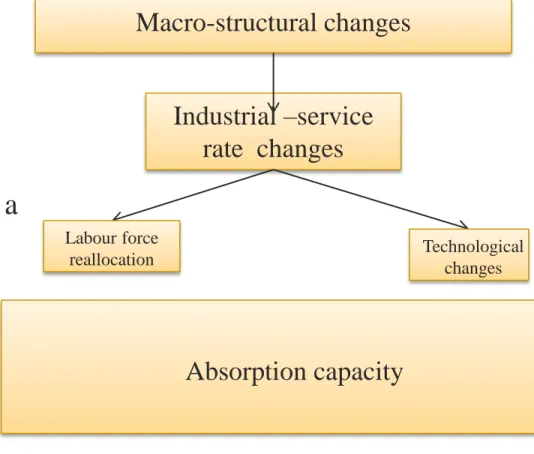
Industrial –service rate changes
Technological changes Labour force
reallocation
Macro-structural changes
Absorption capacity
Figure 1.:Modell of Hegyi
Source: own compilation
0 10000 20000 30000 40000 50000 60000 70000 80000 90000
2000 2001 2002 2003 2004 2005 2006 2007 2008
Value added factor cost by 1 persons empolyed €)
Czeh Republic Hungary
Poland Slovakia Finnland Austria United Kingdom Sweden Germany France
Changing of the manufacturing productivity
Figure2.:Value added value costs
Source: own compilation
Theoritical background
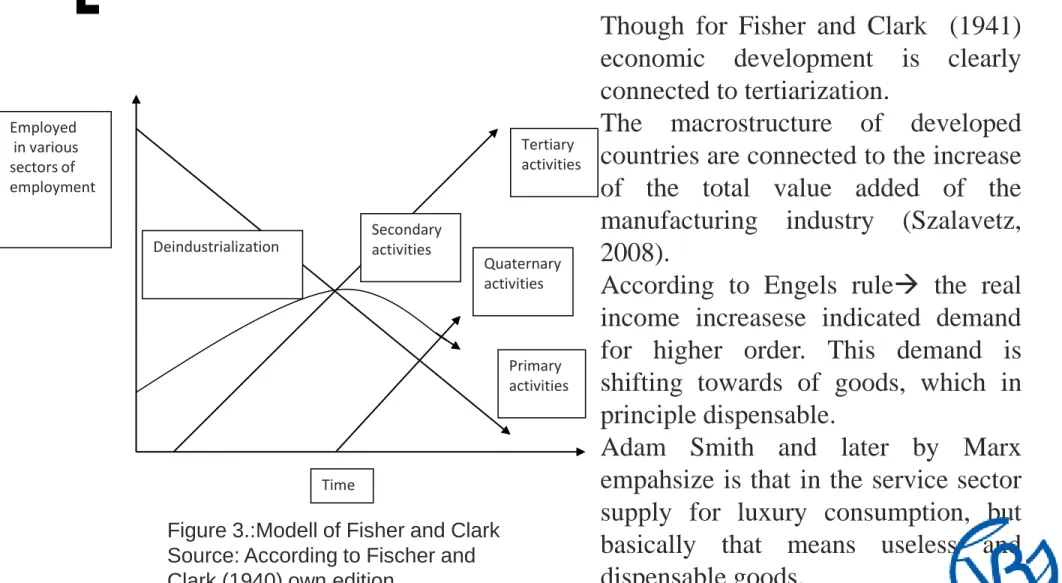
Tertiary activities
Primary activities Quaternary activities
Time Employed
in various sectors of employment
Secondary activities Deindustrialization
Though for Fisher and Clark (1941) economic development is clearly connected to tertiarization.
The macrostructure of developed countries are connected to the increase of the total value added of the manufacturing industry (Szalavetz, 2008).
According to Engels rule the real income increasese indicated demand for higher order. This demand is shifting towards of goods, which in principle dispensable.
Adam Smith and later by Marx empahsize is that in the service sector supply for luxury consumption, but basically that means useless and dispensable goods.
Figure 3.:Modell of Fisher and Clark
Source: According to Fischer and
Clark (1940) own edition
The Baumol’s cost disease
The Baumol’s cost disease, in the service sector, because of its
peculiarities, it is less possible to reach significant productivity growth, than in the production sectors. (Baumol 1967).
Baumol-effect: The two sectors have experienced very different rates of productivity growth and these are unbalanced. The consequences are
great: many people who work in the progressive sector lose their jobs due to the productivity growth. Those remaining can be paid more because the automation has saved their organization enough money to raise salaries. But the service sector is not able to employ these labor force.
Oulton (2001) examined the validity of Baumol’s claim and set up an
other modell: as the manufacturing sectors increasing, the workforce flow
to the service sector will not adversely affect growth.
Hypothesis:
1.:The productivity growth rate in the manufacturing sector was higher than in the service sectors during the Golden Ages, and it was due to the technical development and the human re-allocation.
2.: Did the employment rate increase in that regions.
Productivity growth
Time
(2000-2007) Agriculture Manufacturing Construction Wholesale and retail
trade Financial intermediation
Public administration and defense, compulsory social
security
PL34: Podlaskie 2.7992 2.3135 1.8206 1.9912 1.2127 2.2367
HU32: Eszak-Alfold 3.2361 2.2645 2.0862 1.8152 1.3908 2.3690
PL41: Wielkopolskie 3.4098 2.2430 2.0366 1.7368 1.4413 1.7491
PL52: Opolskie 3.3359 2.0163 1.6240 1.6557 1.6332 1.6111
PL43: Lubuskie 3.5206 2.0144 2.4555 2.6402 2.3795 2.5976
PL63: Pomorskie 1.3649 1.9561 1.1731 1.8023 1.2732 1.6380
HU31: Eszak-Magyarorszag 1.1554 1.8796 1.5607 1.6005 1.1273 1.4635
HU22: Nyugat-Dunantul 1.6725 1.8002 1.5034 1.2559 1.2253 1.7355
HU23: Del-Dunantult 1.3062 1.7505 1.1489 1.4813 1.3536 1.2788
SK02: Zapadne Slovensko 1.4420 1.7307 1.1562 1.2345 1.0615 1.5605
SK03: Stredne Slovensko 1.7923 1.7108 1.7102 1.3193 1.2807 1.6801
CZ03: Jihozapad 1.9646 1.7085 1.5705 1.5791 1.0619 1.7102
CZ05: Severovychod 1.4861 1.6223 1.2611 1.3408 1.3004 1.5383
PL61: Kujawsko-Pomorskie 1.4759 1.6116 1.3560 1.4305 1.4840 1.4377
PL31: Lubelskie 1.1781 1.6098 1.1218 1.4652 1.2361 1.4307
PL51: Dolnoslaskie 1.4410 1.6060 1.5434 1.5888 1.3139 1.8659
PL32: Podkarpackie 1.7866 1.5759 1.2016 1.3430 1.2092 1.4149
PL21: Malopolskie 1.5125 1.5658 1.6416 1.4474 1.3018 1.5405
HU33: Del-Alfold 1.0197 1.5571 1.2211 1.0389 1.3862 1.1741
CZ01: Praha 1.1433 1.5321 1.1415 0.9186 0.6902 1.1427
CZ04: Severozapad 1.3967 1.5113 1.5714 1.3135 1.1293 1.5514
PL33: Swietokrzyskie 2.1499 1.5024 1.6303 1.2585 1.5651 1.4951
HU21: Kosep-Dunantul 1.3249 1.4886 1.6984 1.6710 1.3198 1.6753
PL12: Mazowieckie 1.2851 1.4830 1.5215 1.6828 1.3980 1.4181
SK04: Vychodne Slovensko 1.6070 1.4752 1.4658 1.1096 1.0186 1.5012
PL62: Warminsko-Mazurskie 1.1599 1.4551 1.1547 1.2301 1.1581 1.6408
SK01: Bratislav Kraj 1.5429 1.4136 1.7572 1.4829 1.4293 1.4352
CZ07: Stredni Morava 1.1234 1.4015 1.3817 1.2708 0.8665 1.5707
CZ06: Jihovyched 1.8210 1.3922 1.1763 1.4282 1.3103 1.2898
HU10: Kosep-Magyarorszag 1.6127 1.3854 1.5145 1.3875 1.3060 1.5273
PL11: Lodzkie 1.5029 1.3764 2.1095 1.3946 1.3518 1.5630
PL22: Slaskie 1.5911 1.3642 1.5381 1.4508 1.2089 1.7068
CZ02: Stredni Cechy 1.4955 1.3262 1.2416 1.5436 1.4286 1.4974
CZ08: Moravskoslezko 1.6712 1.3046 1.2299 1.1074 1.6953 1.4948
PL42: Zachodniopomorskie 2.6181 1.2732 1.3015 1.3864 1.2911 1.2964
Hypothesis Hungary
Time (2000-2007)
Centra
Agriculture Manufacturing Construction Wholesale and retail trade
Financial intermediation
Public administration
and defense, compulsory social security Northern
Great Plan 3.2361 2.2645 2.0862 1.8152 1.3908 2.3690
Northern
Hungary 1.1554 1.8796 1.5607 1.6005 1.1273 1.4635
Western -
Transdanubia 1.6725 1.8002 1.5034 1.2559 1.2253 1.7355
Southern
Transdanuiba 1.3062 1.7505 1.1489 1.4813 1.3536 1.2788
Southern Great
Plan 1.0197 1.5571 1.2211 1.0389 1.3862 1.1741
Central-
Transdanubia 1.3249 1.4886 1.6984 1.6710 1.3198 1.6753
Central
Hungary 1.6127 1.3854 1.5145 1.3875 1.3060 1.5273
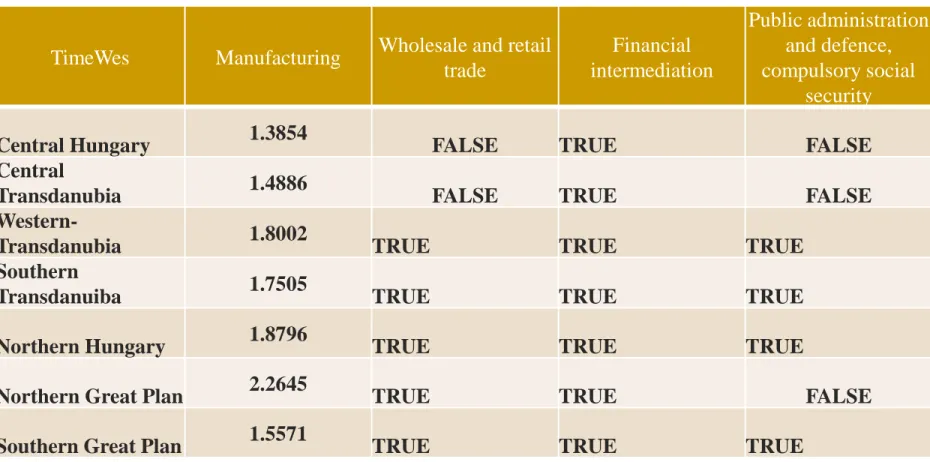
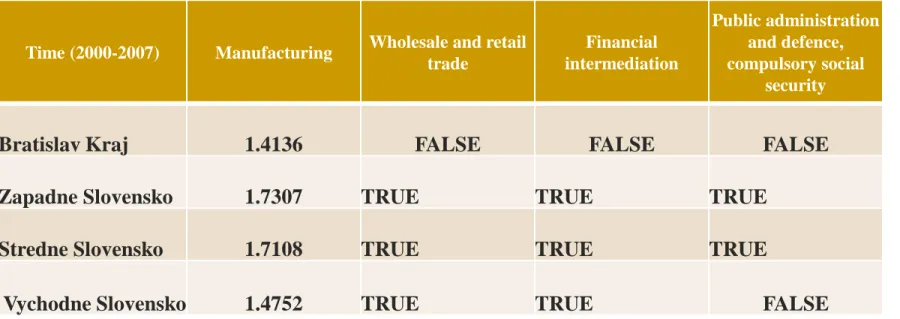
2. Hypothesis Hungary
TimeWes Manufacturing Wholesale and retail trade
Financial intermediation
Public administration and defence, compulsory social
security Central Hungary 1.3854
FALSE TRUE FALSE
Central
Transdanubia 1.4886
FALSE TRUE FALSE
Western-
Transdanubia 1.8002
TRUE TRUE TRUE
Southern
Transdanuiba 1.7505
TRUE TRUE TRUE
Northern Hungary 1.8796
TRUE TRUE TRUE
Northern Great Plan 2.2645
TRUE TRUE FALSE
Southern Great Plan 1.5571
TRUE TRUE TRUE
Table 3. : Verfication of Baumol hypothesis
Hypothesis Czeh Republic
Time Agriculture Manufacturing Construction Wholesale and retail trade
Financial intermediation
Public administration
and defense, compulsory social security
Stredni Cechy 1.4955 1.3262 1.2416 1.5436 1.4286 1.4974
Moravskoslezko 1.6712 1.3046 1.2299 1.1074 1.6953 1.4948
Stredni Morava 1.1234 1.4015 1.3817 1.2708 0.8665 1.5707
Jihovyched 1.8210 1.3922 1.1763 1.4282 1.3103 1.2898
Praha 1.1433 1.5321 1.1415 0.9186 0.6902 1.1427
Severozapad 1.3967 1.5113 1.5714 1.3135 1.1293 1.5514
Jihozapad 1.9646 1.7085 1.5705 1.5791 1.0619 1.7102
Severovychod 1.4861 1.6223 1.2611 1.3408 1.3004 1.5383
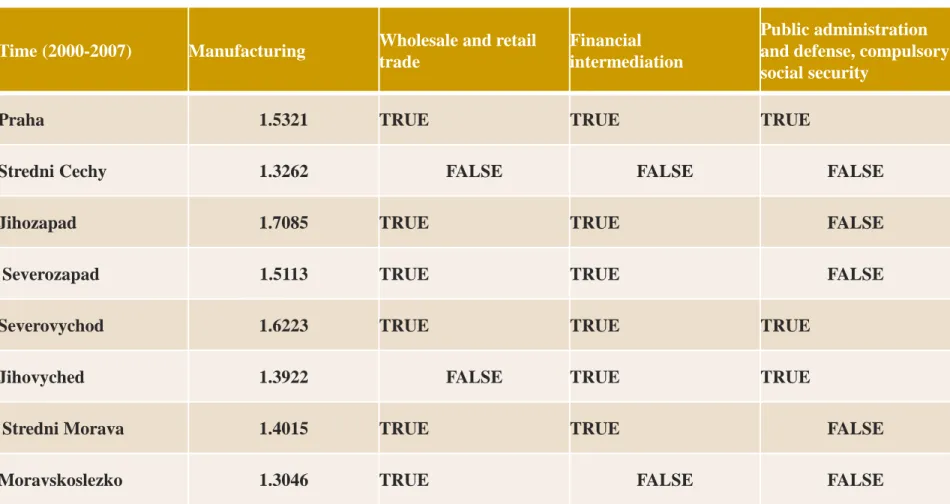
2. Hypothesis Czeh Republic
Time (2000-2007) Manufacturing Wholesale and retail trade
Financial intermediation
Public administration and defense, compulsory social security
Praha 1.5321 TRUE TRUE TRUE
Stredni Cechy 1.3262 FALSE FALSE FALSE
Jihozapad 1.7085 TRUE TRUE FALSE
Severozapad 1.5113 TRUE TRUE FALSE
Severovychod 1.6223 TRUE TRUE TRUE
Jihovyched 1.3922 FALSE TRUE TRUE
Stredni Morava 1.4015 TRUE TRUE FALSE
Moravskoslezko 1.3046 TRUE FALSE FALSE
Table 2. : Verfication of Baumol hypothesis
Hypothesis Poland
Time Agriculture Manufacturing Construction Wholesale and retail trade Financial intermediation
Public administration and defense, compulsory social
security
Podlaskie 2.7992 2.3135 1.8206 1.9912 1.2127 2.2367
Wielkopolskie 3.4098 2.2430 2.0366 1.7368 1.4413 1.7491
Opolskie 3.3359 2.0163 1.6240 1.6557 1.6332 1.6111
Lubuskie 3.5206 2.0144 2.4555 2.6402 2.3795 2.5976
Pomorskie 1.3649 1.9561 1.1731 1.8023 1.2732 1.6380
Kujawsko-
Pomorskie 1.4759 1.6116 1.3560 1.4305 1.4840 1.4377
Lubelskie 1.1781 1.6098 1.1218 1.4652 1.2361 1.4307
Dolnoslaskie 1.4410 1.6060 1.5434 1.5888 1.3139 1.8659
Podkarpackie 1.7866 1.5759 1.2016 1.3430 1.2092 1.4149
Malopolskie 1.5125 1.5658 1.6416 1.4474 1.3018 1.5405
Swietokrzyskie 2.1499 1.5024 1.6303 1.2585 1.5651 1.4951
Mazowieckie 1.2851 1.4830 1.5215 1.6828 1.3980 1.4181
Warminsko-
Mazurskie 1.1599 1.4551 1.1547 1.2301 1.1581 1.6408
Lodzkie 1.5029 1.3764 2.1095 1.3946 1.3518 1.5630
Slaskie 1.5911 1.3642 1.5381 1.4508 1.2089 1.7068
Zachodniopomor
skie 2.6181 1.2732 1.3015 1.3864 1.2911 1.2964
2. Hypothesis Poland
Time Manufacturing Wholesale and retail trade
Financial intermediation
Public administration and defence, compulsory social
security
Lodzkie 1.3764 FALSE TRUE FALSE
Mazowieckie 1.4830 FALSE TRUE TRUE
Malopolskie 1.5658 TRUE TRUE TRUE
Slaskie 1.3642 FALSE TRUE FALSE
Lubelskie 1.6098 TRUE TRUE TRUE
Podkarpackie 1.5759 TRUE TRUE TRUE
Swietokrzyskie 1.5024 TRUE FALSE TRUE
Wielkopolskie 2.2430 TRUE TRUE TRUE
Zachodniopomorskie 1.2732 FALSE FALSE FALSE
Lubuskie 2.0144 FALSE FALSE FALSE
Dolnoslaskie 1.6060 TRUE TRUE FALSE
Opolskie 2.0163 TRUE TRUE TRUE
Kujawsko-Pomorskie 1.6116 TRUE TRUE TRUE
Warminsko-Mazurskie 1.4551 TRUE TRUE FALSE
Podlaskie 2.3135 TRUE TRUE TRUE
Pomorskie 1.9561 TRUE TRUE TRUE
Table 4. : Verfication of Baumol hypothesis
Hypothesis Slovakia
Time
(2000-2007) Agriculture Manufacturing Construction Wholesale and retail
trade Financial intermediation
Public administration and defense, compulsory social
security
Zapadne
Slovensko 1.4420 1.7307 1.1562 1.2345 1.0615 1.5605 Stredne
Slovensko 1.7923 1.7108 1.7102 1.3193 1.2807 1.6801 Vychodne
Slovensko 1.6070 1.4752 1.4658 1.1096 1.0186 1.5012 Bratislav
Kraj 1.5429 1.4136 1.7572 1.4829 1.4293 1.4352
2. Hypothesis Slovakia
Time (2000-2007) Manufacturing Wholesale and retail trade
Financial intermediation
Public administration and defence, compulsory social
security
Bratislav Kraj 1.4136 FALSE FALSE FALSE
Zapadne Slovensko 1.7307 TRUE TRUE TRUE
Stredne Slovensko 1.7108 TRUE TRUE TRUE
Vychodne Slovensko 1.4752 TRUE TRUE FALSE
Table 5. : Verfication of Baumol hypothesis
Regional proceses, methodology
SA
SR
+ -
+
(+)Poland-
(+)Czeh Republic (+)Slovakia (-)Hungary
Is the local economy growing or declining?
What are the main factors of this process?
For each Visegrad country was calculated that employment changes, which could be faster or slower than the average (Si).
Si was broken into two factors local (Sr) and structural (Sa).
All three factors can adopt positive or negative values, these can be grouped according to the countries studied (highlighting that local or structural factors dominated the expansion in employment).
Source: According to the EUROSTAT, own construction
Table 10. : Result of the shift share analysis
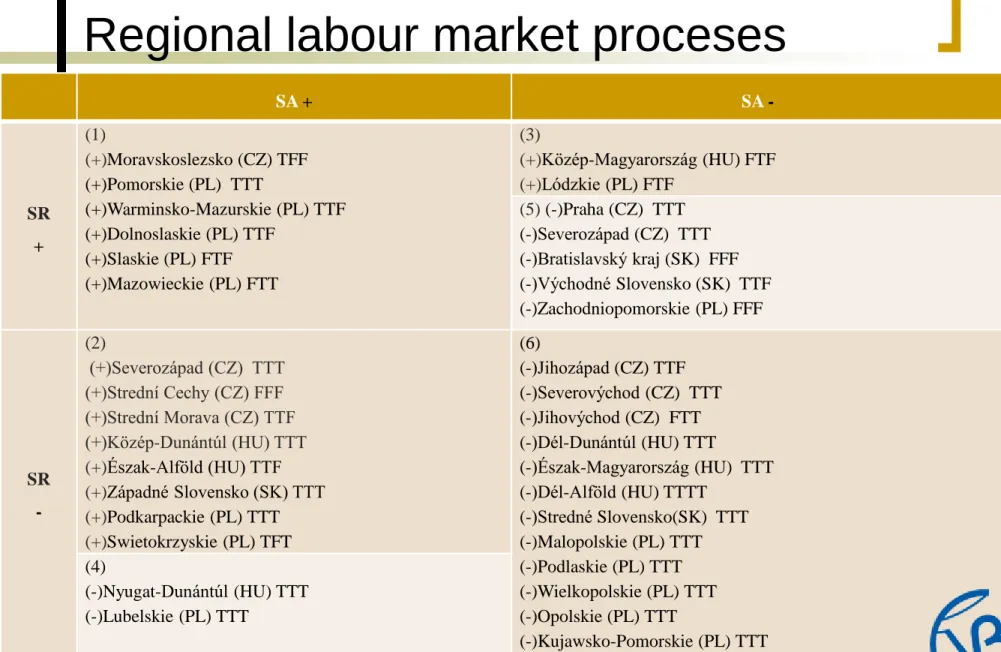
Regional labour market proceses
SA + SA -
SR +
(1)
(+)Moravskoslezsko (CZ) TFF (+)Pomorskie (PL) TTT
(+)Warminsko-Mazurskie (PL) TTF (+)Dolnoslaskie (PL) TTF
(+)Slaskie (PL) FTF (+)Mazowieckie (PL) FTT
(3)
(+)Közép-Magyarország (HU) FTF (+)Lódzkie (PL) FTF
(5) (-)Praha (CZ) TTT (-)Severozápad (CZ) TTT (-)Bratislavský kraj (SK) FFF (-)Východné Slovensko (SK) TTF (-)Zachodniopomorskie (PL) FFF
SR -
(2)
(+)Severozápad (CZ) TTT (+)Strední Cechy (CZ) FFF (+)Strední Morava (CZ) TTF (+)Közép-Dunántúl (HU) TTT (+)Észak-Alföld (HU) TTF (+)Západné Slovensko (SK) TTT (+)Podkarpackie (PL) TTT (+)Swietokrzyskie (PL) TFT
(6)
(-)Jihozápad (CZ) TTF (-)Severovýchod (CZ) TTT (-)Jihovýchod (CZ) FTT (-)Dél-Dunántúl (HU) TTT
(-)Észak-Magyarország (HU) TTT (-)Dél-Alföld (HU) TTTT
(-)Stredné Slovensko(SK) TTT (-)Malopolskie (PL) TTT (-)Podlaskie (PL) TTT (-)Wielkopolskie (PL) TTT (-)Opolskie (PL) TTT
(-)Kujawsko-Pomorskie (PL) TTT (4)
(-)Nyugat-Dunántúl (HU) TTT (-)Lubelskie (PL) TTT
Table 11. :Regional labour market proceses