water
Article
Comparison of Desalination Technologies Using Renewable Energy Sources with Life Cycle, PESTLE, and Multi-Criteria Decision Analyses
Huyen Trang Do Thi1, Tibor Pasztor1, Daniel Fozer1, Flavio Manenti2 and Andras Jozsef Toth1,*
Citation: Do Thi, H.T.; Pasztor, T.;
Fozer, D.; Manenti, F.; Toth, A.J.
Comparison of Desalination Technologies Using Renewable Energy Sources with Life Cycle, PESTLE, and Multi-Criteria Decision Analyses.Water2021,13, 3023.
https://doi.org/10.3390/w13213023
Academic Editors: Robert Field and Muhammad Wakil Shahzad
Received: 17 September 2021 Accepted: 19 October 2021 Published: 28 October 2021
Publisher’s Note:MDPI stays neutral with regard to jurisdictional claims in published maps and institutional affil- iations.
Copyright: © 2021 by the authors.
Licensee MDPI, Basel, Switzerland.
This article is an open access article distributed under the terms and conditions of the Creative Commons Attribution (CC BY) license (https://
creativecommons.org/licenses/by/
4.0/).
1 Environmental and Process Engineering Research Group, Department of Chemical and Environmental Process Engineering, Budapest University of Technology and Economics, M ˝uegyetem rkp. 3,
H-1111 Budapest, Hungary; dothihuyentrang.bme@gmail.com (H.T.D.T.); pasztortibike@gmail.com (T.P.);
fozerd@gmail.com (D.F.)
2 SuPER (Sustainable Process Engineering Research) Team, Polytechnic University of Milan, Piazza Leonardo da Vinci 32, 20133 Milan, Italy; flavio.manenti@polimi.it
* Correspondence: andrasjozseftoth@edu.bme.hu; Tel.: +36-1-463-1490; Fax: +36-1-463-3197
Abstract:Nowadays, desalination continues to expand globally, which is one of the most effective solutions to solve the problem of the global drinking water shortage. However, desalination is not a fail-safe process and has many environmental and human health consequences. This paper investigated the desalination procedure of seawater with different technologies, namely, multi-stage flash distillation (MSF), multi-effect distillation (MED), and reverse osmosis (RO), and with various energy sources (fossil energy, solar energy, wind energy, nuclear energy). The aim was to examine the different desalination technologies’ effectiveness with energy sources using three assessment methods, which were examined separately. The life cycle assessment (LCA), PESTLE, and multi- criteria decision analysis (MCDA) methods were used to evaluate each procedure. LCA was based on the following impact analysis and evaluation methods: ReCiPe 2016, IMPACT 2002+, and IPCC 2013 GWP 100a; PESTLE risk analysis evaluated the long-lasting impact on processes and technologies with political, economic, social, technological, legal, and environmental factors. Additionally, MCDA was based on the Technique for Order Preference by Similarity to the Ideal Solution (TOPSIS) method to evaluate desalination technologies. This study considered the operational phase of a plant, which includes the necessary energy and chemical needs, which is called “gate-to-gate” analysis. Saudi Arabia data were used for the analysis, with the base unit of 1 m3of the water product. As the result of this study, RO combined with renewable energy provided outstanding benefits in terms of human health, ecosystem quality, and resources, as well as the climate change and emissions of GHGs categories.
Keywords:life cycle assessment; PESTLE analysis; multi-criteria decision analyses; desalination;
reverse osmosis; multi-stage flash distillation; multi-effect distillation
1. Introduction
1.1. Overview of Desalination in the World
About 71% of the Earth’s surface is covered with water, but only a small part of it can be considered as drinkable water, i.e., 2.5% of the Earth’s water. Overall, just under 0.7%
of water resources are available to people [1]. From this amount, we have to satisfy the ever-increasing water consumption of 7.8 billion people currently living (150–400 L/person a day [2]). In addition to the increasing water consumption, the human population is also anticipated to increase. It is predicted that only 60% of the demanded water will be available for consumption in 2030 [3]. The Economic Cooperation and Development (OECD) has predicted that about 40% of the population will live in water-stressed regions by 2050 [4]. It is hard to imagine that more than half of the humans on Earth will not have
Water2021,13, 3023. https://doi.org/10.3390/w13213023 https://www.mdpi.com/journal/water
Water2021,13, 3023 2 of 27
access to clean, drinkable water. This number may continue to drop in the coming decades as we are increasingly exposed to our water sources. In areas where there are not enough available freshwater sources, another solution has to be found. Among other things, the process of desalination of seawater has been proved to be an effective alternative.
The desalination technology was first introduced on a larger scale in the Middle East during World War II, due to the general lack of water, and is becoming more widespread as the population increases and the drinking water stock is reduced [5,6]. Around the world, the number of desalination plants has increased with an average rate of about 6.8% a year since 2010, with the average annual capacity addition being about 4.6 million m3/day.
By February 2020, there were 20,971 desalination projects with 16,876 installed plants, with the capacity of 97.2 million m3/day of freshwater production [7]. Nowadays, over 150 countries have already used desalination technologies to provide clean water for about 300 million people [8].
The desalination capacity in Saudi Arabia, the United Arab Emirates (UAE), Kuwait, and Qatar accounts for 55% of the total global share. Desalination plants for urban water are located throughout the world but are especially predominant in the Middle East and North Africa. As shown in Figure 1, the Middle East and North Africa had the largest regional desalination market in 2019, with around 45.32% of the total capacity, followed by East Asia and the Pacific (17.52%), North America (11.34%), and Western Europe (8.75%). The lowest regional desalination capacities were found for Southern Asia (2.94%), Eastern Europe and Central Asia (2.26%), and sub-Saharan Africa (1.78%), where desalination is mainly limited to small facilities for private and industrial applications [9].
Al-Jubail in Saudi Arabia is the largest desalination plant in the world, with a capacity of 1.4 million m3/day of water [10]. Desalination plants globally focused along the coast also tend to be larger than desalination plants on the mainland. The highest desalination capacity is where oil availability is the highest (most desalination plants use fossil fuels), such as the US and North Africa.
Water 2021, 13, x FOR PEER REVIEW 2 of 28
by 2050 [4]. It is hard to imagine that more than half of the humans on Earth will not have access to clean, drinkable water. This number may continue to drop in the coming decades as we are increasingly exposed to our water sources. In areas where there are not enough available freshwater sources, another solution has to be found. Among other things, the process of desalination of seawater has been proved to be an effective alternative.
The desalination technology was first introduced on a larger scale in the Middle East during World War II, due to the general lack of water, and is becoming more widespread as the population increases and the drinking water stock is reduced [5,6]. Around the world, the number of desalination plants has increased with an average rate of about 6.8%
a year since 2010, with the average annual capacity addition being about 4.6 million m3/day. By February 2020, there were 20,971 desalination projects with 16,876 installed plants, with the capacity of 97.2 million m3/day of freshwater production [7]. Nowadays, over 150 countries have already used desalination technologies to provide clean water for about 300 million people [8].
The desalination capacity in Saudi Arabia, the United Arab Emirates (UAE), Kuwait, and Qatar accounts for 55% of the total global share. Desalination plants for urban water are located throughout the world but are especially predominant in the Middle East and North Africa. As shown in Figure 1, the Middle East and North Africa had the largest regional desalination market in 2019, with around 45.32% of the total capacity, followed by East Asia and the Pacific (17.52%), North America (11.34%), and Western Europe (8.75%). The lowest regional desalination capacities were found for Southern Asia (2.94%), Eastern Europe and Central Asia (2.26%), and sub-Saharan Africa (1.78%), where desali- nation is mainly limited to small facilities for private and industrial applications [9]. Al- Jubail in Saudi Arabia is the largest desalination plant in the world, with a capacity of 1.4 million m3/day of water [10]. Desalination plants globally focused along the coast also tend to be larger than desalination plants on the mainland. The highest desalination ca- pacity is where oil availability is the highest (most desalination plants use fossil fuels), such as the US and North Africa.
(a) (b)
Figure 1. Number and capacity of desalination plants by region in 2019: (a) number of desalination plants; (b) desalination capacity (million m3/day), with data from [9].
1.2. Desalination Technology
Desalination technology provides drinking water for people in places where drink- ing water would otherwise be an issue. The water produced can also be used for irrigation, such as in drought and dry areas, which can reduce the import dependency of a given area, contribute to the local economy, and provide food supply improvements [11,12]. The 45.32
17.52 11.34
8.75 5.46
2.94 2.26 1.78
4826
2341 3505 2337
1373
655 566 303
Figure 1.Number and capacity of desalination plants by region in 2019: (a) number of desalination plants; (b) desalination capacity (million m3/day), with data from [9].
1.2. Desalination Technology
Desalination technology provides drinking water for people in places where drinking water would otherwise be an issue. The water produced can also be used for irrigation, such as in drought and dry areas, which can reduce the import dependency of a given area, contribute to the local economy, and provide food supply improvements [11,12].
The desalination process has been using proven and working technologies for decades, providing a reliable process. However, it is not a consequence-free procedure; one of these drawbacks is discharged flow from desalination plants. Environmental impacts (EIs) of
Water2021,13, 3023 3 of 27
the desalination process are assessed based on the utilized feedwater sources, the desalina- tion technology, and the management of the waste brine and heat generated [13,14]. The various EIs are brine discharge, GHG emissions, toxic chemical emissions, water intake activities, and high energy consumption. Indeed, brine discharge and high energy con- sumption are the main and most significant impacts. The concentration of brine solutions is 1.6–2 times greater than the salinity of seawater (35 g/L), and their amount is also huge [15–17]. The temperature of brine produced by thermal-based technologies is also 1.37–1.82 times warmer than the average seawater temperature (22 ◦C) [18–20]. High temperature levels and salinity discharge affect marine organisms and cause biological problems [21–24]. Moreover, the used chemicals in the desalination process can also be returned to the sea. These are largely chlorine, antiscalants (polymeric substances such as polyphosphates, phosphonates, and polycarbonic acids), coagulants (ferric chloride (FeCl3), ferric sulfate [Fe2(SO4)3], aluminium chloride, and polyelectrolytes), flocculants (cationic polymer), strong acid/base sulfuric acid (H2SO4) and hydrochloric acid (HCl), oxidizing agents (sodium hypochlorite (NaOCl) and calcium hypochlorite [Ca(ClO)2]), reducing agents (bisulfite (HSO3−), foaming inhibitors, and heavy metals (Cu, Fe, Ni, Mo, Cr, Cd, Pb, Hg, U, As) that are released into the water [17,25–27]. The substances thus introduced can cause a change in the pH of the water and an increase in the nutrient content and algae, which can lead to an overheating of the oxygen balance [28]. Drainage pipelines for desalination can suck up small aquatic organisms, damaging the local ecosystem. This can be reduced by installing a grid. Huge flue gas emissions and greenhouse gases from desalination plants contribute to air pollution in the environment. Annual global emissions from desalination plants are predicted to be increased by 0.4 billion tons of CO2equivalent by 2050 [29]. Desalination needs a high energy demand, which has significant costs. De- salination technology requires an 8–20 times greater energy intensity than conventional surface water treatment technology (see Table1) [30].
Table 1.Required energy use of distinct water sources for 1 m3of drinking water [30,31].
Water Supply Alternative Energy (kWh/m3) Conventional treatment of surface water 0.20–0.40
Groundwater 0.48
Wastewater treatment 0.62–0.87
Wastewater reuse 1.00–2.50
Brackish water desalination 1.00–1.50
Seawater desalination 2.58–8.50
Desalination is essentially a process in which freshwater is separated from brackish water or saltwater. To run this process, there are two types of required energy (thermal, electricity). Desalination technology includes two major categories: thermal technology (traditional technology) and membrane technology (modern technology). The properties of thermal and membrane techniques are summarized in Table2.
Table 2.Overview of desalination technologies [32].
Classification Thermal Membrane
Desalination technologies MED, MSF, MVC, TVC MF, UF, NF, MB, MD, ED, RO
Separation mechanism Phase change Diffusion
Main type of energy
requirements Thermal Electricity
Driving force Heat Pressure/Electricity
Specific energy consumption High Low
Water2021,13, 3023 4 of 27
1.2.1. Thermal Desalination Technology
The thermal process is a phase-changed method in which the feedwater is heated under an operating temperature and pressure. Water vapor condenses as pure water, leaving behind salts and other non-volatile substances. Thermal processes are operated using heat and mechanical energy with a larger required amount compared to membrane processes. Therefore, most of the operational processes with many steps reuse heat through a sequential process of condensation and evaporation [33]. The thermal technologies include multi-effect distillation (MED), mechanical vapor compression (MVC), multi-stage flash distillation (MSF), and thermal vapor compression (TVC).
The theoretical operation of the MED and MSF techniques is shown in Figures2and3.
In MED, the vapors of each stage condense in the next successive stage; the hot pipes are then sprayed with seawater to evaporate the water; this process is repeated for the next stage. A saline solution is collected at the bottom of each stage and circulated to the next stage or delivered out of the system [34]. MED units can be arranged in several ways, depending on the type of heat exchangers (horizontal or vertical), the direction of flow of the brine or steam (forward, backward, parallel), etc. For energy efficiency, steam is usually extracted from a power plant’s steam turbine or utilized as waste energy from other industrial processes. As the primary steam does not come into direct contact with the brine, the condensate inside the evaporator is usually circulated, and the boiler chemicals are not spread into the pure distillate. MSF is based on heat transfer desalination technology consisting of the evaporation and condensation of water. It is an energy- intensive process that requires both heat and electricity. The evaporation and condensation steps are connected in several stages so that the latent heat of evaporation is recovered by preheating the incoming water. The principle of the process is that the saltwater is evaporated, and the water and salt can be separated. Evaporation occurs several times (15–20 times) in series-connected chambers and at low pressure so that the water boils at a lower temperature [35].
Figure4shows the current contribution of installed desalination technologies all over the world. The most commercially used thermal technology is MSF, with 18% of the market share of commercial desalination plants [3,36]. It is a process applied in many places, in which it is possible to obtain sufficiently clean drinking water; an additional advantage is that it requires just few additives. However, corrosion is a very common phenomenon if non-stainless steel is used. MSF is commercially operated in large-sized plants, is easy to manage, and has a long-term operation record [33].
Water 2021, 13, x FOR PEER REVIEW 4 of 28
Main type of energy re-
quirements Thermal Electricity
Driving force Heat Pressure/Electricity
Specific energy consump-
tion High Low
1.2.1. Thermal Desalination Technology
The thermal process is a phase-changed method in which the feedwater is heated under an operating temperature and pressure. Water vapor condenses as pure water, leaving behind salts and other non-volatile substances. Thermal processes are operated using heat and mechanical energy with a larger required amount compared to membrane processes. Therefore, most of the operational processes with many steps reuse heat through a sequential process of condensation and evaporation [33]. The thermal technol- ogies include multi-effect distillation (MED), mechanical vapor compression (MVC), multi-stage flash distillation (MSF), and thermal vapor compression (TVC).
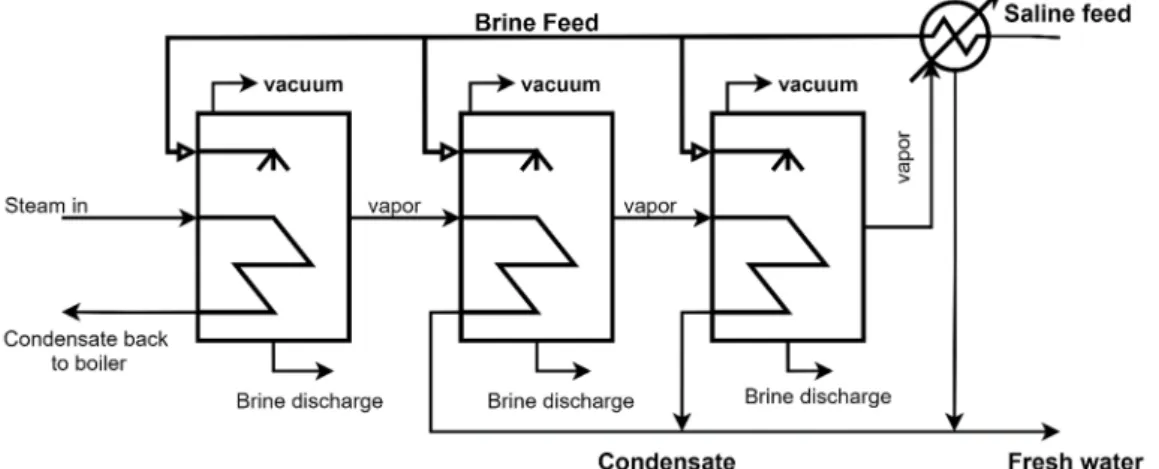
The theoretical operation of the MED and MSF techniques is shown in Figures 2 and 3. In MED, the vapors of each stage condense in the next successive stage; the hot pipes are then sprayed with seawater to evaporate the water; this process is repeated for the next stage. A saline solution is collected at the bottom of each stage and circulated to the next stage or delivered out of the system [34]. MED units can be arranged in several ways, depending on the type of heat exchangers (horizontal or vertical), the direction of flow of the brine or steam (forward, backward, parallel), etc. For energy efficiency, steam is usu- ally extracted from a power plant’s steam turbine or utilized as waste energy from other industrial processes. As the primary steam does not come into direct contact with the brine, the condensate inside the evaporator is usually circulated, and the boiler chemicals are not spread into the pure distillate. MSF is based on heat transfer desalination technol- ogy consisting of the evaporation and condensation of water. It is an energy-intensive process that requires both heat and electricity. The evaporation and condensation steps are connected in several stages so that the latent heat of evaporation is recovered by pre- heating the incoming water. The principle of the process is that the saltwater is evapo- rated, and the water and salt can be separated. Evaporation occurs several times (15–20 times) in series-connected chambers and at low pressure so that the water boils at a lower temperature [35].
Figure 2. Schematic diagram of MED, amended from [34]. Figure 2.Schematic diagram of MED, amended from [34].
Water2021,13, 3023 5 of 27
Water 2021, 13, x FOR PEER REVIEW 5 of 28
Figure 3. Schematic diagram of MSF, amended from [34].
Figure 4 shows the current contribution of installed desalination technologies all over the world. The most commercially used thermal technology is MSF, with 18% of the mar- ket share of commercial desalination plants [3,36]. It is a process applied in many places, in which it is possible to obtain sufficiently clean drinking water; an additional advantage is that it requires just few additives. However, corrosion is a very common phenomenon if non-stainless steel is used. MSF is commercially operated in large-sized plants, is easy to manage, and has a long-term operation record [33].
(a) (b)
Figure 4. Desalination technology distribution in 2019: (a) desalination capacity (million m3/day);
(b) desalination capacity (%), data from [37].
1.2.2. Membrane Desalination Technology
Membrane processes are non-phase-changed procedures. The water remains in the liquid phase, and semipermeable membranes separate the water or salt from the feedwa- ter. The electrical power or the natural osmotic pressure gradient drives these processes.
Membrane technology includes microfiltration (MF), nanofiltration (NF), ultrafiltration (UF), membrane bioreactors (MBs) [38], membrane distillation (MD) [39], electrodialysis (ED) [40,41], forward osmosis (FO), and reverse osmosis (RO) [12]. MF and UF membrane systems are not usually directly used for desalination, but their use has increased signifi- cantly in recent years for RO pre-treatment. MF and UF systems can effectively remove colloidal organics, turbidity, insoluble particles, viruses, or pathogens in seawater [42]. As with MF and UF, NF has been applied as a pre-treatment for desalination; however, its
65.5 17.1 6.652.85 0.951.9
0 10 20 30 40 50 60 70 80 90 100
Desalination capacity (millionm3/day)
Desalination technology
69%
18%
7%
3% 2% 1%
RO MSF MED
NF ED Other
Figure 3.Schematic diagram of MSF, amended from [34].
Water 2021, 13, x FOR PEER REVIEW 5 of 28
Figure 3. Schematic diagram of MSF, amended from [34].
Figure 4 shows the current contribution of installed desalination technologies all over the world. The most commercially used thermal technology is MSF, with 18% of the mar- ket share of commercial desalination plants [3,36]. It is a process applied in many places, in which it is possible to obtain sufficiently clean drinking water; an additional advantage is that it requires just few additives. However, corrosion is a very common phenomenon if non-stainless steel is used. MSF is commercially operated in large-sized plants, is easy to manage, and has a long-term operation record [33].
(a) (b)
Figure 4. Desalination technology distribution in 2019: (a) desalination capacity (million m3/day);
(b) desalination capacity (%), data from [37].
1.2.2. Membrane Desalination Technology
Membrane processes are non-phase-changed procedures. The water remains in the liquid phase, and semipermeable membranes separate the water or salt from the feedwa- ter. The electrical power or the natural osmotic pressure gradient drives these processes.
Membrane technology includes microfiltration (MF), nanofiltration (NF), ultrafiltration (UF), membrane bioreactors (MBs) [38], membrane distillation (MD) [39], electrodialysis (ED) [40,41], forward osmosis (FO), and reverse osmosis (RO) [12]. MF and UF membrane systems are not usually directly used for desalination, but their use has increased signifi- cantly in recent years for RO pre-treatment. MF and UF systems can effectively remove colloidal organics, turbidity, insoluble particles, viruses, or pathogens in seawater [42]. As with MF and UF, NF has been applied as a pre-treatment for desalination; however, its
65.5 17.1 6.652.85 0.951.9
0 10 20 30 40 50 60 70 80 90 100
Desalination capacity (millionm3/day)
Desalination technology
69%
18%
7%
3% 2% 1%
RO MSF MED
NF ED Other
Figure 4.Desalination technology distribution in 2019: (a) desalination capacity (million m3/day);
(b) desalination capacity (%), data from [37].
1.2.2. Membrane Desalination Technology
Membrane processes are non-phase-changed procedures. The water remains in the liquid phase, and semipermeable membranes separate the water or salt from the feedwa- ter. The electrical power or the natural osmotic pressure gradient drives these processes.
Membrane technology includes microfiltration (MF), nanofiltration (NF), ultrafiltration (UF), membrane bioreactors (MBs) [38], membrane distillation (MD) [39], electrodialysis (ED) [40,41], forward osmosis (FO), and reverse osmosis (RO) [12]. MF and UF membrane systems are not usually directly used for desalination, but their use has increased signifi- cantly in recent years for RO pre-treatment. MF and UF systems can effectively remove colloidal organics, turbidity, insoluble particles, viruses, or pathogens in seawater [42].
As with MF and UF, NF has been applied as a pre-treatment for desalination; however, its filtering efficiency is greater than that of MF and UF, and it can remove very small particles of around 0.001 microns by osmotic driving forces [43]. ED drives the ions (not water) from the seawater through membranes to electrodes of an opposite charge with electric energy as the driving force; ED is much more favourable for desalination of low salt contents of about 8–10 g/L or a few thousand ppm TDS, as its cost is proportional to the amount of carried salt through the membrane. The RO method is based on the principle of reverse osmosis, in which the seawater is pressed through a semipermeable membrane, and the salt remains behind the membrane. Pressure is applied to the higher-concentration
Water2021,13, 3023 6 of 27
solution so that the solvent, as opposed to osmosis, flows toward the lower-concentration solution. As a result, this provides pure water and a salt concentrate. The advantage is that the amount of pure water recovered and the seawater used for it is high and that it not only filters off the salt but also other harmful substances (see Table3) [44]. However, the disadvantages are membrane scaling, fouling, and the requirement of external pressure application [33]. The theoretical operation of RO is shown in Figure5. After pre-treatment to remove solids, the seawater is compressed by a high-pressure pump (HPP) to supply the RO desalination unit. RO is realized in a cross-flow so that the feed stream flows parallel to the surface of the membrane while some of the components of the mixture pass through the membrane and leave the permeate side. The direction of feeding reduces the possibility of concentration polarization, as the feed current washes away the filtered molecules from the surface of the membrane [45]. The total energy consumption for desalination may be reduced by improvement in membrane properties, and/or an additional energy recovery system, which is commonly used to recover this hydraulic energy and transfer it to the feed stream. This system helps to reduce the amount of energy and the size required by the HPPs [46].
Water 2021, 13, x FOR PEER REVIEW 6 of 28
filtering efficiency is greater than that of MF and UF, and it can remove very small parti- cles of around 0.001 microns by osmotic driving forces [43]. ED drives the ions (not water) from the seawater through membranes to electrodes of an opposite charge with electric energy as the driving force; ED is much more favourable for desalination of low salt con- tents of about 8–10 g/L or a few thousand ppm TDS, as its cost is proportional to the amount of carried salt through the membrane. The RO method is based on the principle of reverse osmosis, in which the seawater is pressed through a semipermeable membrane, and the salt remains behind the membrane. Pressure is applied to the higher-concentra- tion solution so that the solvent, as opposed to osmosis, flows toward the lower-concen- tration solution. As a result, this provides pure water and a salt concentrate. The ad- vantage is that the amount of pure water recovered and the seawater used for it is high and that it not only filters off the salt but also other harmful substances (see Table 3) [44].
However, the disadvantages are membrane scaling, fouling, and the requirement of ex- ternal pressure application [33]. The theoretical operation of RO is shown in Figure 5. Af- ter pre-treatment to remove solids, the seawater is compressed by a high-pressure pump (HPP) to supply the RO desalination unit. RO is realized in a cross-flow so that the feed stream flows parallel to the surface of the membrane while some of the components of the mixture pass through the membrane and leave the permeate side. The direction of feeding reduces the possibility of concentration polarization, as the feed current washes away the filtered molecules from the surface of the membrane [45]. The total energy consumption for desalination may be reduced by improvement in membrane properties, and/or an ad- ditional energy recovery system, which is commonly used to recover this hydraulic en- ergy and transfer it to the feed stream. This system helps to reduce the amount of energy and the size required by the HPPs [46].
Figure 5. Schematic diagram of an RO desalination unit with an energy recovery system, amended from [47].
Among the several listed desalination technologies, the three most applied ones are RO, MSF, and MED [36,48]. Desalination by RO accounts for 69% of the technology in the total installed desalination capacity worldwide (65.5 million m3/day) (see Figure 4).
Figure 5.Schematic diagram of an RO desalination unit with an energy recovery system, amended from [47].
Among the several listed desalination technologies, the three most applied ones are RO, MSF, and MED [36,48]. Desalination by RO accounts for 69% of the technology in the total installed desalination capacity worldwide (65.5 million m3/day) (see Figure4).
Many studies have been conducted comparing different desalination technologies based on electrical/thermal/total energy consumption, technology conditions, environ- mental impact, product quality, and product cost [49–52]. As it can be seen in Table3, membrane technology is optimal based on a combination of both energy consumption and CO2emissions. However, the unit cost of products is close to that of thermal technology because of its higher operating and maintenance costs. Currently, conventional fossil fuels are the energy source for 99% of the desalination process [49].
Water2021,13, 3023 7 of 27
Table 3.Comparison of desalination techniques [49–52].
Thermal Technology Membrane Technology
MSF MED MVC TVC ED RO
Water type Seawater,
Brackish
Seawater, Brackish
Seawater, Brackish
Seawater,
Brackish Brackish Seawater, Brackish
Operation temperature (◦C) 90–110 70 70–100 63–70 Ambient Ambient
Typical unit size (m3/day) 50,000–70,000 5000–15,000 100–3000 10,000–30,000 2–145,000 24,000 Electrical energy consumption
(kWh/m3) 4–6 1.5–2.5 7–12 1.8–1.6 2.6–5.5 5–9
Thermal energy consumption
(KJ/kg) 190–390 230–390 none 145–390 none none
Electrical equivalent for
thermal energy (kWh/m3) 9.5–19.5 5–8.5 none 9.5–25.5 none none
Total electric equivalent
(kWh/m3) 13.5–25.5 6.5–11 7–12 11–28 2.6–5.5 5–9
Maximum value of CO2
emissions (kg CO2/m3) 24 19.2 11.5 21 5.3 8.6
Distillate quality—TDS (ppm) ~10 ~10 ~10 ~10 150–500 <500
Unit product cost (USD/m3) 0.52–1.75 0.52–1.01 2–2.6 0.827 0.6–1.05 0.52–0.56
1.2.3. Hybrid Desalination Technology
Hybrid desalination systems usually combine both thermal and membrane desalina- tion processes with at least one additional process, the latter used to pre-treat feedwater prior to desalination, to treat the brine prior to its management, and/or to produce energy, e.g., FO-NF, ED-RO, RO-MD, FO-ED, RO-MSF, RO-MED, or RO-ED. The deployment of RO-MSF and RO-MED in power plants and desalination in Ras Al-Khair in Saudi Arabia, Fujairah I and II in the UAE, and Az-Zour in Kuwait shows the application of hybrid systems on a large scale [53]. The simple hybrid system RO-MSF has been applied to new commercial desalination plants [54]. The hybrid system has been regarded as an economic alternative for independent systems. It has the ability to reduce stress and pressure on energy consumption, scaling, and fouling, as well as the cost of desalinated water through improved recovery rates and the overall quality of the water [53,55].
Desalination requires a high amount of energy which is usually provided by fossil fuels. Using renewable energy (RE) sources to operate desalination technologies is a good alternative to decrease the climate impacts of desalination and to produce freshwater in remote regions with severe water scarcity and an unfavorable or impracticable connection to the public electrical grid. Most installed solar, geothermal, and wind or hybrid so- lar/wind desalination plants have small capacities. Heat or electricity controls membrane and distillation processes, while RE systems generate mechanical energy [50]. Among the renewable energies, solar energy is the most popular and widely used in the world.
The reason is that solar energy is available free in the natural form of heat which can be used directly to desalinate and in even greater quantities. It is the most plentiful source available for the Earth, and the cleanest. Arid areas often have a lot of potential for solar energy. Desalination using solar energy is the process in which salt is separated from saltwater (brackish water or saltwater) with the help of solar energy [56]. Solar desalination involves evaporation and condensation. Modern technologies allow both the light and heat of the sun to be employed for energy generation. The main ways to use solar energy directly are by converting solar energy into heat (photothermal—a simple thermal solar collector) or electricity (photovoltaic (PV)/solar cells) using a device (collector, solar cells).
The distribution of renewable energy with desalination technology is shown in Figure6.
PV-RO is the most suitable option for desalination.
Water2021,13, 3023 8 of 27
Water 2021, 13, x FOR PEER REVIEW 8 of 28
evaporation and condensation. Modern technologies allow both the light and heat of the sun to be employed for energy generation. The main ways to use solar energy directly are by converting solar energy into heat (photothermal—a simple thermal solar collector) or electricity (photovoltaic (PV)/solar cells) using a device (collector, solar cells). The distri- bution of renewable energy with desalination technology is shown in Figure 6. PV-RO is the most suitable option for desalination.
Figure 6. Desalination techniques fed by renewable energy sources in 2017, data from [50].
As shown in Tables 3 and 4, renewable energy desalination technology is costly com- pared to conventional desalination technology. Despite the relatively low operating and maintenance costs, the required capital of renewable energy systems is high; conse- quently, the produced water expense is high [54]. However, with the rapid development of renewable energy technologies, it is expected that the cost will be reduced, and the water production cost will eventually become lower.
Table 4. Energy consumption and water production cost of renewable energy (RE) desalination [52]. RE Desalination Process Typical Capacity
(m3/day)
Energy Demand (kWhe/m3)
Water Production Cost (USD/m3)
Solar still <100 Solar passive 1.3–6.5
Solar MEH 1–100 Thermal 29.6
Electrical 1.5 2.6–6.5
Solar MD 0.15–10 45–59 10.5–19.5
Solar pond/MED 20,000–200,000 Thermal 12.4–24.1
Electrical 2–3 0.71–0.89
Solar pond/RO 20,000–200,000 Seawater 4–6
Brackish water 1.5–4 0.66–0.77
Solar CSP/MED >5000 Thermal 12.4–24.1
Electrical 2–3 2.4–2.8
Solar PV/RO <100 Seawater 4–6
Brackish water 1.5–4
11.7–15.6 6.5–9.1
Solar PV/EDR <100 1.5–4 10.4–11.7
Wind/RO 50–2000 Seawater 4–6
Brackish water 1.5–4
6.6–9 small capacity 1.95–5.2 for 1000 m3/d
Wind/MVC <100 7–12 5.2–7.8
Geothermal/MED 80 Thermal 12.4–24.1
Electrical 2–3 2–2.8
PV RO 32%
Wind RO PV ED 19%
6%
Wind MVC
5%
Hybrid 4%
Solar MED
13%
Solar MSF 6%
Other 15%
Figure 6.Desalination techniques fed by renewable energy sources in 2017, data from [50].
As shown in Tables3and4, renewable energy desalination technology is costly com- pared to conventional desalination technology. Despite the relatively low operating and maintenance costs, the required capital of renewable energy systems is high; consequently, the produced water expense is high [54]. However, with the rapid development of re- newable energy technologies, it is expected that the cost will be reduced, and the water production cost will eventually become lower.
Table 4.Energy consumption and water production cost of renewable energy (RE) desalination [52].
RE Desalination Process Typical Capacity (m3/day)
Energy Demand (kWhe/m3)
Water Production Cost (USD/m3)
Solar still <100 Solar passive 1.3–6.5
Solar MEH 1–100 Thermal 29.6
Electrical 1.5 2.6–6.5
Solar MD 0.15–10 45–59 10.5–19.5
Solar pond/MED 20,000–200,000 Thermal 12.4–24.1
Electrical 2–3 0.71–0.89
Solar pond/RO 20,000–200,000 Seawater 4–6
Brackish water 1.5–4 0.66–0.77
Solar CSP/MED >5000 Thermal 12.4–24.1
Electrical 2–3 2.4–2.8
Solar PV/RO <100 Seawater 4–6
Brackish water 1.5–4
11.7–15.6 6.5–9.1
Solar PV/EDR <100 1.5–4 10.4–11.7
Wind/RO 50–2000 Seawater 4–6
Brackish water 1.5–4
6.6–9 small capacity 1.95–5.2 for 1000 m3/d
Wind/MVC <100 7–12 5.2–7.8
Geothermal/MED 80 Thermal 12.4–24.1
Electrical 2–3 2–2.8
2. Materials and Methods 2.1. Life Cycle Analysis (LCA) 2.1.1. Goal and Scope
This study compared the three most commonly used desalination processes (MSF, MED, RO) in terms of environmental impacts. Then, it examined how the use of different renewable energy sources and nuclear energy affects the results. This study only considered the operational phase of a plant, which includes the necessary energy and chemical needs,
Water2021,13, 3023 9 of 27
which is called “gate-to-gate” analysis. Irrespective of the type of plant, the operational phase is responsible for a significant part (85–95%) of the environmental impact. Data from Saudi Arabia were used for the analysis, with the base unit of 1 m3of the water product.
The system boundary for each desalination plant is shown in Figure7.
Water 2021, 13, x FOR PEER REVIEW 9 of 28
2. Materials and Methods 2.1. Life Cycle Analysis (LCA) 2.1.1. Goal and Scope
This study compared the three most commonly used desalination processes (MSF, MED, RO) in terms of environmental impacts. Then, it examined how the use of different renewable energy sources and nuclear energy affects the results. This study only consid- ered the operational phase of a plant, which includes the necessary energy and chemical needs, which is called “gate-to-gate” analysis. Irrespective of the type of plant, the opera- tional phase is responsible for a significant part (85–95%) of the environmental impact.
Data from Saudi Arabia were used for the analysis, with the base unit of 1 m3 of the water product. The system boundary for each desalination plant is shown in Figure 7.
Figure 7. Flow chart of the desalination process, amended from [57]. 2.1.2. Inventory Analysis
This study did not include piping systems, pumps, water tanks, and additional units.
The emissions from material transportation and construction were also not considered in this study due to data deficiencies and their insignificant impacts [58]. The investment and the plant required for the transport costs and at the end of the life cycle management of waste materials were investigated. The input and output data were collected from an existing study [58] and are listed in Table 5, in which each parameter belongs to the pro- duction of 1 m3 of drinking water. The data were based on a report of the Federal Ministry for Environment, Nature Conservation and Nuclear Safety, Germany, in 2007 [58].
Table 5. Typical desalination plant inventory data for the production of 1 m3 of drinking water [58].
MSF MED RO Unit
Input
Seawater 10 9 3 m3
Heat Energy 290 267.5 - MJ
Electric Energy 4 2 4 kWh
Disinfectant Chlorine 20,5 18.5 3.5 g
Antiscalant Phosphoric acid - 27 6 g
Figure 7.Flow chart of the desalination process, amended from [57].
2.1.2. Inventory Analysis
This study did not include piping systems, pumps, water tanks, and additional units.
The emissions from material transportation and construction were also not considered in this study due to data deficiencies and their insignificant impacts [58]. The investment and the plant required for the transport costs and at the end of the life cycle management of waste materials were investigated. The input and output data were collected from an existing study [58] and are listed in Table5, in which each parameter belongs to the production of 1 m3of drinking water. The data were based on a report of the Federal Ministry for Environment, Nature Conservation and Nuclear Safety, Germany, in 2007 [58].
2.1.3. Life Cycle Impact Assessment (LCIA)
In the LCIA phase, life cycle inventory data were converted into potential impacts for the product in a quantitative figure by means of characterization factors, based on SimaPro Life Cycle Analysis software version 9.1, which is registered trademark of PRéSustainability B.V in Netherlands. The following methods of impact analysis and evaluation: IMPACT 2002+ V2.14, ReCiPe 2016 Endpoint (H) V1.02, and IPCC 2013 GWP 100a V1.03, were used in this study.
The IMPACT 2002+ methodology combines the midpoint and damage (or endpoint) approaches and links all types of life cycle inventory results via 14 midpoint categories to 4 damage categories (see Figure8). It allocates these midpoint categories to one or more damage categories and represents changes in the quality of the environment. However, it has some limitations. For instance, several impact categories are not totally considered, such as impacts on the marine environment, noise, ecotoxicity, and human toxicity of metals [59]. The unit of human health damage is DALY (disability-adjusted life-years), i.e., it expresses a number of years of fully healthy life lost [60]. The ecosystem quality indicator is expressed in potentially disappeared fraction (PDF)*m2*year, which is the percentage of
Water2021,13, 3023 10 of 27
species that have become extinct in each area and time period due to environmental loads.
The resources indicator is expressed as the surplus energy needed for mineral extraction and non-renewable energy. The climate change indicator is represented by kg CO2eq
emission into the air. Normalization makes it easier to interpret the results by comparing each category of the graph with the same units. It also provides an opportunity to discuss the consequences of weighting. It provides an estimate of the magnitude of the weighting factors required to differentiate between different categories. Normalization is performed by dividing the effect (for damage categories) by the appropriate normalization factors (shown in Table6), which represents the total impact of the specific category divided by the total European or world population. The total impact of the specific category is calculated by summing the products between all European emissions, resource consumption, and the respective damage factors [59]. Table6provides an overview of the normalization factors for the four damage categories for Western Europe, which were identified based on the CML impact assessment method for European emissions, referring to the year 2000 [61].
Table 5.Typical desalination plant inventory data for the production of 1 m3of drinking water [58].
MSF MED RO Unit
Input
Seawater 10 9 3 m3
Heat Energy 290 267.5 - MJ
Electric Energy 4 2 4 kWh
Disinfectant Chlorine 20.5 18.5 3.5 g
Antiscalant Phosphoric acid - 27 6 g
Sulfuric acid 20 - 195 g
Chlorine removal Sodium bisulfite - 18 9 g
Antifoam Propylene glycol 1 0.9 - g
Coagulant Aluminum chloride - - 6.75 g
Ferric chloride - - 53.7 g
Flocculant Polyacrylamide - - 6.3 g
Mineral
supplementation Calcium hydroxide 0.5 0.5 0.5 g
Output
Chlorine 0.7 0.7 0.7 g
Phosphoric acid - 10 - g
Sulfuric acid 8 - 6 g
Copper (from corrosion of structural materials) 0.03 20 - mg
Propylene glycol 0.09 0.09 - g
Sodium chloride 45 45 45 kg
Waste heat 73.44 114.24 - MJ
Table 6.Normalization factors for the four damage categories for Western Europe version 1.0 [59].
Damage Categories Normalization Factors Unit
Human health 0.0077 DALY/person/year
Ecosystem quality 4650 PDF*m2*year/person/year
Climate change 9950 kg CO2/person/year
Resources 152,000 MJ/person/year
Water2021,13, 3023 11 of 27
Water 2021, 13, x FOR PEER REVIEW 11 of 28
Figure 8. Scheme of the IMPACT 2002+ framework, emission from [59].
Table 6. Normalization factors for the four damage categories for Western Europe version 1.0 [59]. Damage Categories Normalization Factors Unit
Human health 0.0077 DALY/person/year
Ecosystem quality 4650 PDF*m2*year/person/year
Climate change 9950 kg CO2/person/year
Resources 152,000 MJ/person/year ReCiPe provides harmonized characterization factors at 18 midpoints and 3 end-
points (effect on human health, biodiversity, resource scarcity) that are representative of the global scale according to three perspectives: individualist, hierarchist, and egalitarian [62]. ReCiPe is considered as the broadest set of midpoint impact categories, using global impact mechanisms wherever possible. Unlike other methods (Eco-Indicator 99, EPS, LIME, IMPACT 2002+), the ReCiPe method does not include the possible effects of future extractions but assumes that these effects have been included in the inventory analysis.
ReCiPe 2016 is a further development of ReCiPe 2008, with its predecessors CML 2000 and Eco-Indicator 99. Figure 9 shows a scheme of the ReCiPe 2016 framework.
Figure 8.Scheme of the IMPACT 2002+ framework, emission from [59].
ReCiPe provides harmonized characterization factors at 18 midpoints and 3 endpoints (effect on human health, biodiversity, resource scarcity) that are representative of the global scale according to three perspectives: individualist, hierarchist, and egalitarian [62].
ReCiPe is considered as the broadest set of midpoint impact categories, using global impact mechanisms wherever possible. Unlike other methods (Eco-Indicator 99, EPS, LIME, IMPACT 2002+), the ReCiPe method does not include the possible effects of future extractions but assumes that these effects have been included in the inventory analysis.
ReCiPe 2016 is a further development of ReCiPe 2008, with its predecessors CML 2000 and Eco-Indicator 99. Figure9shows a scheme of the ReCiPe 2016 framework.
Water 2021, 13, x FOR PEER REVIEW 12 of 28
Figure 9. Scheme of the ReCiPe 2016 framework, emission from [63].
The IPCC 2013 GWP 100a method is an environmental assessment method which expresses the emissions of GHGs generated, in kilograms of CO2 equivalent, over a time horizon of 100 years. The process is much simpler than Eco-Indicator 99, as it only tests one impact category, meaning there is no possible normalization or weighting. It charac- terizes different gas emissions according to their global warming potential (GWP). Aggre- gation of different emissions in the climate change impact category is one of the most common methods in LCIA. The GHG emission characterization values are based on the global warming potentials published by the IPCC (Intergovernmental Panel on Climate Change). GWP is proportional to the carbon dioxide effect. GWP is an index for estimating the relative global warming contribution that shows the effect of atmospheric emissions per kilogram of a given greenhouse gas compared to the effect of one kilogram of carbon dioxide emissions [64].
2.2. PESTLE Risk Analysis
PESTLE analysis includes political, economic, social, technological, legal, and envi- ronmental factors that could have a direct or long-lasting impact on processes and tech- nologies [65]. PESTLE identifies opportunities and external risks which may be too ab- stract but should be considered and not ignored. These factors can vary between different regions and countries, but there can be many socio-cultural differences within a country as well. PESTLE is most effective when it is applied from different perspectives. Carrying out a PESTLE analysis should start with collecting the information to answer the follow- ing questions: how the government might influence the economy or a certain industry and legal drivers locally, nationally, or internationally (political and legal); how the econ- omy performs (economic); how to affect the community socially (social); how innovations in technology may impact operations and activities (technological); and how to influence the surrounding environment (environmental). PESTLE analysis should be conducted regularly or on an ongoing basis for greater effectiveness. This tool provides the frame- work for the critical generality evaluation of desalination management [66,67]. However, Figure 9.Scheme of the ReCiPe 2016 framework, emission from [63].
Water2021,13, 3023 12 of 27
The IPCC 2013 GWP 100a method is an environmental assessment method which expresses the emissions of GHGs generated, in kilograms of CO2equivalent, over a time horizon of 100 years. The process is much simpler than Eco-Indicator 99, as it only tests one impact category, meaning there is no possible normalization or weighting. It characterizes different gas emissions according to their global warming potential (GWP). Aggregation of different emissions in the climate change impact category is one of the most common methods in LCIA. The GHG emission characterization values are based on the global warming potentials published by the IPCC (Intergovernmental Panel on Climate Change).
GWP is proportional to the carbon dioxide effect. GWP is an index for estimating the relative global warming contribution that shows the effect of atmospheric emissions per kilogram of a given greenhouse gas compared to the effect of one kilogram of carbon dioxide emissions [64].
2.2. PESTLE Risk Analysis
PESTLE analysis includes political, economic, social, technological, legal, and en- vironmental factors that could have a direct or long-lasting impact on processes and technologies [65]. PESTLE identifies opportunities and external risks which may be too abstract but should be considered and not ignored. These factors can vary between dif- ferent regions and countries, but there can be many socio-cultural differences within a country as well. PESTLE is most effective when it is applied from different perspectives.
Carrying out a PESTLE analysis should start with collecting the information to answer the following questions: how the government might influence the economy or a certain industry and legal drivers locally, nationally, or internationally (political and legal); how the economy performs (economic); how to affect the community socially (social); how innovations in technology may impact operations and activities (technological); and how to influence the surrounding environment (environmental). PESTLE analysis should be conducted regularly or on an ongoing basis for greater effectiveness. This tool provides the framework for the critical generality evaluation of desalination management [66,67]. How- ever, the previously published literature is only concerned with the economic, social, and environmental factors, or it does not fully analyze the six factors of PESTLE. In this article, desalination technologies were evaluated based on all the factors of PESTLE: political-legal, economic, social, technological, and environmental, from the results of an assessment of environmental and social aspects of the LCA methodology and the documents collected.
2.3. Multi-Criteria Decision Analysis (MCDA)
Multi-criteria decision analysis (MCDA) is an aid tool for this process of decision making, which is able to relatively easily evaluate multiple (conflicting) criteria. Several MCDA approaches have been suggested in order to choose the optimal options, such as MAXMIN, MAXMAX, SAW, AHP, TOPSIS, SMART, and ELECTRE [68]. TOPSIS (Technique for Order Preference by Similarity to the Ideal Solution) is simple, comprehensive, and capable of measuring the relative performance of each alternative from best to worst.
TOPSIS’s basic concept is selecting the alternative according to the standard closest to the ideal solution [69]. The classical TOPSIS method relies on numerical data from decision makers, which helps to construct problems and conduct analysis, comparison, and ranking of the alternatives. In this article, MCDA of desalination technologies based on PESTLE analysis with the classical TOPSIS method for a single decision maker was used; thus, the input values must be numerical, in accordance with the following steps [69]:
1. Construction of the normalized decision matrix from decision matrixX= (xij), where xij is the value ofi-alternative with respect toj-criterion, andnijis a normalized value.
nij = q xij
∑mi=1x2ij, fori = 1, 2, . . . m; j = 1, 2, . . . n (1)
Water2021,13, 3023 13 of 27
2. Construction of the weighted normalized decision matrix, wherevijis a weighted normalized value.
vij=wjnij, fori = 1, 2, . . . m; j = 1, 2, . . . nand
∑
nj=1 wj = 1 (2) 3. Determination of the positive (A+)and negative ideal solutions (A−):A+ = (v+1,v+2, . . . ,v+n
(3) wherev+1,v+2, v+n are the maximum value of the benefit criteria and the minimum value of the cost criteria;
A− = (v1−, v−2, . . . ,v−n
(4) wherev−1,v−2, v−n are the maximum value of the cost criteria and the minimum value of the benefit criteria.
4. Calculation of the separation measure:
d+i = r
∑
nj=1vij−v+j 2
, fori = 1, 2, . . . m (5)
d−i = r
∑
nj=1vij−v−j 2, fori = 1, 2, . . . m (6) 5. Calculation of the relative closeness to the positive ideal solution:Ri= d
− i
di−+d+i , fori = 1, 2, . . . m (7) where 0≤Ri≤1.
6. Rank the preference order by selecting the closest to 1 out of the alternatives.
3. Results and Discussion 3.1. Political and Legal Aspects
Political and legal aspects determine the extent to which the government may manip- ulate a certain industry or the economy. Through tax policies, fiscal policy, trade tariffs, quotas, resources, import–export laws, etc., the government may promote or inhibit the development of industries [65]. The expansion of desalination is shown to be geograph- ically uneven. The leading countries in terms of total installed desalination capacity are the Arabian Gulf countries, such as Saudi Arabia and the UAE. How are the Arabian Gulf countries leading in terms of thermal desalination? In addition to the geographical advantages of the high salinity and temperature of seawater, abundant cheap fuel resources and political policies also greatly contribute to promoting the development of desalination plants. The strategy of the UAE government regarding water security is closely linked to desalination. Therefore, desalination operations’ continuity is ensured. In September 2017, the Ministry of Energy and Infrastructure revealed the UAE Water Security Strategy 2036, which will provide future water needs more sustainably by expanding the use of membrane desalination technologies and the use of renewable energy sources, extending the use of treated wastewater, encouraging water harvesting, and diminishing groundwater extraction [70]. This strategy that promotes the use of solar energy is gaining popularity.
Moreover, the UAE government encourages private participation in the development of the country’s infrastructure. In May 2019, the first large-scale solar-powered RO desalination plant, which is worth more than USD 700 million, with the capacity of 909,000 m3/d of seawater, was built at Taweelah, Abu Dhabi, by the Spanish group Abengoa and the Chinese EPC contractor Sepco III. It can be seen that solar-powered RO desalination will become a driving force in the region’s freshwater supplies in the years to come. The UAE
Water2021,13, 3023 14 of 27
aims to boost the share of clean energy in its total energy to 50% by 2050 and decarbonize the electricity sector by 70%, as part of the Energy Strategy 2050 plan.
In Europe, several countries have used desalination of seawater such as Spain, Bel- gium, and the Netherlands. Spain built Europe’s first desalination plant about 40 years ago and is the leading country of desalination technology in the Western world. The Spanish government saw an opportunity for desalination development, due to its geographical and climatological location. The government created the Actions for the Management and Use of Water (A.G.U.A.) program during the eighth parliamentary term from 2004 to 2008, which was intended to reorient the water policy to meet new needs in the Mediterranean including the construction, expansion, and renovation of a significant number of desali- nation plants [71]. In addition, the Spanish government also obtained an agreement with the European Commission for the construction of desalination plants, claiming that it was an environmental investment, of which up to 80% of the investment was received from European Cohesion Funds [72]. Article 13 of the Consolidated Text of the Water Act (TRLA in Spanish), which was approved by Royal Legislative Decree 1/2001 July 20th, concerns the laws governing desalination. Both public desalination operations and private initiatives are allowed, and both sections are treated equally as the product of private parties as well as public parties can be used to supply residential buildings, holiday resorts, etc., that lack sufficient resources, and irrigation [71].
3.2. Economic Aspects
Desalination water product costs depend on the implemented technology, types of material utilized, price of energy within the local area, plant size, and feedwater quality. It is well known that desalination is an energy-intensive process; consequently, the energy cost reserves a significant proportion, up to 30%, of the total cost. Thermal desalination technologies are about 1.53 times more capital-intensive than RO, and the total capital cost of MSF plants is USD 2 million/million liters per day, while that of MED and RO plants is USD 1.5 million and USD 1.3 million, respectively. The operation and maintenance costs of desalination plants by technology are significantly different: the total annual recurrent costs of RO, MSF, and MED plants are about USD 0.2, 0.1, and 0.06 million/million liters per day, respectively [8]. The capital expenditure (CAPEX) and operational expenditure (OPEX) of typical desalination plants are shown in Figures10and11. Compared to the CAPEX of thermal plants (Figure10a), the construction cost share of total capital costs of RO plants is 17.5% lower, but other costs are higher, such as engineering, project development, financing, and contingency costs. Most of the modern thermal desalination plants in the world are much larger in scale than those of RO technology (see Table3), meaning construction costs are also higher. The percentage of energy costs in total operational costs of RO technology outperforms that of thermal technology, decreasing from 66% to 41%, (Figure11). While variable costs (thermal, electrical energy, chemicals, membrane) as a share of the total recurrent costs tend to be higher for thermal technology, the fixed costs (labor, maintenance, other) of RO technology are higher. The cost of desalination is generally associated with technology improvements and the ability to recover more energy from the desalination process.
Additionally, the economic factors are affected by the use of chemicals, market share, research and development investment, the impact of water on the local/national economy, and national and regional political plans [66]. The increasing water scarcity and the growing water demand are expected to increase the demand for desalination globally. The world desalination market was valued at USD 17.7 billion in 2020 and is expected to increase to USD 32.1 billion by 2027. The global desalination industry is predicted to grow with a strong compound annual growth rate (CAGR) of 9.51% from 2020 to 2027 [10].
Water2021,13, 3023 15 of 27
Water 2021, 13, x FOR PEER REVIEW 15 of 28
of desalination plants by technology are significantly different: the total annual recurrent costs of RO, MSF, and MED plants are about USD 0.2, 0.1, and 0.06 million/million liters per day, respectively [8]. The capital expenditure (CAPEX) and operational expenditure (OPEX) of typical desalination plants are shown in Figures 10 and 11. Compared to the CAPEX of thermal plants (Figure 10a), the construction cost share of total capital costs of RO plants is 17.5% lower, but other costs are higher, such as engineering, project devel- opment, financing, and contingency costs. Most of the modern thermal desalination plants in the world are much larger in scale than those of RO technology (see Table 3), meaning construction costs are also higher. The percentage of energy costs in total operational costs of RO technology outperforms that of thermal technology, decreasing from 66% to 41%, (Figure 11). While variable costs (thermal, electrical energy, chemicals, membrane) as a share of the total recurrent costs tend to be higher for thermal technology, the fixed costs (labor, maintenance, other) of RO technology are higher. The cost of desalination is gen- erally associated with technology improvements and the ability to recover more energy from the desalination process.
(a) (b) Figure 10. CAPEX cost of desalination plants: (a) thermal plants; (b) RO plants [8].
(a) (b) Figure 11. OPEX cost of desalination plants: (a) thermal plants; (b) RO plants [8].
Additionally, the economic factors are affected by the use of chemicals, market share, research and development investment, the impact of water on the local/national economy, and national and regional political plans [66]. The increasing water scarcity and the grow- ing water demand are expected to increase the demand for desalination globally. The
77.5%
7%
4%4% 7.5%
60%
12.5%
7.5%
8%
12%
52%
14%
4%
2%
9%
7%
2%10%
41%
5% 11%
4%
13%
14%
4% 8%
Figure 10.CAPEX cost of desalination plants: (a) thermal plants; (b) RO plants [8].
Water 2021, 13, x FOR PEER REVIEW 15 of 28
of desalination plants by technology are significantly different: the total annual recurrent costs of RO, MSF, and MED plants are about USD 0.2, 0.1, and 0.06 million/million liters per day, respectively [8]. The capital expenditure (CAPEX) and operational expenditure (OPEX) of typical desalination plants are shown in Figures 10 and 11. Compared to the CAPEX of thermal plants (Figure 10a), the construction cost share of total capital costs of RO plants is 17.5% lower, but other costs are higher, such as engineering, project devel- opment, financing, and contingency costs. Most of the modern thermal desalination plants in the world are much larger in scale than those of RO technology (see Table 3), meaning construction costs are also higher. The percentage of energy costs in total operational costs of RO technology outperforms that of thermal technology, decreasing from 66% to 41%, (Figure 11). While variable costs (thermal, electrical energy, chemicals, membrane) as a share of the total recurrent costs tend to be higher for thermal technology, the fixed costs (labor, maintenance, other) of RO technology are higher. The cost of desalination is gen- erally associated with technology improvements and the ability to recover more energy from the desalination process.
(a) (b) Figure 10. CAPEX cost of desalination plants: (a) thermal plants; (b) RO plants [8].
(a) (b) Figure 11. OPEX cost of desalination plants: (a) thermal plants; (b) RO plants [8].
Additionally, the economic factors are affected by the use of chemicals, market share, research and development investment, the impact of water on the local/national economy, and national and regional political plans [66]. The increasing water scarcity and the grow- ing water demand are expected to increase the demand for desalination globally. The
77.5%
7%
4%4% 7.5%
60%
12.5%
7.5%
8%
12%
52%
14%
4%
2%
9%
7%
2%10%
41%
5% 11%
4%
13%
14%
4% 8%
Figure 11.OPEX cost of desalination plants: (a) thermal plants; (b) RO plants [8].
3.3. Social Aspects
The social aspects consider all factors that affect the market and community socially, including the advantages and disadvantages to the people of the areas in which desalination plants are operated [65]. The social aspect of desalination was investigated with the IMPACT 2002+ V2.14 and ReCiPe 2016 Endpoint (H) V1.02 methods. The damage category is human health, and the impact categories are listed in Figures8and9and are described in more detail in Section2.1.3.
Figure12shows a comparison of the base case of the three technologies (RO, MSF, MED) based on the human health damage category of the ReCiPe 2016 and IMPACT 2002+
methods. Table7contains the exact values for the human health damage category in the corresponding unit.
Table 7.Results for the human health category for the three technologies based on the ReCiPe 2016 and IMPACT 2002+ methods.
Method RO MSF MED Unit
IMPACT 2002+ 2.98×10⁻⁶ 1.43×10⁻⁵ 9.86×10⁻⁶ DALY
ReCiPe 2016 9.05×10⁻⁶ 3.89×10⁻⁵ 3.35×10⁻⁵ DALY
![Figure 1. Number and capacity of desalination plants by region in 2019: (a) number of desalination plants; (b) desalination capacity (million m 3 /day), with data from [9]](https://thumb-eu.123doks.com/thumbv2/9dokorg/744528.30861/2.892.258.834.655.962/figure-number-capacity-desalination-desalination-desalination-capacity-million.webp)
![Table 1. Required energy use of distinct water sources for 1 m 3 of drinking water [30,31].](https://thumb-eu.123doks.com/thumbv2/9dokorg/744528.30861/3.892.248.837.679.809/table-required-energy-distinct-water-sources-drinking-water.webp)
![Figure 5. Schematic diagram of an RO desalination unit with an energy recovery system, amended from [47]](https://thumb-eu.123doks.com/thumbv2/9dokorg/744528.30861/6.892.257.702.453.768/figure-schematic-diagram-desalination-unit-energy-recovery-amended.webp)
![Table 3. Comparison of desalination techniques [49–52].](https://thumb-eu.123doks.com/thumbv2/9dokorg/744528.30861/7.892.61.840.172.557/table-comparison-of-desalination-techniques.webp)
![Table 4. Energy consumption and water production cost of renewable energy (RE) desalination [52]](https://thumb-eu.123doks.com/thumbv2/9dokorg/744528.30861/8.892.55.848.596.1013/table-energy-consumption-water-production-renewable-energy-desalination.webp)
![Figure 7. Flow chart of the desalination process, amended from [57] . 2.1.2. Inventory Analysis](https://thumb-eu.123doks.com/thumbv2/9dokorg/744528.30861/9.892.257.622.231.631/figure-flow-chart-desalination-process-amended-inventory-analysis.webp)
![Table 5. Typical desalination plant inventory data for the production of 1 m 3 of drinking water [58].](https://thumb-eu.123doks.com/thumbv2/9dokorg/744528.30861/10.892.80.837.450.948/table-typical-desalination-plant-inventory-production-drinking-water.webp)
![Table 6. Normalization factors for the four damage categories for Western Europe version 1.0 [59]](https://thumb-eu.123doks.com/thumbv2/9dokorg/744528.30861/11.892.251.752.708.1111/table-normalization-factors-damage-categories-western-europe-version.webp)

