ISOTOPE ANALYTICAL CHARACTERIZATION OF CARBON-BASED NANOCOMPOSITES
Tibor Szabó1,2*•Róbert Janovics1•Marianna Túri1•István Futó1•István Papp1• Mihály Braun1•Krisztián Németh3•GergőPéter Szekeres3•Anikó Kinka3• Anna Szabó3•Klára Hernádi3•Kata Hajdu1,2•László Nagy2•László Rinyu1
1Isotope Climatology and Environmental Research Centre (ICER), Institute for Nuclear Research, Hungarian Academy of Sciences, Bem tér 18/c, Debrecen 4026, Hungary.
2Department of Medical Physics and Informatics, University of Szeged, Rerrich B. tér 1, Szeged 6720, Hungary.
3Department of Applied and Environmental Chemistry, University of Szeged, Rerrich B. tér 1, Szeged 6720, Hungary.
ABSTRACT.Carbon-based nanomaterials of different dimensions (1–3D, tubes, bundles,films, papers and sponges, graphene sheets) have been created and their characteristic properties have been discussed intensively in the literature.
Due to their unique advantageous, tunable properties these materials became promising candidates in new generations of applications in many research laboratories and, recently, in industries as well. Protein-based bio-nanocomposites are referred to as materials of the future, which may serve as conceptual revolution in the development of integrated optical devices, e.g. optical switches, microimaging systems, sensors, telecommunication technologies or energy harvesting and biosensor applications. In our experiments, we designed various carbon-based nanomaterials either doped or not doped with nitrogen or sulfur during catalytic chemical vapor deposition synthesis. Radio- and isotope analytical studies have shown that the used starting materials, precursors and carriers have a strong influence on the geometry and physico-/
chemical characteristics of the carbon nanotubes produced. After determining the14C isotope constitution 53 m/m%
balance was found in the reaction center protein/carbon nanotubes complex in a sensitive way that was prepared in our laboratory. The result is essential in determining the yield of conversion of light energy to chemical potential in this bio-hybrid system.
KEYWORDS:14C analytics, carbon nanotubes, nanocomposites, N- and S-doping, reaction center protein.
INTRODUCTION
Recent developments in information/computer technologies, informatics, optoelectronics and molecular biology made it possible to manipulate materials on nanometer scales, or even at the level of molecules, which led to new disciplines of the 21st century, such as“Nanotechnology”
(see e.g. Bhushan 2004; Wolf 2004), “Nano-bionics” (see e.g. Wong et al. 2017; Giraldo et al.
2014),“(Bio-)photonics”(see e.g. Wilson et al. 2005; Gerd 2016; Kneipp 2017), etc. Thanks to the achievements of these technologies new types of materials, nanomaterials, are produced, which offer new generations of practical applications (Shoseyov and Levy 2008; Carmeli et al. 2007;
Darder et al. 2007; Fábián et al. 2010; Scholes et al. 2011; Magyar et al. 2013; Nagy et al. 2014).
Among the nanomaterials, the nanocomposites are of special interest because the advantageous properties of the components can be combined and/or new characteristics can appear with the possibility of tunable, predefined manner (Kamigaito 1991; Evangelos 2007; Nemeth et al. 2017).
The special class of nanocomposites is the bio-nanocomposites, which are considered as materials of the future (Darder et al. 2007; Shoseyov and Levy 2008; Ruiz-Hitzky et al. 2010; Nagy et al.
2014). Although the exploitation of the bio-nanocomposite materials is mainly a wish at present, there is intensive research in many laboratories aiming to explore their fundamental properties or to develop their possible practical applications. The extremely high specificity, sensitivity, and effectiveness of the biological component offer promising applications e.g. in active elements of biosensors (Li et al. 2011; Crespilho 2013; Hou et al. 2016; Szabó et al. 2017), integrated optical (Fábián et al. 2010, 2011), and optoelectronic (Flanagan et al. 1988) devices. Many attempts have been made to create light energy converting (e.g. photovoltaic) bio-nanocomposite devices (Kietzke 2007; Lee et al. 2014; Hartmann et al. 2014; Szekeres et al. 2015; Szabó et al. 2015a).
*Corresponding author. Email: szabo.tibor@med.u-szeged.hu.
Selected Papers from the 2nd Radiocarbon in the Environment Conference, Debrecen, Hungary, 3–7 July 2017
© 2018 by the Arizona Board of Regents on behalf of the University of Arizona
Additionally, the processes happening at the interface between the biological and non-biological components can be a useful model to avoid unwanted reactions against the histocompatibility of artificial tissues, organs or other implants in living beings.
To improve the electrical properties of MWCNTs, doping of lattice of carbon nanotubes with different heteroatoms (N, B, or S) (Duclaux 2002; Liu et al. (2017); Sharma et al. (2017) via chemical vapor deposition technique is a very popular method in thefield of carbon nanotube science.
There are several fields where isotope analytics and radioanalytics provide useful insights to design, create and apply nanomaterials (also (bio-)nanocomposites) in environmental sciences as well (Geranio et al. 2010; Fei et al. 2012; Kim et al. 2013, 2014; Magyar et al. 2013; Roig et al.
2016; Yedra et al. 2016; Gottselig et al. 2017). Examples are as follows:
I. Determination of types/sources of precursors (carbon sources from different environment), heteroatoms (e.g. N or S content) when carbon materials are produced.
II. Determination of element content vs. physico-/chemical characteristics of (carbon based as well) nanomaterials. We are focusing on the effects of doping (N, S doping), covering with metal oxides or functionalization on the optical and electric properties.
III. Functionalization with biological materials leads to the creation of bio-nanohybrid materials which are materials of the future. Isotope analytics helps in determination of yield of functionalization, absolute quantity of components and enzyme activity.
In our studies we are using photosynthetic reaction center (RCs) pigment protein complexes, which convert the energy of light into chemical potential of charge pairs with extremely high efficiency in the membrane of photosynthetic organisms, bacteria, algae, and plants. RCs are the most efficient light energy converter systems in nature so that these are called “Nature’s solar power stations” (Jones 2009; Scholes et al. 2011; Szabó et al. 2015b). These proteins are important to keep the primary production in the biosphere of the Earth balanced and there are more and more examples of using photosynthetic materials in bioremediation—eliminating harmful components (organic pollu- tant agents, heavy metals, etc.) as well. It is interesting to keep in mind that although the RC protein is a real nano-system (its size is 10 nm), only a single photon creates a single charge pair in it, and it assures the energetic basis of virtually all life on Earth including the source of the fossil fuels as well.
Our group has already investigated the possible unique applications of the RC protein in nanostructures or in optoelectronic systems (e.g., as fast optical switches, biosensors, and imaging or energy-converting systems (Nagy et al. 2010; Hajdu et al. 2011, 2012; Szabó et al. 2017).
In this publication we aimed to prepare nitrogen and sulfur doped carbon nanotubes and to determine the heteroatom and14C content for further characterizing the biohybrid material for future use. The heteroatom containing MWCNTs will be used as carriers and reaction center proteins (RCs) as sensitizer matrices. Radioanalytical methods were used to characterize the capacity of RCs to bind to MWCNTs which help to determine the absolute efficiency of the light energy conversion in this nanohybrid system.
MATERIALS AND METHODS
Preparation of Nitrogen and Sulfur Doped CNTs
During the experiments either Fe(III)–Co(II)/calcium carbonate or nickel(II)-oxide catalysts were used. In this study, a catalyst containing 5 m/m% Fe and 5 m/m% Co was prepared by the impregnation technique. Calculated amounts of Co(II)-acetylacetonate, Fe(III)-acetylacetonate 1102 T Szabó et al.
and CaCO3were mixed in a beaker with distilled water. After that a short sonication process was applied to prevent the aggregation of solid precursor particles. Ammonia was added to the system to set the pH to 9, and then the dispersion was placed on a magnetic stirrer and was heated and stirred intensely at 70°C until most of the solvent had evaporated. After the evaporation, the powder catalyst was dried at 100°C for 24 hr. In the case of the nickel(II)-oxide catalyst, calculated amount of NiO was dissolved in acetone and the suspension was dropped onto a Si-sheet.
In this study, catalytic chemical vapor deposition (CCVD) method was applied to synthesize nitrogen and sulfur doped multiwalled carbon nanotubes (MWCNTs). Nitrogen and hydrogen gases were passed through the reactor to maintain an inert atmosphere during the synthesis that prevents MWCNTs from oxidation at higher temperatures. The elemental nitrogen gas did not take part in the doping process itself. Therefore, acetylene gas, thiophene, and tripropylamine (TPA) were used as carbon, sulfur and nitrogen precursors, respectively. Acetylene and nitrogen gases were introduced into the system by passing through a Y-shaped junction, while the liquid- phase TPA or thiophene were added by the bubbling technique, where the gases were conducted into liquid TPA or thiophene, before the reactor, thus the gas bubbles carried the TPA or thio- phene to the reaction site (Figure 1). For more intense TPA feed, injection method using a syringe pump was also applied; for further experimental details see Szekeres et al. (2015).
In these experiments, 150 mg of catalyst was measured into a quartz boat. After 15 min of leaching, the quartz boat was placed into the oven heated up to 720°C. In the following step, after the reactor was heated, acetylene flow was set to 35 L hr–1and the MWCNT growing process started. To finalize the synthesis, the acetyleneflow rate was set to zero, and after a short-time of leaching, the reactor was cooled down to room temperature to collect the MWCNT samples. In all cases TPA or thiophene was fed into the reactor during the whole reaction time (30 min).
Preparation of MWCNT/RC Complexes RC Purification
The carotenoidless R-26 strain ofRhodobacter (Rb.) sphaeroidespurple bacterium was grown photo-heterotrophically under anaerobic conditions in a Siström-medium supplemented with
Figure 1 Schematic image of the CCVD reactor.
potassium succinate (Siström 1960). RCs were prepared by LDAO (lauryldimethilamine N-oxide, Fluka) solubilization and standard protein purification methods (ammonium sulfate precipitation, DEAE Sephacell (Sigma) column chromatography and ultrafiltration) as described previously (Maróti and Wraight 1988).
Functionalzation of MWCNTs with–COOH Group
MWCNTs were functionalized with carboxyl groups in aqueous nitric acid solution with a concentration of 10 m/m% for 1 hr. After functionalization, the samples were washed with distilled water and put in a dryer at 90°C for 2 hr.
Binding RC to MWCNTs
RC was bound to carboxyl-functionalized MWCNTs by the EDC/NHS chemistry procedure (Figure 2). Carboxyl groups of the CNT were activated by the addition of 1-[3-dimethylami- nopropyl]-3-ethyl-carbodiimide (EDC). The unstable O-acilisourea ester intermedier com- pound can be hydroliszd back to the carboxyl form or bound to the amine groups of the RCs, however, the yield of this second reaction route is very low. The addition of N-hydro- xysuccinimide (NHS) to the unstable complex an amine-active NHS-ester can be formed opening a very efficient route for the RC binding. After activation, the mixture was dialyzed in potassium phosphate buffer (0.1M, pH 7.0) to remove the unbound activators. Then, the cal- culated amount of RC solution (typically ca. 100μM) was added to the activated MWCNT and it was stirred at 4°C for 3 hr. Finally, the sample was separated and washed by an ultra- centrifuge until the steady-state absorption spectrum of the supernatant did not show the characteristic peaks of the RC in the near infrared. The reaction scheme is summarized in Figure 2.
Electron Microscopy
Each sample was characterized by transmission electron microscopy (TEM, FEI, Technai G2 20 X-TWIN, 200kV) to study their morphology, which plays a key role in the understanding of the MWCNT doping. The samples were prepared as follows:first a small amount of sample was
Figure 2 Schematic representation of binding reaction center to–COOH functionalized MWCNTs by the EDC/
NHS method. Detailed explanation is in the paragraphBinding RC to MWCNTs.
1104 T Szabó et al.
dispersed in absolute ethanol by ultrasonication (35kHz) in an ultrasonication bath (Transsonic T570/H), then a few drops of the dispersion were placed on a 200 mesh Cu TEM grid with carbon layer.
X-Ray Powder Diffractometry (XRD)
The graphitic properties of MWCNTs was investigated by XRD method (Rigaku Miniflex II Diffractometer) utilizing characteristic X-ray (Cu, Kα) radiation (angle rangeθ = 20–70°).
Raman Spectroscopy
Graphitic properties of MWCNTs were also verified by Raman spectroscopy measurements (Thermo Scientific DXR Raman microscope) using 532 nm laser excitation, 20× objective, 10 mW laser power and 15 min measuring time
Measurements of the Radiocarbon Contents
The carbon content of the samples was liberated by sealed tube combustion method. The sample and the MnO2oxidant were weighted into a glass tube. When the initial sample was in a liquid matrix it was weighted into the combustion tube and dried with the help of a freeze dryer unit. The quantity of the sample was calculated from the combustion tube with the dried sample and the empty mass of that. The tubes were evacuated to<5·10–3mbar and sealed by a torch.
The samples were combusted to CO2in a muffle furnace at 550°C for 48 hr. The gained CO2was purified using a dedicated gas handling system equipped with cryogenic traps in order to remove the other combusted gas components. The quantity of the pure CO2was determined in a known volume by high-precision pressure sensor (Janovics 2016). The yield of the carbon extraction can be calculated from the quantity of the pure CO2. The trapped and cleaned CO2 were converted to graphite by zinc reduction sealed tube graphitization method (Rinyu et al. 2013;
Orsovszki and Rinyu 2015). In the case of less than 100 micrograms carbon, zinc micro- graphitization technique was used (Rinyu et al. 2015).
The measurements of the 14C contents were carried out on a MICADAS type accelerator mass spectrometer (Synal et al. 2004, 2007) at the Institute for Nuclear Research, Debrecen, Hungary (Molnár et al. 2013). In order to track possible modern carbon contamination during the pretreatment and combustion process, we have extracted chemical standards with well-known14C activity (IAEA C7 and C8; Le Clercq et al. 1998) on the same treatment line and measured them together with the samples in the same measurement magazines. BATS AMS data evaluation software was used to treat, process, and analyze all of the 14C data (Lukas 2010).
Measurement of Stable Isotope Ratios
Stable isotopes were measured by a Thermo Finnigan DeltaPlusXP isotope ratio mass spec- trometer attached to an elemental analyzer (Fisons NA1500 NCS). This EA-IRMS method is based on the rapid oxidation of the sample byflash combustion, which converts all the organic and inorganic substances into combustion products, then the resulted gases are separated in a chromatographic column and detected by the mass spectrometer (Major et al. 2017). The measured values are expressed in delta notation like δ13C and δ15N, which delta values are defined as follows:δ(‰) = (Rsample/ Rreference– 1) × 1000, where R is the13C/12C,15N/14N ratio in the sample or in the international reference material as indicated. The uncertainty of the measurements is 0.2‰forδ13C and ±0.3‰forδ15N.
Measurement of Sulfur Content
Carbon nanotube samples were digested using a Mars 5 microwave system. 50 mg of the sample was weighted into the Teflon bombs and was digested by 2 mL 67% (m/m) nitric acid (supra- pure, VWR Chemicals). The applied power was 800 W, 200°C was reached within 20 min, and it was held for 30 min. The samples were transferred into 50 mL volumetricflasks andfilled up with ultrapure water.
The analysis of sulfur was performed by Agilent 8800 ICP-QQQ-MS system, using MS/MS mode. Chemical reaction cell (CRC) was operating with oxygen reaction gas. The sulfur was measured with mass-shift, measured on m/z 48 (cf. Equation 1):
32S++32O2=32S16O++16O (1)
RESULTS AND DISCUSSION
Structural Characterizations of MWCNTs
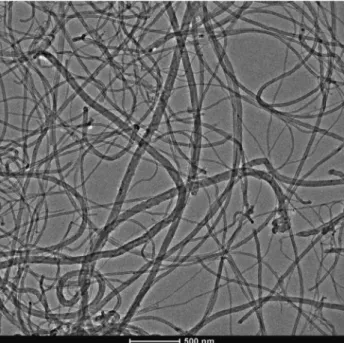
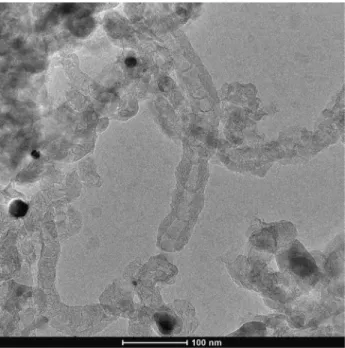
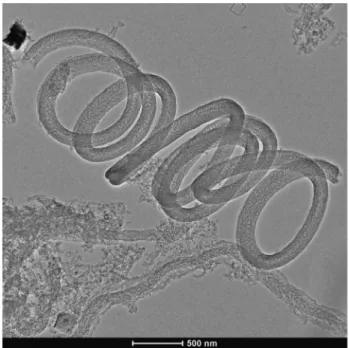
By comparing the TEM images of undoped (Figure 3), N-doped (Figure 4) and S-doped (Figure 5), morphological changes can be clearly identified. The micrograph of N-doped MWCNTs (Figure 4) revealed that the reaction product was a carbon deposit containing hol- low MWCNTs with bamboo-like segments. Different from the N-doped nanostructures, S-doped nanostructures showed a special coiled morphology, which is overall representative for the samples. The structural varieties found in the N-doped and S-doped samples can pos- sibly indicate the presence of dopants, as similar reaction conditions with different heteroatom resulted in distinct structural changes. The structural differences can result from the many forms the dopants can incorporate into the MWCNT lattice (Szekeres et al. 2015; Yang et al.
2015).
Figure 3 Representative TEM image of undoped CNTs.
1106 T Szabó et al.
Powder XRD measurements were performed to determine whether the synthesized samples possess a graphitic structure. The diffractograms in Figure 6 show the characteristic reflections of the graphitic lattice at 2θ=26.11° and 44.65°, but with different relative intensities to each other in the two datasets, which is the result of the significantly changed structures. The results, however, assure that the severe structural degeneration upon doping does not necessarily result in the loss of graphitic properties, and therefore in the exclusion of unique electrical characteristics.
Raman spectra of undoped and doped MWCNTs are shown in Figure 7. Graphitic properties are often explained by the intensity ratios of the D-band (1341 cm–1, assigned to the presence of defect sites) and the G-band (1527 cm–1, assigned to the graphitization level). The increased D-band intensity, as well as the decrement in the G-band intensity suggest that the continuous graphitic lattice is significantly corrupted in the N-doped sample. However, the presence of the G- and G’-bands indicate that the sample did not lose its overall graphitic identity, only its homogeneity—due to the altered reaction conditions caused by introducing a dopant—is lower.
Similar conclusions can be drawn from the XRD and Raman investigations of the S-doped MWCNTs.
Isotope Analytical Investigations of CNTs
Nine different types of carbon nanotubes were analyzed by isotope analytical methods and the sample identification with characteristics (Table 1) and results of stable N and C content (Tables 2 and 3) and14C content (Table 4) are summarized.
The mass spectrum of the sample nanotube is compared to the reference material of known carbon and nitrogen content and all of these calculations of weight percent determination refer to the so-called significant peak. There are samples with some nitrogen content between 2.61% and 5.3 m/m% (I/1466/9,10,13,14). The carbon content of different samples is fairly different however,
Figure 4 Representative TEM image of N-doped MWCNTs, visualizing the structural degenerations caused by the dopant, e.g. the bamboo structure.
it ranges between 33 and 67%. The samples with nitrogen content have a δ15N value between 4.25‰and 6.09‰and the stable carbon isotope results cover a wider range between–20.57‰and –29.57‰.
By using thiophene, we found that the increase of CVD synthesis temperature resulted in higher carbon deposit thus higher carbon (m/m%) (Table 2). On the other hand, increasing tempera- ture is not advantageous for the incorporation of heteroatoms into graphitic structures there through the built-in amount of sulfur is somewhat lower at 800°C.
The bubbling method used for the preparation of S-doped CNT was found to be much less effective in the synthesis of N-doped materials, while using TPA as dopant. The stable N
Figure 5 Representative TEM image of S-doped MWCNTs, showing the coiled morphology.
Figure 6 XRD diffractograms of undoped and N-doped CNTs.
1108 T Szabó et al.
content of samples 11, 12, and 15 was not detectable (see Table 2), however, TEM investigations revealed some bamboo-like character of these carbon nanotubes, too. Sample 15 demonstrated that increasing reaction temperature is not a solution for getting higher N-doping. For the
Figure 7 Raman spectra of undoped and N-doped CNTs.
Table 1 Identification and description of different types of nanotubes used for the analysis.
Sample description
Sample ID Method Liquid
Reaction time/
doping time [min] T [°C]
I/1466/1 S-dop. Bubbling Thiophene 30/30 700
I/1466/2 Bubbling Thiophene 30/30 800
I/1466/9 N-doped Injection TPA–ferrocene-acetone 10/2 720
I/1466/10 Injection TPA–ferrocene-acetone 20/5 720
I/1466/11 Bubbling TPA 40/40 720
I/1466/12 Bubbling TPA–acetone 40/40 720
I/1466/13 Injection TPA 20/5 720
I/1466/14 Injection TPA 20/10 720
I/1466/15 Bubbling TPA 40/40 750
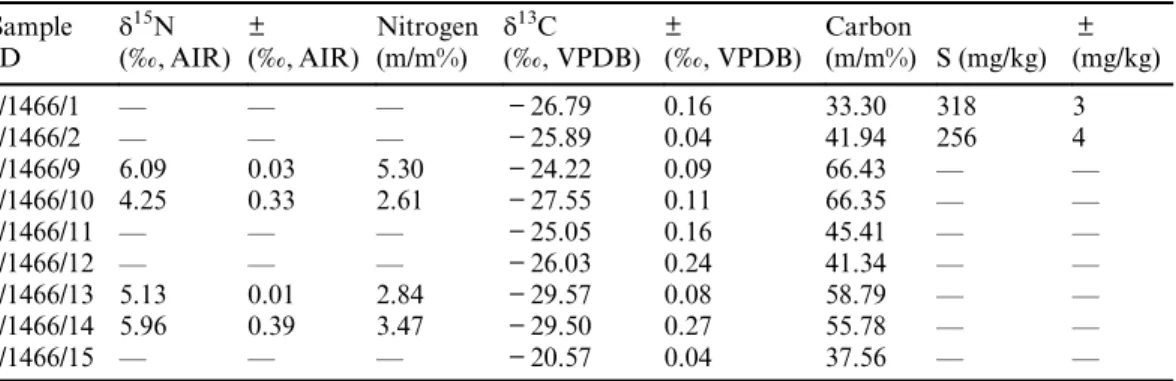
Table 2 Stable nitrogen, sulfur and carbon isotope results of investigated nanotube species.
The sample ID refers to the samples listed in Table 1.
Sample ID
δ15N (‰, AIR)
± (‰, AIR)
Nitrogen (m/m%)
δ13C (‰, VPDB)
±
(‰, VPDB)
Carbon
(m/m%) S (mg/kg)
± (mg/kg)
I/1466/1 — — — −26.79 0.16 33.30 318 3
I/1466/2 — — — −25.89 0.04 41.94 256 4
I/1466/9 6.09 0.03 5.30 −24.22 0.09 66.43 — —
I/1466/10 4.25 0.33 2.61 −27.55 0.11 66.35 — —
I/1466/11 — — — −25.05 0.16 45.41 — —
I/1466/12 — — — −26.03 0.24 41.34 — —
I/1466/13 5.13 0.01 2.84 −29.57 0.08 58.79 — —
I/1466/14 5.96 0.39 3.47 −29.50 0.27 55.78 — —
I/1466/15 — — — −20.57 0.04 37.56 — —
synthesis of sample 12 the liquid used for bubbling was changed, namely TPA was mixed with acetone (1:9 ratio), which provided better volatility. However, this modification did not result in higher N-doping either.
A reasonable explanation for this significant difference between thiophene and TPA dopants can be found in their vapor pressure values at room temperature, which differ by 2 orders of magnitude (TPA: 1.51 mmHg, thiophene: 79.7 mmHg). This experience inspired us to some- what modify our CVD setup and build a syringe pump into the system.
N-doped samples prepared with the injection technique (9, 10, 13, 14) resulted in significantly higher stable N content of CNT samples (Table 2). If we compare the N m/m% data for samples 13 and 14, we can conclude that increasing doping time from 5 to 10 min (applying 20 min reaction time) can result in a slightly higher amount of incorporated N. It is known from literary data (Yadav et al. 2005) that ferrocene is able to block the nitrogen incorporation into the carbon nanotube structure, therefore samples 9 and 10 were prepared with ferrocene feed. Stable isotope measurements also revealed that the inhibition effect of ferrocene appears only after an induction period. 2 min“TPA–ferrocene–acetone”feed is not sufficient to block nitrogen incorporation, hence the stable N content value for sample 9 is similar to that of other samples prepared by injection. Increasing ferrocene injection to 5 min, the blockage can be already detected (approx.
50% lower N-content in Table 2) which is in accordance with former EM observations.
The 14C content of the nanotubes was also examined and the results are summarized in Table 3. We did not get a valid result in two samples (I/1466/1 and 2). The combustion efficiency
Table 3 14C content of the investigated nanotubes.
The sample ID refers to the samples listed in Table 1.
Sample ID
Combustion yield (%)
14C content (pMC)
I/1466/9 56.0 18.0
I/1466/10 44.0 6.2
I/1466/11 63.0 4.0
I/1466/12 73.0 3.0
I/1466/13 59.0 13.6
I/1466/14 58.0 13.4
I/1466/15 33.0 34.1
Table 4 Summary of data obtained during determination of the14C quantity. Siström medium is the growing medium of the bacteria (see Materials and Methods), RC is reaction center protein, f-MWCNTCOOHis the–COOH functionalized I/1466/11 sample, and f-MWCNTCOOH/RC is the carbon nanotube/reaction center nanocomposite, respectively.
Sample
Sample quantity (mg)
Measured carbon (mg)
Yield
(%) pMC
Siström-medium 9.93 2.07 21% 31.9 ± 0.5
RC 2.78 1.49 54% 66.1 ± 0.3
f-MWCNTCOOH 1.15 0.85 74% 6.4 ± 0.1
f-MWCNTCOOH/RC 0.39 0.28 73% 29.1 ± 0.1
FRC 38.0 ± 2.0%
1110 T Szabó et al.
fluctuates significantly for the different samples. It seems that this efficiency is highly dependent on the carbon content of the sample, which is determined by the applied carriers and precursors.
Results indicate that the14C content of the nanotubes produced by the various preparation modes varies widely (from 3.0 pMC up to 34.1 pMC). Isotopic analytical studies have shown that the used starting materials, precursors and carriers have a strong influence on the characteristics of the produced nanotubes. For binding studies, it is important for the14C content of the nanotube and the protein has to be significantly different. As the 14C content of the investigated protein is determined by the carbon source from which the protein is developed, one aspect was the selection of those nanotube types, which have the lowest radiocarbon content (regardless of the yield of the combustion) during the analysis. Eventually, the two sample candidates for further investigations were I/1466/11 and I/1466/12 (cf. Table 3). We used I/1466/11 for nanocomposit preparation. Low
14C content of the nano-tube is required in order to better determination of 14C concentration change caused by reaction center complex binding (which is recent). This can be used to more accurately determine the bonded RC ratio. In order to bind RCs to the surface of the carbon nanotubefirst we functionalized the nanotube with -COOH groups (see Materials and Methods).
Measurements on MWCNT/RC Hybrid System
For preparing MWCNT/RC biohybrid system MWCNTs functionalized by –COOH groups were used, hereafter referred as f-MWCNTCOOH. In order to determine the absolute quantity of the RC in the f-MWCNTCOOH/RC complex the amount of the protein bound to the f-MWCNTCOOHwas determined. For this reason, the pMC unit was determined for the RC, f-MWCNTCOOHand f-MWCNTCOOH/RC samples. We have to note that the primary carbon source of the RC is supplied by the Siström-medium (31.9 ± 0.5 pMC, cf. Table 4). Siström medium is a complete growth medium for photo-heterotrophic growth of the photosynthetic bacteria. In addition to the carbon content of potassium-succinate (the main carbon source of this medium) the recent atmospheric CO2(around 100 pMC) as secondary source can also influence the radiocarbon content of the bacterium cells. Detailed investigation of the effect of different carbon sources under the growth conditions cannot be the scope of this publication, however, it can be a matter of further investigation.
The RC fraction of the f-MWCNTCOOH/RC complex is obtained by14C balance equation.14C content of the two-component mixture is defined as Equation 2:
pMCf-MWCNTCOOH=RC=FRCpMCRC+ð1-FRCÞ pMCf-MWCNTCOOH (2)
where pMCRC, pMCf-MWCNTCOOH
and pMCf-MWCNTCOOH
/RCis the measured14C content of the RC, f-MWCNTCOOH and f-MWCNTCOOH/RC complex, respectively. FRC is the RC fraction of the14C content of the f-MWCNTCOOH/RC complex. The RC fraction of the mix- ture is obtained after the rearrangement of14C balance equation (Equation 3):
FRC=pMCf-MWCNTCOOH=RC-pMCf-MWCNTCOOH
pMCRC-pMCf-MWCNTCOOH 100%: (3)
By using the data obtained during the determination of radiocarbon quantity and summarized in Table 4,FRC=38.0 ± 2.0% can be calculated. Finally, the total RC/f-MWCNTCOOHratio and the amount of RC (m/m) by the known molecular weight (MW: 80 kDa, 48% carbon content) can be calculated using the RC fraction constant and the carbon extraction yields of the appropriate components. Carbon content was estimated by the RC structure of 2WX5.pdb deposited in Brookhaven Protein Data Bank (https://www.rcsb.org/pdb/home/home.do) after
omitting the water molecules. The calculated amount of the photosynthetic reaction center bound to MWCNTs found 53 m/m% RC when the protein bound by the EDC-NHS chemical binding method.
CONCLUSIONS
In summary, we can conclude that by applying a specific change in the element composition of the precursors during NWCNT synthesis specific doping can be achieved, for example N and S can be inserted in the CNT structure. The yield of the doping was proved by the isotope analytical investigations. Doping the MWCNTs by N and S resulted in specific structural changes with the appearance of “bamboo-like” or spiral structures, respectively.
The isotope constitution of bio hybrid materials prepared from the bare and/or doped carrier CNTs and enzymes proved that isotope analytics is a useful tool for determining the quanti- tative binding of the biological materials to the carrier matrices. After determining the quantitative amount of the enzyme the specific activity of the sample can be determined. The amount of the photosynthetic reaction center bound to MWCNTs can be determined in a sensitive way and found 53 m/m% RC when the protein bound by the EDC-NHS chemical binding method.
ACKNOWLEDGMENTS
The research was supported by the European Union and the State of Hungary, co-financed by the European Regional Development Fund in the project of GINOP-2.3.2.-15-2016- 00009“ICER”and from the National Research, Development and Innovation (NKFI) Fund (OTKA PD116739), and K.N. acknowledges thefinancial support of OTKA NN114463 REFERENCES
Bhushan B. 2004. Handbook of Nanotechnology.
Berlin: Springer.
Carmeli I, Frolov L, Carmeli C, Richter S. 2007.
Photovoltaic activity of photosystem I-based self- assembled monolayer.Journal of American Chem.
Soc.129:12352–3.
Crespilho FN. 2013. Nanobioelectrochemistry: from Implantable Biosensors to Green Power Genera- tion. Berlin: Springer.
Darder M, Pilar Aranda P, Ruiz-Hitzky E. 2007.
Bionanocomposites: a new concept of ecological, bioinspired, and functional hybrid materials.Adv.
Mater. 19:1309–19.
Duclaux L. 2002. Review of the doping of carbon nanotubes (multiwalled and single-walled).
Carbon40(10):1751–64.
Evangelos M. 2007. Nanocomposites: stiffer by design.Nature Materials6(1):9–11.
Fábián L, Wolff EK, Oroszi L, Ormos P, Dér A. 2010.
Fast integrated optical switching by the protein bacteriorhodopsin.Appl. Phys. Lett.97:023305.
Fábián L, Heiner Z, Mero M, Kiss M, Wolff EK, Ormos P, Osvay K, Dér A. 2011. Protein-based ultrafast photonic switching. Optics Express.
19:18861–70.
Fei Z, Rodin AS, Andreev GO, Bao W, McLeod AS, Wagner M, Zhang LM, Zhao Z, Thiemens M, Dominguez G, Fogler MM, Castro Neto AH,
Lau CN, Keilmann F, Basov DN. 2012. Gate- tuning of graphene plasmons revealed by infrared nano-imaging.Nature487:82–5.
Flanagan MT, Sloper AN, Ashworth RH. 1988.
From electronic to opto-electronic biosensors:
an engineering view. Analytica Chimica Acta.
213:23–33.
Geranio L, Hommes G, Shahgaldian P, Wirth-Heller A, Pieles U, Corvini PFX. 2010.
Radio (14C)- and fluorescent-doubly labeled silica nanoparticles for biological and environ- mental toxicity assessment. Environmental Chemistry Letters8:247–51.
Gerd K. 2016.Biophotonics–Concepts to Application.
Singapore: Springer.
Giraldo JP, Landry P, Faltermeier SM, McNicholas TP, Iverson NM, Boghossian AA, Reuel NF, Hilmer AJ, Sen F, Brew JA, Strano MS. 2014.
Plant nanobionics approach to augment photo- synthesis and biochemical sensing.Nature Materials 13:400–8.
Gottselig N, Amelung W, Kirchner JW, Bol R, Eugster W, Granger SJ, Hernández-Crespo C, Herrmann F, Keizer JJ, Korkiakoski M, Laudon H, Lehner I, Löfgren S, Lohila A, Macleod CJA, Mölder M, Müller C, Nasta P, Nischwitz V, Paul-Limoges E, Pierret MC. 2017. Elemental composition of natural nanoparticles and fine
1112 T Szabó et al.
colloids in European forest stream waters and their role as phosphorus carriers. Global Biogeochemical Cycles31(10):1592–607.
Hajdu K, SzabóT, Magyar M, Bencsik G, Nemeth Z,́ Nagy K, ForróL, VáróG, Hernádi K, Nagy L.
2011. Photosynthetic reaction center protein in nanostructures.Phys. Status Solidi B248:2700–3.
Hajdu K, Gergely C, Martin M, Cloitre T, Zimányi L, Tenger K, Khoroshyy P, Palestino G, Agarwal V, Hernádi K, Németh Z, Nagy L. 2012. Porous silicon/photosynthetic reaction center hybrid nanostructure.Langmuir28:11866–73.
Hartmann V, Kothe T, Poller S, El-Mohsnawy E, Nowaczyk MM, Plumere N, Schuhmann W, Rogner M. 2014. Phys. Chem. Chem. Phys.
16:11936.
Hou S, Zhang A, Su M. 2016. Nanomaterials for Biosensing Applications.Nanomaterials6:58.
Janovics R. 2016. Development of radiocarbon-based measuring methods and their application for nuclear environmental monitoring [PhD thesis, in Hungarian]. University of Debrecen and Hun- garian Academy of Sciences Institute for Nuclear Research. https://dea.lib.unideb.hu/dea/handle/
2437/217939?locale-attribute=en.
Jones MR. 2009. The petite purple photosynthetic powerpack.Biochem Soc. Trans., 37:400–7.
Kamigaito O. 1991. What can be improved by nan- ometer composites?J. Jpn. Soc. Powder Powder Metall. 38:315–21.
Kietzke T. 2007. Recent Advances in Organic Solar Cells.
Adv. Opto Electron.Article ID 40285, 15 p.
Kim H, Osofsky M, Prokes SM, Glembocki OJ, Pique A. 2013. Optimization of Al-doped ZnO films for low-loss plasmonic materials at tele- communications wavelengths.Appl. Phys. Lett.
102:171103.
Kim J, Naik GV, Shalaev VM, Gavrilenko AV, Dondapati K, Gavrilenko VI, Prokes SM, Glem- bocki OJ, Boltasseva A. 2014. Optical properties of gallium-doped zinc oxide-a low-loss plasmonic material:first principles theory and experiment.
Phys Rev X. 3(4):041037.
Kneipp J. 2017. Interrogating cells, tissues, and living animals with new generations of surface-enhanced Raman scattering probes and labels.ACS Nano.
11(2):1136–41.
Le Clercq M, van der Plicht J, Gröning M. 1998. New
14C reference materials with activities of 15 and 50 pMC.Radiocarbon40(1):295–7.
Lee CW, Kim OY, Lee JY. 2014. Organic materials for organic electronic devices.J. Ind. Eng. Chem.
20:1198–208.
Li S, Singh J, Li H, Ipsita A, Banerjee IA. 2011.
Biosensor Nanomaterials. Wiley-VCH Verlag GmbH & Co. KgaA.
Liu S, Li GZ, Gao YY, Xiao ZR, Zhang JF, Wang QF, Zhang XW, Wang L. 2017. Doping carbon nanotubes with N, S, and B for electrocatalytic oxygen reduction: a systematic investigation on
single, double, and triple doped modes.Catalysis Science & Technology7(18):4007–16.
Magyar M, Hajdu K, Szabó T, Endrődi B, Hernádi K, Horváth E, Magrez A, Forró L, Visy C, Nagy L.
2013. Sensing hydrogen peroxide by carbon nano- tube/horse radish peroxidase bio-nanocomposite.
Phys. Status Solidi B250:2559–63.
Major I, Gyökös B, Túri M, Futó I, Filep Á, Hoffer A, Furu E, Jull AJT, Molnár M. 2017.
Evaluation of an automated EA-IRMS method for total carbon analysis of atmospheric aerosol at HEKAL.Journal of Atmospheric Chemistry 75(1):85–96.
Maróti P, Wraight CA. 1988. Flash-induced H+
binding by bacterial photosynthetic reaction centers: Comparison of spectrophotometric and conductimetric methods. Biochim Biophys Acta.
934:314–28.
Molnár M, Rinyu L, Veres M, Seiler M, Wacker L, Synal HA. 2013. EnvironMICADAS: A mini14C AMS with enhanced gas ion source interface in the Hertelendi Laboratory on Environmental Studies (HEKAL).Radiocarbon55(2):338–44.
Nagy L, Hajdu K, Fisher B, Hernádi K, Nagy K, Vincze J. 2010. Photosynthetic reaction centres− from basic research to application possibilities.
Not. Sci. Biol.2:7–13.
Nagy L, Magyar M, Szabo T, Hajdu K, Giotta L, Dorogi M, Milano F. 2014. Photosynthetic machineries in nano-systems. Current Protein &
Peptide Science15:363–73.
Nemeth K, Kovacs L, Reti B, Belina K, Hernadi K.
2017. The synthesis and investigation of SiO2- MgO coated multiwalled carbon nanotube/poly- mer composites. Journal of Nanoscience and Nanotechnology17(8):5445–52.
Orsovszki G, Rinyu L. 2015. Flame-sealed tube gra- phitization using zinc as the sole reduction agent:
Precision improvement of EnvironMICADAS
14C measurements on graphite targets. Radio- carbon57(3):979–90.
Rinyu L, Molnár M, Major I, Nagy T, Veres M, Kimák Á, Wacker L, Synal HA. 2013. Optimiza- tion of sealed tube graphitization method for environmental 14C studies using MICADAS.
Nuclear Instruments and Methods in Physics Research B294:270–5.
Rinyu L, Orsovszki G, Futó I, Veres M, Molnár M.
2015. Application of zinc sealed tube graphitiza- tion on sub-milligram samples using Envi- ronMICADAS.Nuclear Instruments and Methods in Physics Research B361:406–13.
Roig JL, Gómez-Vallejo V, Gibson PN. 2016.Iso- topes in Nanoparticles: Fundamentals and Appli- cations. Singapore: Pan Stanford Publishing.
Ruiz-Hitzky E, Darder M, Aranda P. 2010. Progress in bionanocomposite materials. In: Cao G, Zhang Q, Brinker CJ, editors.Annual Review of Nanoresearch. Singapore: World Scientific Pub- lishing. p 149–89.
Scholes GD, Fleming GR, Olaya-Castro A, van Grondelle R. 2011. Lessons from nature about solar light harvesting.Nature Chem. 3:763–74.
Sharma A, Dasgupta K, Patwardhan A, Joshi J. 2017.
Kinetic study of nitrogen doped carbon nanotubes in a fixed bed. Chemical Engineering Science 170:756–66.
Shoseyov O, Levy I. 2008.Nanobiotechnology: Bio- inspired Devices and Materials of the Future.
Totowa: Humana Press.
Siström WR. 1960. A requirement for sodium in the growth ofRhodopseudomonas spheroides. J Gen Microbiol. 22:778–85.
Synal HA, Döbeli M, Jacob S, Stocker M, Suter M.
2004. Radiocarbon AMS towards its lower- energy limits.Nuclear Instruments and Methods in Physics Research B223–224:339–45.
Synal HA, Stocker M, Suter M. 2007. MICADAS: A new compact radiocarbon AMS system.Nuclear Instruments and Methods in Physics Research B 259:7–13.
Szabó T, Nyerki E, Tóth T, CsekőR, Magyar M, Hor- váth E, Hernádi K, Endrődi B, Visy Cs, Forró L, Nagy L. 2015. Generating photocurrent by nano- composites based on photosynthetic reaction centre protein.Phys. Status SolidiB252(11):2614–19.
Szabó T, Csekő R, Hajdu K, Nagy K, Sipos O, Galajda P, Garab Gy, Nagy L. 2017. Sensing photosynthetic herbicides in an electrochemical flow cell.Photosynth. Res. 132(2):127–34.
Szabó T, Nyerki E, Tóth T, CsekőR, Magyar M, Horváth E, Hernádi K, Endrődi B, Visy C, Forró L, Nagy L. 2015a. Generating photo- current by nanocomposites based on photo- synthetic reaction centre protein. Phys. Status Solidi B252:2614–19.
Szabó T, Magyar M, Hajdu K, Dorogi M, Nyerki E, Tóth T, Lingvay M, Garab G, Hernádi K, Nagy L. 2015b. Structural and functional hier- archy in photosynthetic energy conversion— from molecules to nanostructures. Nanoscale Research Letters10:458–70.
Szekeres GP, Nemeth K, Kinka A, Magyar M, Reti B.
2015. Controlled nitrogen doping and carboxyl functionalization of multi-walled carbon nano- tubes.Phys. Status Solidi B252(11):2472–8.
Wilson BC, Tuchin VV, Tanev S. 2005.Advances in Biophotonics. NATO Science Series: Life &
Behavioural Sciences.
Wolf EL, editor. 2004. Nanophysics and Nano- technology: An Introduction to Modern Concepts in Nanoscience. Weinheim: Wiley-VCH.
Wong MH, Giraldo JP, Kwak S-Y, Koman VB, Sinclair R, Lew TTS, Gili Bisker, Pingwei Liu P, Strano MS. 2017. Nitroaromatic detection and infrared communication from wild-type plants using plant nanobionics. Nature Materials 16:264–72.
Yadav RM, Shripathi T, Srivastava A, Srivastava ON. 2005. Effect of ferrocene concentration on the synthesis of bamboo-shaped carbon-nitrogen nanotube bundles. J Nanosci Nanotechnol5(5):
820–4.
Yang Z, Dai Y, Wang S, Chenga H, Yu J. 2015. In situ incorporation of a S, N doped carbon/sulfur composite for lithium sulfur batteries. RSC Advances5:78017–25.
Yedra L, Eswara S, Dowsett D, Wirtz T. 2016. In-situ isotopic analysis at nanoscale using parallel ion electron spectrometry: a powerful new paradigm for correlative microscopy. Scientific Reports 6:28705.
1114 T Szabó et al.