RESEARCH
Circulating microRNAs as minimal residual disease biomarkers in childhood acute
lymphoblastic leukemia
Andrea Rzepiel1, Nóra Kutszegi1,2, András Gézsi3,4, Judit C. Sági2, Bálint Egyed1,2, György Péter5, Henriett Butz6, Gábor Nyírő7, Judit Müller1, Gábor T. Kovács1, Csaba Szalai2,5, Ágnes F. Semsei2 and Dániel J. Erdélyi1*
Abstract
Background: Treatment stratification based on bone marrow minimal residual disease (MRD) at set time points has resulted in considerably improved survival in pediatric acute lymphoblastic leukemia (ALL). Treatment response is assessed using bone marrow samples. MicroRNAs (miRs) easily traffic among fluid spaces and are more stable than most other RNA classes. We examined the role of circulating miRs as putative less invasive MRD biomarkers.
Methods: In an exploratory experiment, expression of 46 preselected miRs was studied in platelet-free blood plasma samples of 15 de novo, 5 relapsed ALL patients and 10 controls by Custom TaqMan Array Advanced MicroRNA Card.
Based on their high expression in ALL compared to controls, and on the reduction observed along the induction therapy, four miRs were selected for further analyses: miR-128-3p, -181a-5p, -181b-5p and 222-3p. Their expression was measured by qPCR at 4 time points in 27 de novo ALL patients treated in the ALL IC-BFM 2009 study.
Results: The expression of all 4 miRs significantly decreased over the first week of therapy (miR-128-3p: log2 fold change − 2.86; adjusted p 3.6 × 10⁻⁷; miR-181b-5p: log2 fold change − 1.75; adjusted p 1.48 × 10⁻²; miR-181a-5p: log2 fold change -1.33; adjusted p 3.12 × 10⁻²; miR-222-3p: log2 fold change − 1.25; adjusted p 1.66 × 10⁻²). However, no significant further reduction in miR expression was found after the 8th day of therapy. Measured drop in expression of 2 miRs at day 8 strongly correlated with day 15 bone marrow flow cytometry MRD results (miR-128-3p: Pearson’s r = 0.88, adjusted p = 2.71 × 10⁻⁴; miR-222-3p: r = 0.81, adjusted p = 2.99 × 10⁻³).
Conclusion: In conclusion, these circulating miRs might act as biomarkers of residual leukemia. MiR-128-3p and miR- 222-3p in blood predict day 15 flow cytometry MRD results 7 days earlier. Although, their sensitivity falls behind that of bone marrow flow cytometry MRD at day 15.
Keywords: MicroRNA, Biomarker, Pediatric acute lymphoblastic leukemia, Minimal residual disease
© The Author(s) 2019. This article is distributed under the terms of the Creative Commons Attribution 4.0 International License (http://creat iveco mmons .org/licen ses/by/4.0/), which permits unrestricted use, distribution, and reproduction in any medium, provided you give appropriate credit to the original author(s) and the source, provide a link to the Creative Commons license, and indicate if changes were made. The Creative Commons Public Domain Dedication waiver (http://creativecommons.org/
publicdomain/zero/1.0/) applies to the data made available in this article, unless otherwise stated.
Background
Treatment stratification based on early response to ther- apy greatly improved survival in pediatric acute lympho- blastic leukemia (ALL). Treatment response is assessed as quantified minimal residual disease (MRD) in bone marrow (BM) at set time points. For the last one or two decades, MRD assessment has been part of the routine
clinical practice in the developed world. Flow cytometry and/or qPCR based methods are used in various coun- tries, with sensitivities of 10−3–10−4 and 10−4–10−6, respectively [1]. Currently, application of high through- put sequencing methods are being studied to increase MRD sensitivity and to improve patient stratification [2].
Compared to individual IgH and TCR qPCR testing, next generation sequencing would also save working hours of laboratory staff. Whichever method is used, children are put under general anesthesia (GA) and undergo BM aspi- ration for MRD follow up 2–5 times following their diag- nosis. This is because if little residual leukemia is left, it
Open Access
*Correspondence: erdelyi.daniel@med.semmelweis-univ.hu
1 2nd Department of Paediatrics, Semmelweis University, Budapest, Hungary
Full list of author information is available at the end of the article
is most reliably and abundantly found in the BM [1]. GA and marrow aspiration, together with preparations and related issues (e.g. consenting, starving for anesthesia, checks, theatre lists, observations post procedure) put quite a burden on children, their families and on hospital staff.
MicroRNAs (miRs) are small non-coding RNAs, rang- ing from 19 to 25 nucleotides in size [3]. Their role is in posttranscriptional regulation of mRNA expression.
MiRs regulate about half of the human genes [4]. Bind- ing of miRs to their target sequence, with perfect com- plementarity in seed region and base paring in central region, results in mRNA cleavage and degradation. In case of less complementarity, translation repression is their typical function [5]. There are over 2000 miRs known in human [6]. The miR profile is distinct in every body fluid. In the blood, for example, platelets have a rep- ertoire of approximately 750 miRs [7, 8], with the let-7 family contributing in almost 50% [8]. MiRs can be tis- sue specific regarding their origin, or there are examples when certain miRs are expressed at specific stages of ontogenesis or specific stages of cell differentiation [9, 10].MiR profiles in normal tissues and in different diseases are intensively studied despite of numerous pitfalls [11].
MiRs are actively secreted into the extracellular space via extracellular vesicles [12]. The secreted miRs partly reflect the intracellular miR signature of the source cells, but certain miRs are withheld or selectively excreted in higher amounts [13]. Compared to mRNAs, miRs are much more stable. Some of them persist for 5 days [14, 15]. MiRs were found to be protected from RNases by encapsulation into extracellular vesicles, by complexes formed with Argonaute proteins or Nucleophosmin-1 and by their uptake into lipoproteins [16–18]. As a very universal phenomenon, malignant cells secrete higher amounts of miRs than healthy cells or tissues [19]. This, together with the selective over-secretion of some miRs, such as miR-128-3p [20–22], their easy distribution among fluid spaces and their stability makes miRs good candidates for cancer biomarkers. Indeed, very promising such results were published in solid tumors, e.g. in breast cancer and non-small cell lung cancer [23]. Some similar biomarker studies were published in leukemia, too. These focused on the miR signatures in BM, peripheral blood (PB) or plasma taken at the time of diagnosis as biomark- ers of leukemia diagnosis, leukemia subtype, with disease characteristics or predictors of prognosis [24–26].
Our aim was to evaluate circulating miRs as biomark- ers for MRD monitoring in pediatric ALL. Compared to the current practice of MRD monitoring, this approach would have the great advantage of less invasive sampling and no need for GA. Our strategy was to (1) get serial
patient plasma samples along the induction cycle pro- spectively, (2) discard platelets very early as the largest source of miRs in the blood, (3) choose miRs for analyses based on the previously described miR profile of leuke- mic BM (4) for our first analysis on an exploratory cohort with array, and (5) proceed to validation of the selected best candidate biomarkers with qPCR on an extended patient cohort.
Methods
Patients and samples
We studied 28 pediatric patients with de novo and 5 patients with 1st relapse of precursor-B cell ALL, age 1–18 years, diagnosed between 2016 and 2018 at the 2nd Department of Pediatrics, Semmelweis University or at Heim Pál Children’s Hospital, both in Budapest, Hun- gary. Informed consent was requested from legal guard- ians of the patients. The study was approved by the Ethics Committee of the Hungarian Medical Research Coun- cil (60106-1/2015/EKU and 6886/2019/EKU) and con- ducted according to the principles of the Declaration of Helsinki. De novo ALL patients from only three cytoge- netic subgroups were included: those with hyperdiploidy (blast chromosome number ≥ 47), those with t(12;21) (p13;q22) alias ETV6/RUNX1 fusion and those with no known cytogenetic abnormality (normal findings on a set FISH panel targeting frequent ALL rearrangements, found to be diploid by flow cytometry DNA index, either normal karyotype or unsuccessful karyotyping). Karyo- type of relapsed patients was not used as selection cri- teria or for grouping because of the limited number of available samples.
Peripheral blood (PB) (3.5 ml) of patients was collected at diagnosis and also at days 8, 15 and 33 of the induc- tion cycle of the ALL IC-BFM 2009 trial protocol. Bone marrow (BM) aspirates (1 ml) were collected at diagnosis before any treatment and on days 15 and 33. Blood and bone marrow samples of relapsed patients were collected only at diagnosis. In addition, control PB samples were collected from non-leukemic subjects. Control patients had one of the following conditions: vitamin D deficiency, otitis media, impetigo, hypothyreosis, neurofibromatosis type 1, iron deficiency anemia, phimosis.
Preparation of platelet-free plasma (PFP) was carried out within 2 h of sampling and was based on the recom- mendation of the International Society of Thrombosis and Haemostasis [27]. Sodium citrate tubes were used for all sample types. Samples taken at diagnosis were col- lected before any steroid or cytostatic treatment would have been started for the patient. The use of PFP was cho- sen based on the fact that platelets have a large repertoire of miRs and are the major source of miRs in plasma [28].
Whole blood and bone marrow samples were centrifuged
at 2500×g for 15 min at 16 °C. Supernatant was trans- ferred into a new centrifuge tube and centrifuged again for 15 min at 16 °C 2500×g. Supernatant was aliquoted immediately and stored at − 80 °C until use.
Clinical data were collected during the first month of therapy: white blood count at diagnosis, absolute blast number at day 8 in peripheral blood, bone marrow flow cytometry (FC) MRD at day 15, absolute white blood cell count at day 33, absolute lymphocyte count at day 33 and FC MRD at day 33. FC MRD was measured in routine diagnostics as per the standards of ALL IC-BFM 2009 study.
Detailed description of patients and samples used is provided in Table 1, 2, and 3.
RNA isolation, cDNA synthesis and miR profiling on array With the aim to find MRD biomarkers, 46 miRs were selected for analysis. Only miRs found to be overex- pressed in blasts in at least two different previously pub- lished studies were chosen (Table 4).
MiRNeasy Serum/Plasma Kit (Qiagen, Hilden, Ger- many) was used for RNA isolation from defrosted PFP samples. Synthesis of cDNA was carried out using TaqMan Advanced miRNA cDNA Synthesis Kit (Thermo Table 1 Samples analyzed on TaqMan low density array and with advanced qPCR
Sampling dates are marked as days of the induction chemotherapy cycle BM bone marrow, PB peripheral blood
a Normal karyotype: no alteration on FISH, DNA index diploid and cytogenetics normal or unsuccessful
Subgroups Discovery population Extended population
BM at Day
0 (n) PB at Day
0 (n) PB at Day
8 (n) PB at Day 33
(n) PB at Day
0 (n) PB at Day
8 (n) PB at Day 15
(n) PB at Day
33 (n) De novo ALL
Hyperdiploid 3 3 3 2 8 8 8 8
t(12;21) 6 6 3 2 9 9 9 9
Normala 6 6 3 2 10 10 10 9
Relapsed ALL 5 5
Control 10 10
SUM 20 30 9 6 37 27 27 26
Table 2 Characteristics of the population studied on custom TaqMan low density array
a Normal: no alteration on FISH, DNA index diploid and cytogenetics normal or unsuccessful
Subgroups Age in years median (range) Number of patients (n) Male (n) Female (n)
De novo ALL
Karyotype: hyperdiploid 3.1 (2.0–3.7) 3 1 2
t(12;21) 3.6 (3.1–4.6) 6 3 3
Karyotype: normala 3.1 (1.5–5.3) 6 4 2
Relapsed ALL 10.4 (6.3–18.8) 5 3 2
Total number of patients 3.9 (1.5–18.8) 20 11 9
Control 4.4 (1.6–15.1) 10 6 4
Table 3 Characteristics of the population studied by advanced qPCR method
a Normal: no alteration on FISH, DNA index diploid and cytogenetics normal or unsuccessful
Subgroups Age in years median (range) Number of patients (n) Male (n) Female (n)
De novo ALL
Karyotype: hyperdiploid 3.8 (2.0–13.7) 8 1 7
t(12;21) 3.1 (2.2–4.6) 9 6 3
Karyotype: normala 4.9 (1.5–17.3) 11 9 2
Control 4.4 (1.6–15.1) 10 6 4
Fisher Scientific, Waltham, MA, USA) according to the protocol supplied by the manufacturer.
MiR profiling of 65 PFP samples from 20 ALL patients (15 de novo and 5 relapsed ALL) and 10 control sam- ples was performed using Custom TaqMan Advanced Low Density miRNA Array (TLDA) Card (Thermo Fisher Scientific, Waltham, MA, USA). Measurements were carried out using QuantStudio 7 Flex Real-Time PCR System (Thermo Fisher Scientific, Waltham, MA, USA). GeNorm algorithm was used to calculate the gene expression stability measure for each potential reference miR, based on the average pairwise variation between all candidate reference miRs. As a validation, NormFinder algorithm was also used which takes intra- and inter- group variability into account. Based on these analyses, miR-484 was selected for normalizing, and the ΔCt value was calculated for each miR. Four samples measured in duplicates on TLDA Card and correlated very highly (Pearson’s r = 0.981 (CI 95% 0.974–0.986), p < 10−16).
Quantitative real‑time PCR
Based on the results of TLDA cards, 4 candidate miRs were selected for further investigation on an extended population using Advanced qPCR methodology. Quanti- tative Real-time PCR TaqMan Advanced miRNA assays were used according to the manufacturer’s instruction (Thermo Fisher Scientific, Waltham, MA, USA). Thermo Fisher 7900HT Fast Real-Time PCR system was used for real-time quantitative PCR measurement (Thermo Fisher Scientific, Waltham, MA, USA). PFP samples originated from peripheral blood of 28 patients with ALL and 10 controls were measured, in total 110 samples (Table 3 for details). Detection of 5 miRs (miR-181a-5p, miR-81b-5p, miR-128-3p, miR-22-3p and control miR-484) were per- formed in duplicates (correlation between duplicates was
calculated: Pearson’s r = 0.998, p < 2.2*10−16). Correlation between Advanced qPCR and TLDA measurements was:
Pearson’s r = 0.873, p = 3.19*10−44. Statistical analysis
All statistical analyses were performed using R statisti- cal software (R Foundation for Statistical Computing, Vienna, Austria; version 3.5.1). To select suitable ref- erence miRs for normalization, the geNorm and Nor- mFinder algorithms of the NormqPCR [41] package was used. Statistical differential expression of miRs was determined by the Limma [42] package. For that, a linear model was fitted for each gene based on the subgroup of the patients or the different sampling times. The gender of the patients was used as a coefficient in both cases.
Then, moderated t-statistics and log-odds of differential expression were calculated by empirical Bayes modera- tion of the standard errors towards a common value. The resulting p-values obtained were corrected for multiple testing using the Benjamini–Hochberg procedure. Genes were considered to be differentially expressed when the adjusted p-value false discovery rate was below 0.05.
Pearson correlation coefficients were calculated to evalu- ate the correlation between the flow cytometry MRD results and the log2 transformed expression level or fold change of miRs, respectively. In order to deal with multi- ple comparisons, the p-values were adjusted by the Ben- jamini–Hochberg false discovery rate method with type I error rate of 5%.
Results
MiR expression pattern of the exploratory cohort on array Expressions of 46 selected miRs were measured in PFP samples of de novo and relapsed pediatric precursor- B acute lymphoblastic leukemia patients and controls Table 4 The 46 microRNAs selected for custom TaqMan low density array
MicroRNA Field of research References
Cel-miR-39 Exogenous, spike-in control [29, 30]
miR-103a-3p, miR-638 miR-484, miR-30d-5p, miR-16-5p Candidate reference microRNAs [31–33]
let-7a-5p, let-7f-5p Platelet origin microRNAs [8]
miR-128-3p, miR-181b-5p Bone marrow cells [34, 35]
miR-222-3p, miR-223-3p, miR-361-3p, miR-374a-5p, miR-501-5p, miR-511-5p, miR-532-5p, miR-
660-5p, miR-98-5p Hyperdiploid ALL [36]
miR-20a-5p, miR-93-5p Different ALL cell lines [37]
miR-100-5p, miR-125b-5p, miR-126-3p, miR-320a, miR-383-5p, miR-494-3p, miR-629-5p, miR-99a-5p t(12;21) ALL [31, 35, 36, 38]
miR-17-5p, miR-181a-5p, miR-181b-5p, miR-181c-5p, miR-320a, miR-342-3p, miR-106a-5p, miR-1290 Relapsed ALL [34, 35, 38–40]
miR-146a-5p, miR-155-5p, miR-222-3p, miR-34a-5p, miR-511-5p, miR-99a-5p Circulating microRNAs in
pre-B ALL [31]
miR-632, miR-654-5p T and dendritic cell lines [18]
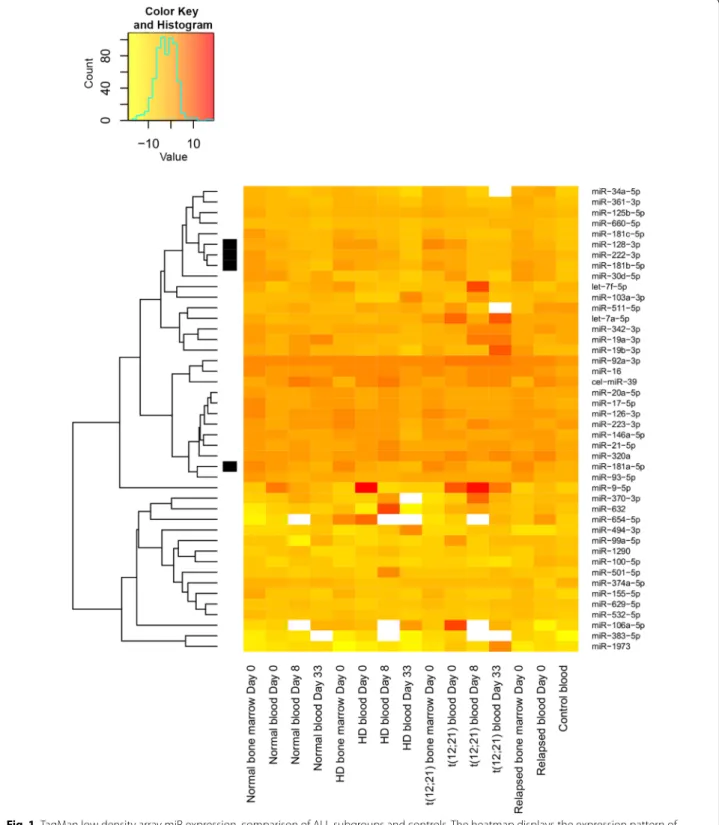
Fig. 1 TaqMan low density array miR expression, comparison of ALL subgroups and controls. The heatmap displays the expression pattern of microRNAs measured in platelet-free plasma derived from bone marrow and peripheral blood samples of pediatric ALL patients. The horizontal axis shows the origin of samples in different subgroups (normal karyotype: no alteration on FISH, DNA index diploid and cytogenetics normal or unsuccessful; HD: hyperdiploid subgroup), the day of sampling in relation to start of treatment. The vertical axis shows the 44 previously selected microRNA repertoire. miR-484 was used as normalizing miR. Expression of further 2 miRs was not detected in any samples. The scale shows the normalized log2 transformed expression levels. Yellow indicates microRNA down-expression, red indicates overexpression compared to the normalizing miR
on custom TaqMan low density array (TLDA). See the results illustrated in Figs. 1, 2, and 3. There was no sig- nificant correlation between miR expressions of the bone marrow and the peripheral blood (adjusted p > 0.05, data not shown).
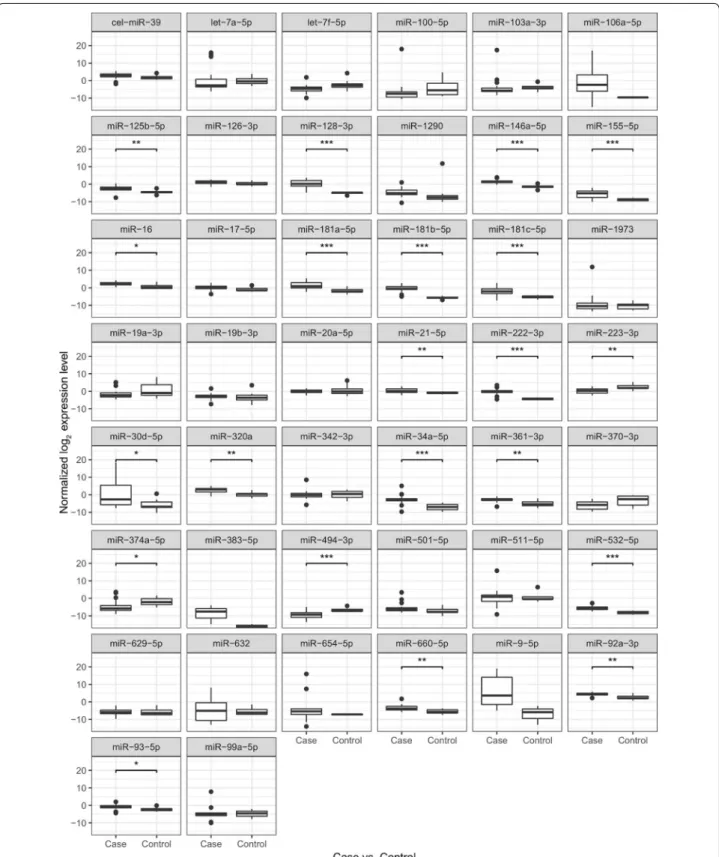
The expressions of 19 miRs in ALL PB PFP at diagno- sis were significantly different compared to the control samples (p < 0.05). In line with our selection criteria, 18 miRs showed higher expression, while one miR showed downregulation in leukemic patients (Fig. 2). Different karyotype (hyperdiploid, t(12, 21), normal) subgroups were separately compared to the control PFP samples.
Five miRs were significantly upregulated in every sub- group: miR-128-3p, miR-146a-5p, miR-181b-5p, miR- 222-3p and miR-532-5p (p < 0.05). There was no unique miR expression pattern in subgroups of patients based on our TLDA measurements. Platelet originated miRs (let- 7a-5p and let-7f-5p) were not significantly upregulated or downregulated compared to the control samples.
When miR expression differences were analysed between day 0 and day 33 of therapy in PB PFP, 4 miRs showed significantly lower expression at day 33: miR- 128-3p, miR-181a-5p, miR-181b-5p, miR-222-3p. These 4 miRs were further investigated by Advanced qPCR on the extended cohort.
MiR expression pattern of the extended cohort by advanced qPCR
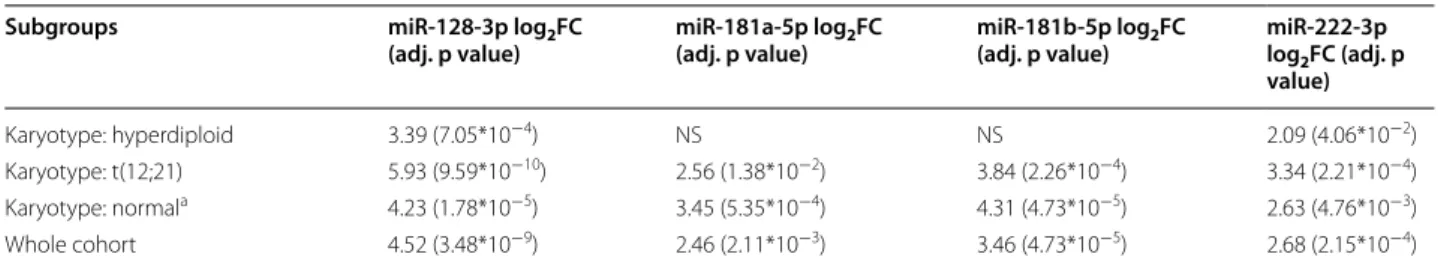
Relative expression levels of the 4 selected miRs were first compared between ALL day 0 PB PFP samples and PB PFP of non-leukemic controls. ALL subgroups of differ- ent karyotypes were examined separately as well as the whole ALL group (Table 5).
Changes of PB PFP miR expression along the induction cycle were analyzed in paired tests. Higher expression of all 4 miRs identified on TLDA (miR-128-3p, miR- 181a-5p, miR-181b-5p and miR-222-3p), was validated in the extended study population.
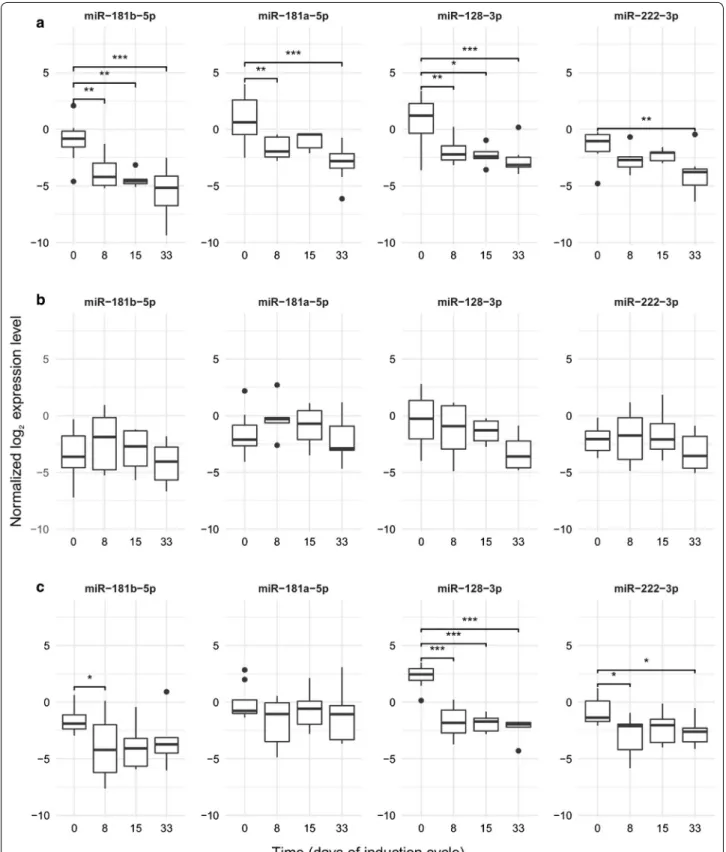
Measured by qPCR in this larger cohort, the expression of all four miRs decreased significantly after the start of treatment. However, no further significant drop could be demonstrated after day 8 with regards to any of the miRs (Fig. 4; Table 6). This question was also explored in the three ALL cytogenetic subgroups separately, and simi- lar trends were found (Fig. 5). The best correlations and tendencies were seen with miR-181b-5p, miR-128-3p expression within the normal karyotype group, but no significant change was found after day 8 in any karyotype subgroup or any miR.
Association of miR qPCR results with other MRD methods and prognostic factors
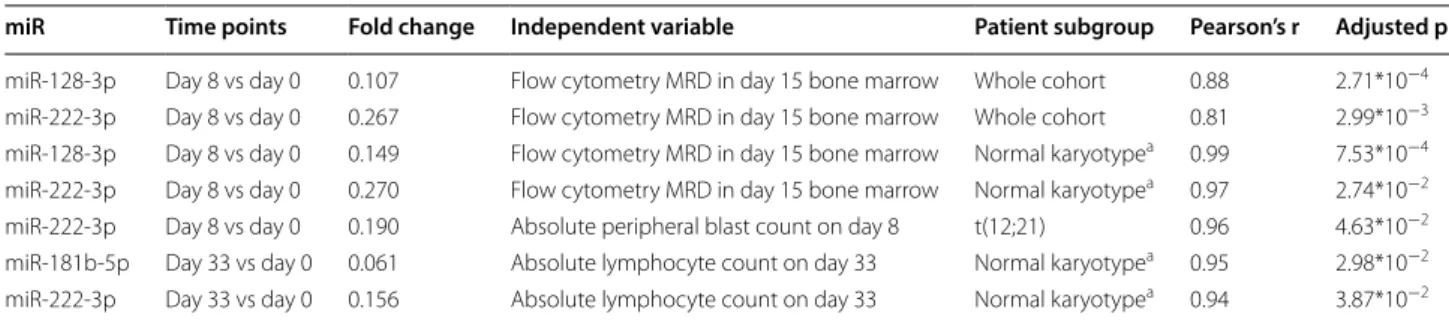
In order to further examine the value of the 4 selected miRs as MRD biomarkers, we tested their associations with results of other MRD measurement methods and with various risk factors: induction day 15 bone mar- row flow cytometry MRD (the gold standard method to measure early treatment response in ALL-IC studies), day 8 absolute blast count in peripheral blood film by microscopic cytomorphology (also recorded in the ALL- IC and BFM studies), risk group stratification (based on age, initial white blood cell count (WBC), cytogenetics and early treatment response as per ALL-IC 2009) as well as end of induction absolute lymphocyte count (recently suggested as a prognostic marker) [43, 44]. All these questions were analyzed in the whole ALL group and in cytogenetic subgroups. See the significant associations highlighted in Table 7 and further results and details in Additional file 1.
All patients were MRD negative on day 33 bone mar- row flow cytometry, hence this association could not be analyzed. To test if the blood WBC influences PB PFP miR expression causing bias, we checked this association on day 0 and day 33 and found no correlation.
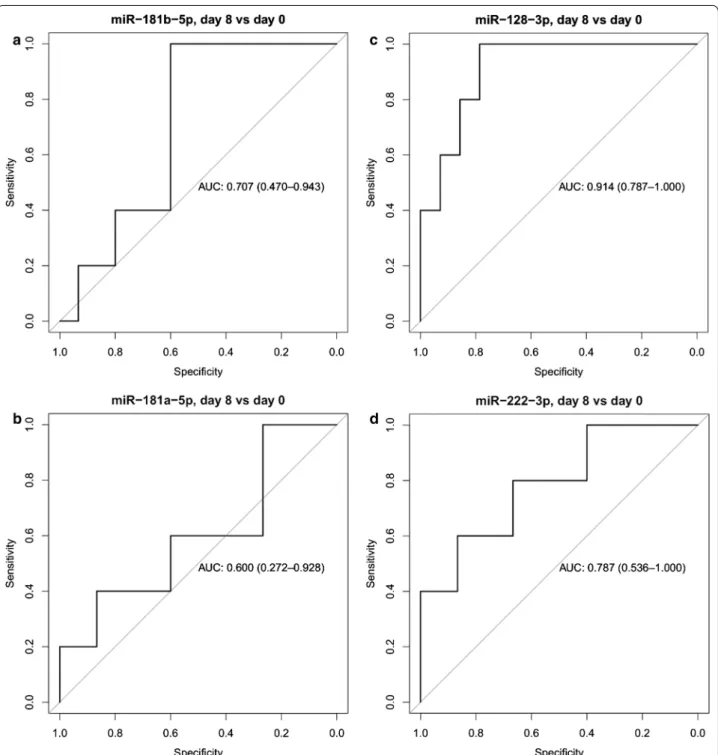
The predictive accuracy of microRNAs to differenti- ate patients with high MRD (defined as induction day 15 bone marrow flow cytometry MRD greater than 1%) ver- sus low MRD (< 1%) was also assessed by ROC analysis and by calculating the area under the receiver operating characteristic curve (AUC). MiR-128-3p had the high- est predictive accuracy (AUC = 0.91) and miR-222-3p showed also high predictive accuracy (AUC = 0.79) (Fig. 6). See the full result set of ROC analyses in Addi- tional file 2.
Discussion
We hypothesized that circulating miRs may be used as biomarkers of residual leukemia with the advantage of less invasive sampling for follow-up, compared to bone marrow aspirate based tests in present practice. We focused on pediatric precursor-B cell ALL patients.
Platelet-free plasma (PFP) derived from peripheral blood (PB) was chosen for analyses. In the first step, 46 candidate miRs were examined on a discovery popula- tion of de novo plus relapsed ALL patients and controls.
Four miRs were selected for further analyses based on higher expression compared to controls and based on their decreasing expression by the end of induction: miR- 128-3p, miR-181a-5p, miR-181b-5p and miR-222-3p.
These four miRs were then tested by advanced qPCR at 4 time points along the induction cycle of an extended cohort of de novo ALL patients. Over the first week,
Fig. 2 MiR expression pattern in ALL and control PB PFP samples measured by TLDA. Case indicates de novo and relapsed ALL day 0 PB PFP samples, control indicates non-leukemic PB PFP samples. Data obtained on TLDA measurements. Box: the 2nd and 3rd quartiles; thick line in the box: median;
lower whiskers: minimal value if there are no low outrange values, or Q1 − 1.5*IQR; upper whiskers: maximum value if there is no upper outlier, or Q3 + 1.5*IQR; dots: outliners, lines above the boxes: significant correlation (p < 0.05); ***p value: 0–0.001; **p value: 0.001–0.01; *p value: 0.01–0.05
Fig. 3 MiR expression in de novo and relapsed ALL PB PFP at the day of diagnosis (by TLDA). Box: the 2nd and 3rd quartiles; thick line in the box:
median; lower whiskers: minimal value if there are no low outrange values, or Q1 − 1.5*IQR; upper whiskers: maximum value if there is no upper outlier, or Q3 + 1.5. No significant differences were found
the expression of all four miRs dropped significantly but there was no relevant further decrease at later time points. Correlation of miR expression with standard MRD results and risk factors could be demonstrated. On
ROC analyses, the drop of normalized miR expression (day 8 or day 15 compared to day 0) performed better than the normalized expressions themselves at any given time points. Day 8 miR expressions performed somewhat Table 5 miR expressions in diagnostic ALL samples compared to controls (PB PFP samples, advanced qPCR results)
Values in the table indicate the average log2 fold change between cases and controls NS no significant correlation
a Normal karyotype: no alteration on FISH, DNA index diploid and cytogenetics normal or unsuccessful
Subgroups miR‑128‑3p log2FC
(adj. p value) miR‑181a‑5p log2FC
(adj. p value) miR‑181b‑5p log2FC
(adj. p value) miR‑222‑3p log2FC (adj. p value)
Karyotype: hyperdiploid 3.39 (7.05*10−4) NS NS 2.09 (4.06*10−2)
Karyotype: t(12;21) 5.93 (9.59*10−10) 2.56 (1.38*10−2) 3.84 (2.26*10−4) 3.34 (2.21*10−4) Karyotype: normala 4.23 (1.78*10−5) 3.45 (5.35*10−4) 4.31 (4.73*10−5) 2.63 (4.76*10−3)
Whole cohort 4.52 (3.48*10−9) 2.46 (2.11*10−3) 3.46 (4.73*10−5) 2.68 (2.15*10−4)
Fig. 4 MiR expressions in PB PFP during the first month of therapy (by TaqMan Advanced qPCR). Box: the 2nd and 3rd quartiles; thick line in the box: median; whiskers: minimum and maximum values if there are no outrange values, or Q1 − 1.5*IQR; dots: outliers, lines above the boxes:
significant correlation (p < 0.05); ***p value: 0 ≤ p < 0.001, **p value: 0.001 ≤ p < 0.01, *p value: 0.01 ≤ p < 0.05
better than day 15 miR expressions. After all, the day 0 to day 8 change in normalized expression of miR-128-3p and miR-181b-5p came out as best MRD-biomarkers.
To summarize our results, the selected circulating miRs can indeed be used as biomarkers of residual leukemia burden but are less sensitive than the day 15 bone mar- row flow cytometry MRD measurement, the standard response measurement in ALL-IC. We know it from flow cytometry (as well as IgH and TCR based qPCR) MRD measurements that in reality, a monotonous multiple-log reduction occurs in the bone marrow blast percentage from day 0, through day 8 and day 15 to day 33 along the induction cycle [45–47]. By blood PFP miR measurement in our study, only a day 0 to day 8 reduction could be demonstrated. The most plausible explanation is that the overexpression of miRs originated from residual leuke- mic cells is measurable in the blood plasma but the noise (baseline miR expressions and their variability) is too high to allow for a sensitive leukemia follow-up. Indeed, the expression of the same miRs could be detected in the serum of healthy adults [48]. It is difficult to tell what this background noise is related to. The general understand- ing about miRs is that these participate in many regula- tion pathways in normal physiology. In microRNA Target Prediction Database (miRDB.org), an online database miR-128-3p has 1254 predicted targets while miR-222-3p has 619, miR-181a-5p and miR-181b-5p have 1408 pre- dicted targets [49].
Our results are in parallel with findings of multiple studies which examined miR expression in leukemic cells [3, 34, 35, 50–55]. In these studies, miRs were extracted from whole bone marrow or from whole blood of pedi- atric- or partly pediatric-ALL patients, from mononu- clear cells separated of the above samples, or from ALL cell lines. Very different sets of miRs were investigated, all partially overlapping with our selection. The 4 miRs chosen in our study were unanimously described as being overexpressed in ALL blasts. The reported rate of overex- pression compared to healthy controls or to ALL patients in remission spread between 1.3 and 500 times, with very diverse normalizing RNAs used. The findings supported by most evidence are the overexpression of miR-128 and miR-181-family members. Many other overexpressed miRs were reported in ALL, e.g. let-7b, miR-222, miR- 181b [31, 34].
Among the cellular miR studies, some reported dif- ferent miR expression patterns in ALL cytogenetic sub- groups [31, 35, 36, 50], which could not be demonstrated in our present study in PFP. Interestingly, authors disa- gree if the miR expression pattern of bone marrow and peripheral blood are similar [50, 51] or different [52] in intrapersonal comparisons. We did not find strong corre- lation between marrow PFP and blood PFP miR expres- sions in our TLDA results (adjusted p > 0.05, data not shown).
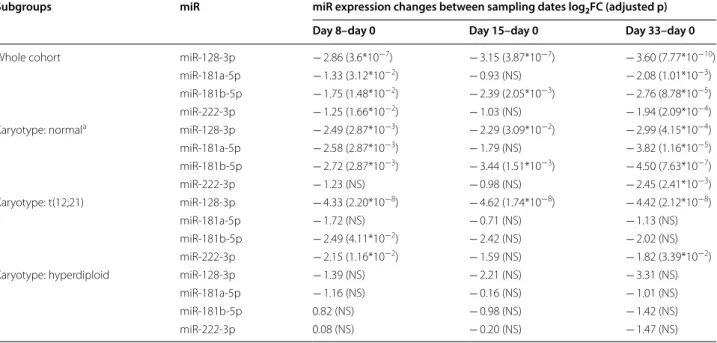
Table 6 miR expression changes in peripheral blood PFP during the 1st month of chemotherapy
NS no significant correlation
a Normal karyotype: no alteration on FISH, DNA index diploid and cytogenetics normal or unsuccessful
Subgroups miR miR expression changes between sampling dates log2FC (adjusted p)
Day 8–day 0 Day 15–day 0 Day 33–day 0
Whole cohort miR-128-3p − 2.86 (3.6*10−7) − 3.15 (3.87*10−7) − 3.60 (7.77*10−10)
miR-181a-5p − 1.33 (3.12*10−2) − 0.93 (NS) − 2.08 (1.01*10−3)
miR-181b-5p − 1.75 (1.48*10−2) − 2.39 (2.05*10−3) − 2.76 (8.78*10−5)
miR-222-3p − 1.25 (1.66*10−2) − 1.03 (NS) − 1.94 (2.09*10−4)
Karyotype: normala miR-128-3p − 2.49 (2.87*10−3) − 2.29 (3.09*10−2) − 2.99 (4.15*10−4)
miR-181a-5p − 2.58 (2.87*10−3) − 1.79 (NS) − 3.82 (1.16*10−5)
miR-181b-5p − 2.72 (2.87*10−3) − 3.44 (1.51*10−3) − 4.50 (7.63*10−7)
miR-222-3p − 1.23 (NS) − 0.98 (NS) − 2.45 (2.41*10−3)
Karyotype: t(12;21) miR-128-3p − 4.33 (2.20*10−8) − 4.62 (1.74*10−8) − 4.42 (2.12*10−8)
miR-181a-5p − 1.72 (NS) − 0.71 (NS) − 1.13 (NS)
miR-181b-5p − 2.49 (4.11*10−2) − 2.42 (NS) − 2.02 (NS)
miR-222-3p − 2.15 (1.16*10−2) − 1.59 (NS) − 1.82 (3.39*10−2)
Karyotype: hyperdiploid miR-128-3p − 1.39 (NS) − 2.21 (NS) − 3.31 (NS)
miR-181a-5p − 1.16 (NS) − 0.16 (NS) − 1.01 (NS)
miR-181b-5p 0.82 (NS) − 0.98 (NS) − 1.42 (NS)
miR-222-3p 0.08 (NS) − 0.20 (NS) − 1.47 (NS)
Fig. 5 MiR expression during the first month of the therapy in cytogenetic subgroups of ALL (by qPCR). a Normal karyotype (no alteration on FISH, DNA index diploid and cytogenetics normal or unsuccessful); b hyperdiploid subgroup; c t(12;21). Box: the 2nd and 3rd quartiles; thick line: median;
lower whiskers: minimal value if there are no low outlier values, or Q1 − 1.5*IQR; upper whiskers: maximum value if there is no upper outlier, or Q3 + 1.5*IQR; dots: outliners. Lines above the boxes: significant correlation (p < 0.05); ***p value: 0–0.001, **p value: 0.001–0.01, *p value: 0.01–0.05
Three publications are available that evaluated circu- lating miRs in pediatric ALL. These studied plasma or serum unlike our present study (PFP samples). The iden- tified miRs are different from ours and from each other, however, all three papers conclude that circulating miRs offer a very sensitive and specific diagnostic tool to differ- entiate pediatric precursor-B cell ALL cases from healthy controls [31, 56, 57]. We are not aware of any previous study which would have evaluated PFP miR expression in pediatric ALL, or would have evaluated circulating miRs as ALL MRD biomarkers. There are encouraging such publications on patient cohorts of other malignancies, though [58, 59].
Our study has special strengths when compared to other papers. A possible bias by platelets—as massive sources of circulating miRs—could be ruled out because no association of leukemia MRD and platelet originated miRs was found despite the wide range of platelet count of our patients. As no correlation could be detected between PFP miR expression levels and WBC either on day 0 (all patients with full blown ALL, before treat- ment) or day 33 (all the patients were MRD negative with bone marrow flow cytometry), we are convinced that the measured miR expressions were not primarily influenced by healthy leukocytes or blasts in the peripheral blood.
Mir-181 might contribute to leukemogenesis and relapse [35], it is the inducer of Wnt/β-catenin signaling pathway. The uncontrolled pathway causes leukemia by stimulating cell proliferation. It has been demonstrated using ALL-derived cell lines and bone marrow samples of patients with ALL that miR-181a-5p targets and inac- tivates Wnt antagonist WIF1 (Wnt inhibitory factor-1) [60].
Regarding the biology in the background, miR-128 was found to inhibit or promote tumor proliferation in several tumors and its proved target genes alter cancer-related biological processes [61]. Its expression was higher in ALL cell lines [51], in patients with poor-prognosis ALL [51], in bone marrow samples of children with ALL at diagnosis, at relapse, but not in remission [35]. Expres- sion of miR-128 decreased during therapy [51]. One of the predicted putative targets of miR-128b is BMI1, a transcriptional factor which is important in hematopoi- etic stem cells and leukemia stem-cell self-renewal [35, 61]. In silico predictions suggest that miR-128 and miR- 181 are among the major regulators of lymphoid differen- tiation. These miRs may uphold early progenitor cells at early stem-progenitor stage, prevent their further differ- entiation towards more mature cells by regulating mol- ecules having crucial role in early steps of hematopoiesis.
MiR-222, most likely, blocks hematopoietic differen- tiation at terminal stages [62]. Chromosomal location of miR-222 is close to Xp11.3 and its target is C-KIT’s 3′UTR. C-kit is a tyrosine kinase receptor with a role in cell differentiation and growth. It is expressed in hemat- opoietic stem cells and progenitor cells [63].
Lacking standards regarding normalizing miRs and only partial correlation of various PCR based methods which are widely known difficulties of RNA and miR lab methodologies contribute to the limitations of this paper.
Still, we were able to prove our points via both meth- ods applied. Our sample collection started in 2016, so it was not possible to correlate miR expressions to patient survival yet, and the cohort would also be small for that analysis. Given the candidate miR approach used, the existence of a better miR biomarker of leukemia MRD cannot be ruled out.
Table 7 Associations between miR expression changes and MRD parameters or risk factors
In these analyses, the dependent variable is the normalized miR expression change between the time points compared, all measured in PB PFP. Fold change indicates change in the normalized miR expression between the two time points, the median of these values are provided. Pearson’s r indicates the correlation between the dependent and the independent variables. Adjusted p refers to the statistical significance of the Pearson’s correlation
a Normal karyotype: no alteration on FISH, DNA index diploid and cytogenetics normal or unsuccessful
miR Time points Fold change Independent variable Patient subgroup Pearson’s r Adjusted p miR-128-3p Day 8 vs day 0 0.107 Flow cytometry MRD in day 15 bone marrow Whole cohort 0.88 2.71*10−4 miR-222-3p Day 8 vs day 0 0.267 Flow cytometry MRD in day 15 bone marrow Whole cohort 0.81 2.99*10−3 miR-128-3p Day 8 vs day 0 0.149 Flow cytometry MRD in day 15 bone marrow Normal karyotypea 0.99 7.53*10−4 miR-222-3p Day 8 vs day 0 0.270 Flow cytometry MRD in day 15 bone marrow Normal karyotypea 0.97 2.74*10−2 miR-222-3p Day 8 vs day 0 0.190 Absolute peripheral blast count on day 8 t(12;21) 0.96 4.63*10−2 miR-181b-5p Day 33 vs day 0 0.061 Absolute lymphocyte count on day 33 Normal karyotypea 0.95 2.98*10−2 miR-222-3p Day 33 vs day 0 0.156 Absolute lymphocyte count on day 33 Normal karyotypea 0.94 3.87*10−2
Conclusion
In summary, circulating miR-128-3p and miR-181b-5p expression behave as biomarkers of residual leukemia in pediatric ALL. However, these are less sensitive than cur- rent standards of patient follow-up.
Supplementary information
Supplementary information accompanies this paper at https ://doi.
org/10.1186/s1296 7-019-2114-x.
Fig. 6 ROC curve analyses of miR expression changes between day 0 and 8. ROC curves showing the predictive accuracy of miR expression changes between day 0 and 8 to differentiate patients with high and low MRD. Area under the ROC curve (AUC) and its confidence interval are indicated. Patients with high MRD are defined as induction day 15 bone marrow flow cytometry MRD ≥ 1%. a miR-181b-5p; b miR-181a-5p; c miR-128-3p; d miR-222-3p
Additional file 1. Associations between miR expression changes and MRD parameters or risk factors. In these analyses, the dependent vari- able is the normalized miR expression change between the time points compared, all measured in PB PFP. Fold change indicates change in the normalized miR expression between the two time points, the median of these values are provided. Pearson’s r indicates the correlation between dependent and independent variables. Adjusted p refers to the statistical significance of the Pearson’s correlation. *Normal karyotype: no alteration on FISH, DNA index diploid and cytogenetics normal or unsuccessful.
Additional file 2. ROC curve analysis. The predictive accuracy of miRs to differentiate patients with high MRD (defined as induction day 15 bone marrow flow cytometry MRD greater than 1%) versus low MRD (< 1%) was assessed by ROC analysis and by calculating the area under the receiver operating characteristic curve (AUC).
Abbreviations
ABC: absolute blast count; ALC: absolute lymphocyte count; ALL: acute lymphoblastic leukemia; BM: bone marrow; FC: flow cytometry; FISH: fluo- rescent in situ hybridisation; GA: general anaesthesia; HD: hyperdiploid; IgH:
immunoglobulin heavy chain; miR: microRNA; MRD: minimal residual disease;
mRNA: messenger RNA; PB: peripheral blood; PCR: polymerase chain reaction;
PFP: platelet-free plasma; RNA: ribonucleic acid; RNase: ribonuclease; TCR : T cell receptor; TLDA: TaqMan low density array; WBC: white blood cell; WIF1:
Wnt inhibitor factor-1.
Acknowledgements
The authors are thankful to all the patients and control subjects, nurses, physi- cians who took part in this study. We also thank Mónika Sándorné Vángor for the technical assistance.
Authors’ contributions
AR performed the laboratory work, collected clinical data and wrote the manuscript. NK performed the laboratory work. AG performed statistical analysis. JCS performed the laboratory work. BE performed bioinformatics. GP provided patient samples and clinical data. HB performed bioinformatics. GN performed laboratory work. JM provided patient samples and clinical data.
GTK supervised the research and provided patient samples. CS supervised the research and contributed to experimental discussion. AFS supervised the research, contributed to experimental discussion and reviewed the manu- script. DJE designed the study, analyzed the data and wrote the paper.
Funding
This research was supported by the National Research, Development and Innovation Office (NKFIH, Grant No. K115861, D.J. Erdélyi, and Grant No.
K112872, C. Szalai), the Hungarian Pediatric Oncology Network (Grants 09/
MGYH-MGYGYT/2018 and 01/MGYH-MGYGYT/2018), the BME-Biotechnology FIKP Grant of EMMI (BME FIKP-BIO) and the Hungarian Society of Haematol- ogy and Transfusion (Grant to D.J.E. in 2017). The funders had no role in study design, data collection and analysis, decision to publish, or preparation of the manuscript.
Availability of data and materials
The datasets used and/or analysed during the current study are available from the corresponding author on reasonable request.
Ethics approval and consent to participate
The study was approved by the Ethics Committee of the Hungarian Medical Research Council (60106-1/2015/EKU and 6886/2019/EKU) and conducted according to the principles of the Declaration of Helsinki.
Consent for publication Not applicable.
Competing interests
The authors declare that they have no competing interests.
Author details
1 2nd Department of Paediatrics, Semmelweis University, Budapest, Hungary.
2 Department of Genetics, Cell- and Immunobiology, Semmelweis University,
Budapest, Hungary. 3 MTA-SE Immune-Proteogenomics Extracellular Vesicle Research Group, Budapest, Hungary. 4 Department of Measurement and Infor- mation Systems, Budapest University of Technology and Economics, Budapest, Hungary. 5 Heim Pál Children’s Hospital, Budapest, Hungary. 6 Department of Laboratory Medicine, Semmelweis University, Budapest, Hungary. 7 MTA-SE Molecular Medicine Research Group, Hungarian Academy of Sciences and Semmelweis University, Budapest, Hungary.
Received: 7 August 2019 Accepted: 26 October 2019
References
1. van Dongen JJM, van der Velden VHJ, Brüggemann M, Orfao A.
Minimal residual disease diagnostics in acute lymphoblastic leuke- mia: need for sensitive, fast, and standardized technologies. Blood.
2015;125(26):3996–4009.
2. Wood B, Wu D, Crossley B, Dai Y, Williamson D, Gawad C, et al. Measurable residual disease detection by high-throughput sequencing improves risk stratification for pediatric B-ALL. Blood. 2018;131(12):1350–9.
3. Zhang H, Luo X-Q, Zhang P, Huang L-B, Zheng Y-S, Wu J, et al. MicroRNA patterns associated with clinical prognostic parameters and CNS relapse prediction in pediatric acute leukemia. PLoS ONE. 2009;4(11):e7826.
4. Umerez M, Garcia-Obregon S, Martin-Guerrero I, Astigarraga I, Gutierrez- Camino A, Garcia-Orad A. Role of miRNAs in treatment response and toxicity of childhood acute lymphoblastic leukemia. Pharmacogenomics.
2018;19:361–73.
5. Mohr AM, Mott JL. Overview of microRNA biology. Semin Liver Dis.
2015;35(1):3–11.
6. Hammond SM. An overview of microRNAs. Adv Drug Deliv Rev.
2015;87:3–14.
7. Bray PF, McKenzie SE, Edelstein LC, Nagalla S, Delgrosso K, Ertel A, et al.
The complex transcriptional landscape of the anucleate human platelet.
BMC Genomics. 2013;14:1.
8. Ple H, Landry P, Benham A, Coarfa C, Gunaratne PH, Provost P. The repertoire and features of human platelet microRNAs. PLoS ONE.
2012;7(12):e50746.
9. Landgraf P, Rusu M, Sheridan R, Sewer A, Iovino N, Aravin A, et al. A mam- malian microRNA expression atlas based on small RNA library sequenc- ing. Cell. 2007;129(7):1401–14.
10. Reinhart BJ, Slack FJ, Basson M, Pasquinelli AE, Bettinger JC, Rougvie AE, et al. The 21-nucleotide let-7 RNA regulates developmental timing in Caenorhabditis elegans. Nature. 2000;403(6772):901–6.
11. Witwer KW. Circulating MicroRNA biomarker studies: pitfalls and potential solutions. Clin Chem. 2015;61(1):56–63.
12. Thery C. Exosomes: secreted vesicles and intercellular communications.
F1000 Biol Rep. 2011;3:15.
13. Yanez-Mo M, Siljander PR, Andreu Z, Zavec AB, Borras FE, Buzas EI, et al.
Biological properties of extracellular vesicles and their physiological func- tions. J Extracell Vesicles. 2015;4:27066.
14. Gantier MP, McCoy CE, Rusinova I, Saulep D, Wang D, Xu D, et al. Analysis of microRNA turnover in mammalian cells following Dicer1 ablation.
Nucleic Acids Res. 2011;39(13):5692–703.
15. Leidinger P, Backes C, Meder B, Meese E, Keller A. The human miRNA repertoire of different blood compounds. BMC Genomics. 2014;15:474.
16. Wang K, Zhang S, Weber J, Baxter D, Galas DJ. Export of microRNAs and microRNA-protective protein by mammalian cells. Nucleic Acids Res.
2010;38(20):7248–59.
17. Vickers KC, Palmisano BT, Shoucri BM, Shamburek RD, Remaley AT.
MicroRNAs are transported in plasma and delivered to recipient cells by high-density lipoproteins. Nat Cell Biol. 2011;13(4):423–33.
18. Mittelbrunn M, Gutierrez-Vazquez C, Villarroya-Beltri C, Gonzalez S, Sanchez-Cabo F, Gonzalez MA, et al. Unidirectional transfer of microRNA- loaded exosomes from T cells to antigen-presenting cells. Nat Commun.
2011;2:282.
19. Schwarzenbach H, Nishida N, Calin GA, Pantel K. Clinical relevance of circulating cell-free microRNAs in cancer. Nat Rev Clin Oncol. 2014;11:145.
20. Mets E, Van Peer G, Van der Meulen J, Boice M, Taghon T, Goossens S, et al. MicroRNA-128-3p is a novel oncomiR targeting PHF6 in T-cell acute lymphoblastic leukemia. Haematologica. 2014;99(8):1326–33.
21. Zhu YD, Wang L, Sun C, Fan L, Zhu DX, Fang C, et al. Distinctive microRNA signature is associated with the diagnosis and prognosis of acute leuke- mia. Med Oncol (Northwood, London, England). 2012;29(4):2323–31.
22. Fulci V, Colombo T, Chiaretti S, Messina M, Citarella F, Tavolaro S, et al.
Characterization of B- and T-lineage acute lymphoblastic leukemia by integrated analysis of MicroRNA and mRNA expression profiles. Genes Chromosom Cancer. 2009;48(12):1069–82.
23. Wang H, Peng R, Wang J, Qin Z, Xue L. Circulating microRNAs as poten- tial cancer biomarkers: the advantage and disadvantage. Clin Epigenet.
2018;10(1):59.
24. Yingchun L, Rong Z, Kun Y, Ying Y, Zhuogang L. Bone marrow Micro- RNA-335 level predicts the chemotherapy response and prognosis of adult acute myeloid leukemia. Medicine. 2015;94(33):e0986.
25. Fathullahzadeh S, Mirzaei H, Honardoost MA, Sahebkar A, Salehi M.
Circulating microRNA-192 as a diagnostic biomarker in human chronic lymphocytic leukemia. Cancer Gene Ther. 2016;23(10):327–32.
26. Papageorgiou SG, Kontos CK, Diamantopoulos MA, Bouchla A, Glezou E, Bazani E, et al. MicroRNA-155-5p overexpression in peripheral blood mononuclear cells of chronic lymphocytic leukemia patients is a novel, independent molecular biomarker of poor prognosis. Dis Markers.
2017;2017:2046545.
27. Lacroix R, Judicone C, Mooberry M, Boucekine M, Key NS, Dignat- George F, et al. Standardization of pre-analytical variables in plasma microparticle determination: results of the International Society on Thrombosis and Haemostasis SSC Collaborative workshop. J Thromb Haemost. 2013;11(6):1190–3.
28. Mitchell AJ, Gray WD, Hayek SS, Ko Y-A, Thomas S, Rooney K, et al. Plate- lets confound the measurement of extracellular miRNA in archived plasma. Sci Rep. 2016;6:32651.
29. Marabita F, de Candia P, Torri A, Tegnér J, Abrignani S, Rossi RL. Normali- zation of circulating microRNA expression data obtained by quantita- tive real-time RT-PCR. Brief Bioinform. 2016;17(2):204–12.
30. Schwarzenbach H, da Silva AM, Calin G, Pantel K. Data nor- malization strategies for MicroRNA quantification. Clin Chem.
2015;61(11):1333–42.
31. Luna-Aguirre CM, de la Luz Martinez-Fierro M, Mar-Aguilar F, Garza- Veloz I, Trevino-Alvarado V, Rojas-Martinez A, et al. Circulating micro- RNA expression profile in B-cell acute lymphoblastic leukemia. Cancer Biomarkers. 2015;15(3):299–310.
32. Vilella F, Moreno-Moya JM, Balaguer N, Grasso A, Herrero M, Martinez S, et al. Hsa-miR-30d, secreted by the human endometrium, is taken up by the pre-implantation embryo and might modify its transcriptome.
Development (Cambridge, England). 2015;142(18):3210–21.
33. Rinnerthaler G, Hackl H, Gampenrieder SP, Hamacher F, Hufnagl C, Hauser-Kronberger C, et al. miR-16-5p is a stably-expressed house- keeping MicroRNA in breast cancer tissues from primary tumors and from metastatic sites. Int J Mol Sci. 2016;17(2):e156.
34. de Oliveira JC, Scrideli CA, Brassesco MS, Morales AG, Pezuk JA, Queiroz Rde P, et al. Differential miRNA expression in childhood acute lympho- blastic leukemia and association with clinical and biological features.
Leuk Res. 2012;36(3):293–8.
35. Han B-W, Feng D-D, Li Z-G, Luo X-Q, Zhang H, Li X-J, et al. A set of miRNAs that involve in the pathways of drug resistance and leuke- mic stem-cell differentiation is associated with the risk of relapse and glucocorticoid response in childhood ALL. Hum Mol Genet.
2011;20(24):4903–15.
36. Schotte D, De Menezes RX, Akbari Moqadam F, Khankahdani LM, Lange- Turenhout E, Chen C, et al. MicroRNA characterize genetic diversity and drug resistance in pediatric acute lymphoblastic leukemia. Haemato- logica. 2011;96(5):703–11.
37. Harada M, Pokrovskaja-Tamm K, Soderhall S, Heyman M, Grander D, Cor- coran M. Involvement of miR17 pathway in glucocorticoid-induced cell death in pediatric acute lymphoblastic leukemia. Leukemia Lymphoma.
2012;53(10):2041–50.
38. Diakos C, Zhong S, Xiao Y, Zhou M, Vasconcelos GM, Krapf G, et al. TEL- AML1 regulation of survivin and apoptosis via miRNA-494 and miRNA- 320a. Blood. 2010;116(23):4885–93.
39. Neilson JR, Zheng GX, Burge CB, Sharp PA. Dynamic regulation of miRNA expression in ordered stages of cellular development. Genes Dev.
2007;21(5):578–89.
40. Avigad S, Verly IR, Lebel A, Kordi O, Shichrur K, Ohali A, et al. miR expression profiling at diagnosis predicts relapse in pediatric precur- sor B-cell acute lymphoblastic leukemia. Genes Chromosom Cancer.
2016;55(4):328–39.
41. Perkins JR, Dawes JM, McMahon SB, Bennett DL, Orengo C, Kohl M. Read- qPCR and NormqPCR: r packages for the reading, quality checking and normalisation of RT-qPCR quantification cycle (Cq) data. BMC Genomics.
2012;13:296.
42. Ritchie ME, Phipson B, Wu D, Hu Y, Law CW, Shi W, et al. limma powers dif- ferential expression analyses for RNA-sequencing and microarray studies.
Nucleic Acids Res. 2015;43(7):e47.
43. Sun D, Elson P, Liedtke M, Medeiros BC, Earl M, Alizadeh A, et al. Absolute lymphocyte count at day 28 independently predicts event-free and over- all survival in adults with newly diagnosed acute lymphoblastic leukemia.
Am J Hematol. 2012;87(10):957–60.
44. Farkas T, Muller J, Erdelyi DJ, Csoka M, Kovacs GT. Absolute Lymphocyte Count (ALC) after induction treatment predicts survival of pediat- ric patients with acute lymphoblastic leukemia. Pathol Oncol Res.
2017;23(4):889–97.
45. Schumich A, Maurer-Granofszky M, Attarbaschi A, Potschger U, Buldini B, Gaipa G, et al. Flow-cytometric minimal residual disease monitoring in blood predicts relapse risk in pediatric B-cell precursor acute lympho- blastic leukemia in trial AIEOP-BFM-ALL 2000. Pediatr Blood Cancer.
2019;66(5):e27590.
46. Conter V, Bartram CR, Valsecchi MG, Schrauder A, Panzer-Grumayer R, Moricke A, et al. Molecular response to treatment redefines all prognostic factors in children and adolescents with B-cell precursor acute lympho- blastic leukemia: results in 3184 patients of the AIEOP-BFM ALL 2000 study. Blood. 2010;115(16):3206–14.
47. Basso G, Veltroni M, Valsecchi MG, Dworzak MN, Ratei R, Silvestri D, et al.
Risk of relapse of childhood acute lymphoblastic leukemia is predicted by flow cytometric measurement of residual disease on day 15 bone mar- row. J Clin Oncol. 2009;27(31):5168–74.
48. Juzenas S, Venkatesh G, Hubenthal M, Hoeppner MP, Du ZG, Paulsen M, et al. A comprehensive, cell specific microRNA catalogue of human peripheral blood. Nucleic Acids Res. 2017;45(16):9290–301.
49. Wong N, Wang X. miRDB: an online resource for microRNA target predic- tion and functional annotations. Nucleic Acids Res. 2015;43(Database issue):D146–52.
50. Mi S, Lu J, Sun M, Li Z, Zhang H, Neilly MB, et al. MicroRNA expression signatures accurately discriminate acute lymphoblastic leukemia from acute myeloid leukemia. Proc Natl Acad Sci USA. 2007;104(50):19971–6.
51. Nemes K, Csóka M, Nagy N, Márk Á, Váradi Z, Dankó T, et al. Expression of certain leukemia/lymphoma related microRNAs and its correlation with prognosis in childhood acute lymphoblastic leukemia. Pathol Oncol Res.
2015;21(3):597–604.
52. Duyu M, Durmaz B, Gunduz C, Vergin C, Yilmaz Karapinar D, Aksoylar S, et al. Prospective evaluation of whole genome microRNA expression profiling in childhood acute lymphoblastic leukemia. BioMed Res Int.
2014;2014:967585.
53. Schotte D, Chau JC, Sylvester G, Liu G, Chen C, van der Velden VH, et al.
Identification of new microRNA genes and aberrant microRNA profiles in childhood acute lymphoblastic leukemia. Leukemia. 2009;23(2):313–22.
54. Shafik RE, Abd El Wahab N, Senoun SA, Ebeid E, El Taweel MA. Expression of micro-RNA 128 and let-7b in Pediatric acute lymphoblastic leukemia cases. Asian Pac J Cancer Prev. 2018;19(8):2263–7.
55. Zhou J, Wang S, Sun K, Chng WJ. The emerging roles of exosomes in leukemogeneis. Oncotarget. 2016;7(31):50698–707.
56. Swellam M, Hashim M, Mahmoud MS, Ramadan A, Hassan NM. Aberrant expression of some circulating miRNAs in childhood acute lymphoblastic leukemia. Biochem Genet. 2018;56(4):283–94.
57. Jiang Q, Lu X, Huang P, Gao C, Zhao X, Xing T, et al. Expression of miR- 652-3p and effect on apoptosis and drug sensitivity in pediatric acute lymphoblastic leukemia. Biomed Res Int. 2018;2018:5724686.
58. McDonald AC, Vira M, Shen J, Sanda M, Raman JD, Liao J, et al. Circulating microRNAs in plasma as potential biomarkers for the early detection of prostate cancer. Prostate. 2018;78(6):411–8.
59. Ostenfeld MS, Jensen SG, Jeppesen DK, Christensen LL, Thorsen SB, Stenvang J, et al. miRNA profiling of circulating EpCAM(+) extracellular vesicles: promising biomarkers of colorectal cancer. J Extracell Vesicles.
2016;5:31488.
•fast, convenient online submission
•
thorough peer review by experienced researchers in your field
• rapid publication on acceptance
• support for research data, including large and complex data types
•
gold Open Access which fosters wider collaboration and increased citations maximum visibility for your research: over 100M website views per year
•
At BMC, research is always in progress.
Learn more biomedcentral.com/submissions
Ready to submit your research? Choose BMC and benefit from:
60. Lyu X, Li J, Yun X, Huang R, Deng X, Wang Y, et al. miR-181a-5p, an inducer of Wnt-signaling, facilitates cell proliferation in acute lymphoblastic leukemia. Oncol Rep. 2017;37(3):1469–76.
61. Li M, Fu W, Wo L, Shu X, Liu F, Li C. miR-128 and its target genes in tumori- genesis and metastasis. Exp Cell Res. 2013;319(20):3059–64.
62. Georgantas RW 3rd, Hildreth R, Morisot S, Alder J, Liu CG, Heimfeld S, et al.
CD34+ hematopoietic stem-progenitor cell microRNA expression and function: a circuit diagram of differentiation control. Proc Natl Acad Sci USA. 2007;104(8):2750–5.
63. Ju X, Li D, Shi Q, Hou H, Sun N, Shen B. Differential microRNA expression in childhood B-cell precursor acute lymphoblastic leukemia. Pediatr Hematol Oncol. 2009;26(1):1–10.
Publisher’s Note
Springer Nature remains neutral with regard to jurisdictional claims in pub- lished maps and institutional affiliations.