RESEARCH
MicroRNA-181a as novel liquid biopsy
marker of central nervous system involvement in pediatric acute lymphoblastic leukemia
Bálint Egyed1,2, Nóra Kutszegi1, Judit C. Sági2, András Gézsi5,6, Andrea Rzepiel1, Tamás Visnovitz2, Péter Lőrincz3, Judit Müller1, Marianna Zombori4, Csaba Szalai2,4, Dániel J. Erdélyi1, Gábor T. Kovács1† and Ágnes F. Semsei2*†
Abstract
Background: Refractory central nervous system (CNS) involvement is among the major causes of therapy failure in childhood acute leukemia. Applying contemporary diagnostic methods, CNS disease is often underdiagnosed. To explore more sensitive and less invasive CNS status indicators, we examined microRNA (miR) expressions and extracel- lular vesicle (EV) characteristics.
Methods: In an acute lymphoblastic leukemia (ALL) discovery cohort, 47 miRs were screened using Custom TaqMan Advanced Low-Density Array gene expression cards. As a validation step, a candidate miR family was further scru- tinized with TaqMan Advanced miRNA Assays on serial cerebrospinal fluid (CSF), bone marrow (BM) and peripheral blood samples with different acute leukemia subtypes. Furthermore, small EV-rich fractions were isolated from CSF and the samples were processed for immunoelectron microscopy with anti-CD63 and anti-CD81 antibodies, simultaneously.
Results: Regarding the discovery study, principal component analysis identified the role of miR-181-family (miR- 181a-5p, miR-181b-5p, miR-181c-5p) in clustering CNS-positive (CNS+) and CNS-negative (CNS‒) CSF samples. We were able to validate miR-181a expression differences: it was about 52 times higher in CSF samples of CNS+ ALL patients compared to CNS‒ cases (n = 8 vs. n = 10, ΔFC = 52.30, p = 1.5E−4), and CNS+ precursor B cell subgroup also had ninefold higher miR-181a levels in their BM (p = 0.04). The sensitivity of CSF miR-181a measurement in ALL highly exceeded those of conventional cytospin in the initial diagnosis of CNS leukemia (90% vs. 54.5%). Pellet resulting from ultracentrifugation of CNS+ CSF samples of ALL patients showed atypical CD63−/CD81− small EVs in high density by immunoelectron microscopy.
Conclusions: After validating in extensive cohorts, quantification of miR-181a or a specific EV subtype might provide novel tools to monitor CNS disease course and further adjust CNS-directed therapy in pediatric ALL.
Keywords: Central nervous system involvement, Pediatric leukemia, Liquid biopsy, microRNA-based biomarker, Small extracellular vesicles
© The Author(s) 2020. This article is licensed under a Creative Commons Attribution 4.0 International License, which permits use, sharing, adaptation, distribution and reproduction in any medium or format, as long as you give appropriate credit to the original author(s) and the source, provide a link to the Creative Commons licence, and indicate if changes were made. The images or other third party material in this article are included in the article’s Creative Commons licence, unless indicated otherwise in a credit line to the material. If material is not included in the article’s Creative Commons licence and your intended use is not permitted by statutory regulation or exceeds the permitted use, you will need to obtain permission directly from the copyright holder. To view a copy of this licence, visit http://creat iveco mmons .org/licen ses/by/4.0/. The Creative Commons Public Domain Dedication waiver (http://creat iveco mmons .org/publi cdoma in/
zero/1.0/) applies to the data made available in this article, unless otherwise stated in a credit line to the data.
Background
Despite extensive endeavors towards risk-directed treat- ment, acute leukemia remain the major cause of death and is responsible for the highest number of disability- adjusted life-years in children and adolescents with can- cer [1]. Leukemic involvement of the central nervous
Open Access
*Correspondence: semsei.agnes@med.semmelweis-univ.hu
†Gábor T. Kovács and Ágnes F. Semsei co-supervised the study and should be considered as co-last authors
2 Department of Genetics, Cell- and Immunobiology, Semmelweis University, 4 Nagyvárad Sqr, Budapest 1089, Hungary
Full list of author information is available at the end of the article
system (CNS) represents an outstanding therapeutic problem [2]. Prophylactic regimens (intrathecal and high-dose systemic chemotherapy, cranial irradiation) against CNS leukemia has become a prerequisite of suc- cessful treatment: prior to the introduction of CNS- targeted therapy in the 1960s, symptomatic meningeal leukemia developed in more than 50% of cases and CNS relapse rate was over 65% in childhood acute lympho- blastic leukemia (ALL) [3, 4]. Nevertheless, patients with ALL who have a history of overt CNS involvement at the initial diagnosis are still susceptible to relapse with only 15–20% 5-year survival rates [5]. CNS disease in acute myeloid leukemia (AML) entails poor outcomes, and optimal treatment has not been established, mainly due to the rarity of this condition [6].
According to the modern approach, the CNS invasion can be the ultimate step of the tumor cascade [7], and vice versa, CNS relapse of acute leukemia constitutes an early manifestation of systemic relapse and subclones freely traffic between leukemic niches of different organs [8]. Thus, neural and bone marrow (BM) compartments also need to be monitored to reach proper disease con- trol. Very sensitive laboratory methods are available to monitor minimal residual disease in the BM. Currently used tests can quantify the leukemic cells after a fall by 4 to 6 logs [9]. We lack tools with similar sensitivity regard- ing the CNS compartment. The most widespread con- temporary methods for the assessment of cerebrospinal fluid (CSF) are conventional cytologic examination of a cytocentrifuge smear and flow cytometry [10]. Espe- cially due to the paucity of cells in the CSF, both methods yield a high proportion (more than 40%) of false-negative reports among patients with proven CNS infiltration by neuroimaging or autopsy [11]. Consequently, a gold standard method for staging the CNS involvement in acute leukemia has not been established yet.
We hypothesize that some non-cellular biomarkers could identify undiagnosed CNS leukemia cases and unravel treatment response follow-up in this important compartment. MicroRNAs (miRs) belong to the class of highly conserved small non-coding RNAs that play key regulatory role in a wide range of biological processes such as proliferation, differentiation and survival [12].
Altered expression patterns of miRs have been increas- ingly recognized associating with progression in vari- ous types of tumors including acute leukemia [13]. The deregulation of miRs in disease conditions can be har- nessed as potential new-generation therapeutics.
Cells in the human body continuously discharge large amounts of vesicles 30–1000 nm in diameter into the extracellular space. Extracellular vesicles (EVs) are impor- tant factors of intercellular communication: they transfer DNA, coding and regulatory RNAs, lipids and proteins
in the microenvironment as well as among very distant tissues [14]. It is widely accepted that EV production increases in the tumor microenvironment, hence, these particles may facilitate proper “cancer cell biopsy”. In studies performed on different leukemia patients, pres- ence of EVs originating from leukemic cells was shown and certain alterations in the EVs correlated with the hijacking of disease niches and treatment efficacies [15].
In this study, we provide an analysis of miRs as puta- tive biomarkers of pediatric acute leukemia stage and dynamics in the CNS compartment and a novel pro- posal of examining small EVs in the CSF of CNS leuke- mia patients. We based our miR investigation not only on CSF but also on bone marrow (BM) and peripheral blood (PB) samples, bearing in mind the aim of developing less invasive diagnostics.
Materials and methods Patient cohorts and samples
Between October 2015 and August 2019, we collected peripheral blood, bone marrow (PB and BM, respectively;
in tubes with 3.2% buffered sodium citrate solution) and CSF (native) from 186 consecutive, unselected patients (aged ≤ 18 years) diagnosed with acute leukemia or con- comitant relapse in two Hungarian pediatric hematol- ogy centers (Semmelweis University 2nd Department of Pediatrics and Heim Pal National Pediatric Institute). All patients were enrolled into a Berlin-Frankfurt-Münster (BFM) trial, and samples were obtained at different time- points in the 1st month of chemotherapy. Patients under- went diagnostic and follow-up lumbar puncture (LP).
CSF was examined in the participating hospital according to BFM protocols with the use of a cell counting cham- ber and conventional cytology after cytocentrifugation.
For the present study, CNS status was defined as follows, with respect to subsequent rate of relapses [16]: CNS- involved (CNS+; nontraumatic LP with unambiguously identified blasts on cytospin preparation of CSF) and CNS-negative (CNS−; blast-free CSF). CNS− cases were selected based on conventional cytologic preparations double-checked by expert pediatric hematologists (com- ments in Table 1) and the absence of meningeal infiltra- tion signs by medical imaging and/or clinical neurologic examination. Patients with traumatic LP were excluded.
Preparation of platelet-free plasma (PFP) from PB and BM samples was carried out within 2 h of sampling by centrifugation at 2500g for 15 min two times [17].
To constitute a discovery cohort, we selected CNS+ ALL patients (n = 4) and matched CNS− patients at a ratio of 1:1 according to sex, age at diagnosis and immu- nophenotype (Table 1 and Additional file 1: Table S1).
Related CSF and PB samples were analyzed. Refer- ence PB samples were obtained from individuals with
non-malignant diseases (n = 10; median age: 4.2; the proportion of males: 0.4; diagnoses: vitamin D defi- ciency, impetigo, otitis media, latent hypothyroidism, juvenile idiopathic arthritis, iron deficiency anemia,
neurofibromatosis type 1, phimosis). Validation cohort consisted of ALL, AML or mixed phenotype acute leu- kemia (MPAL) patients with CNS+ (n = 11) and CNS‒ (n = 13) diseases (Table 1 and Additional file 1: Table S1).
Table 1 Clinical characteristics of childhood acute leukaemia patients involved in discovery and validation cohorts
Treatment guidelines: aALL IC BFM 2009, bALL REZ BFM 2002, cInterfant 2006, dAML BFM 98
CNS central nervous system, ALL acute lymphoblastic leukaemia, AML acute myeloid leukaemia, MPAL mixed phenotype acute leukaemia, Rel relapse, CSF cerebrospinal fluid, BM bone marrow, PB peripheral blood, WBC white blood cell, RBC red blood cell, d day
Total number of examined samples Samples
Discovery cohort Validation cohort
20 138
Control group (sample type, number of individuals) PB, n = 10 CSF, n = 6 ID Diagnosis, treatment CSF cytology (CNS status according
to protocol) CSF CSF BM PB
CNS+ patient group
P1 ALL, late-onset Relb lymphoid cells with unambiguous blasts (CNS-2) d0 d0, d15 d0, d15, d30 d0, d15, d30 P2 ALL, de novoc 86 WBCs; high amount of blasts (CNS-3) d0, d15 d0, d15, d32, d45 d37 d0, d37 P3 ALL, de novoa 1 unambiguous blast, 2 suspicious cells (CNS-2) d0 d0, d15, d33 d0, d15, d33 d0, d15, d33
P4 ALL, de novoa 4 WBCs/μl with blasts (CNS-2) d0, d15 ‒ ‒ ‒
P5 ALL, de novoa 18 lymphoid cells (mainly blasts), 20 Gumprecht
shadows (CNS-2) ‒ d0, d15 d0, d15 d0, d15
P6 ALL, de novoa 1 unambiguous blast (CNS-2) ‒ d0, d15, d33 d0, d15, d33 d0, d15, d33
P7 MPAL, de novoa some cells, 70% blast (CNS-2) ‒ d15, d33 d0, d15, d33 d0, d15, d33
P8 AML, de novod 53 cells; 8% blast (CNS-2) ‒ d0, d15 d0 d0, d15
P9 AML, de novod 7 WBCs/μl; numerous blasts (CNS-3) ‒ d0, d28 d0, d28 d0, d28
P10 ALL, early-onset Relb 43 WBCs, mostly blasts (CNS-3) ‒ d0 d0 ‒
P11 ALL, de novoa nucleated cells, 70% blast (CNS-2) ‒ d0, d15 ‒ ‒
P12 ALL, de novoa 35 lymphoid cells with 10% blast (CNS-2) ‒ d0, d15, d26, d40 ‒ ‒
CNS− patient group
P13 ALL, de novoa 1 cell/μl without blasts (CNS-1) d0 ‒ ‒ ‒
P14 ALL, de novoa without cells (CNS-1) d0 ‒ ‒ ‒
P15 ALL, de novoa without cells (CNS-1) d0 ‒ ‒ ‒
P16 ALL, de novoa 1 cell/μl without blasts (CNS-1) d0 ‒ ‒ ‒
P17 ALL, early-onset Relb squamous cells, 2 lymphocyte, 1 Gumprecht
shadow (CNS-1) ‒ d0, d15 d0, d15, d37 d0, d15, d37
P18 ALL, early-onset Relb without cells (CNS-1) ‒ d0, d15 d0, d15 d0, d15
P19 ALL, de novoa without cells (CNS-1) ‒ d0, d15, d33 d0, d15, d33 d0, d15, d33
P20 ALL, de novoa only a few RBCs (CNS-1) ‒ d0, d15 d0, d15, d33 d0, d15, d33
P21 ALL, de novoa 2 cells without blasts (CNS-1) ‒ d0, d15, d33 d0, d15, d33 d0, d15, d33
P22 MPAL, de novoa a few squamous cells on cytospin (CNS-1) ‒ d15, d38 d0, d15, d38 d0, d15, d38
P23 AML, de novod some RBCs without blasts (CNS-1) ‒ d0 d0, d23 d0, d15, d23
P24 AML, de novod 1 segmented, 2 band neutrophil granulocytes
(CNS-1) ‒ d0, d28 d0, d15, d28 d28
P25 ALL, de novoa 1 segment, 8 WBC (CNS-1) ‒ d0 d0 ‒
P26 ALL, de novoa without cells (CNS-1) ‒ d0 ‒ ‒
P27 ALL, de novoa without cells (CNS-1) ‒ d0 ‒ ‒
P28 ALL, de novoa 4 segmented neutrophil cells, 3 lymphocytes, 1 monocyte, 1 Gumprecht shadow, but no blasts (CNS-1)
‒ d0 ‒ ‒
P29 ALL, de novoa without cells (CNS-1) ‒ d0 ‒ ‒
In this cohort, median follow-up time of patients after involving them into this study was 1.4 years (range 0.1‒3.3). Analysis was performed on CSF, BM and PB samples. Reference CSF samples in the validation study were derived from spinal muscular atrophy (SMA) patients (n = 6, median age: 1.34, proportion of males:
0.8).
RNA isolation and cDNA amplification
Total RNA was isolated from BM PFP, PB PFP and human native CSF samples using the miRNeasy Serum/
Plasma Mini Kit (Qiagen, Hilden, Germany), according to the manufacturer’s instructions with an initial volume of 100 μl. RNA was eluted into 12 μl RNase-free water and 1.2 μl RNase Inhibitor (Thermo Fisher Scientific, Waltham, MA, USA) was added per sample, then stored at − 80 °C. Synthesis of cDNA by universal reverse tran- scription chemistry after 3′ poly-A tailing and 5′ liga- tion was performed with a TaqMan Advanced miRNA cDNA Synthesis Kit (Thermo Fisher Scientific, Waltham, MA, USA) following the manufacturer’s guidelines. To improve the detection of low-expressing miR targets, the cDNA was then amplified using universal miR-Amp primers of the latter kit. Nucleic acid concentration was measured by NanoDrop 1000 Spectrophotometer (Thermo Fisher Scientific, Waltham, MA, USA).
MiR expression measurements in discovery and validation cohorts
A selection of potential miR marker candidates for CNS leukemia was obtained by compiling miRs expressed in (i) BM cells under leukemic conditions, (ii) blast cells with distinct genetic features and (iii) human platelets to rule out sample mistreatment, as previously described [18]. This process resulted in 47 candidate miRs selected for profiling, see Additional file 1: Table S2. The expres- sion of candidates was measured by quantitative poly- merase chain reactions (qPCR) performed on Custom TaqMan Advanced Low-Density Array (TLDA) micro- fluidic cards (Thermo Fisher Scientific, Waltham, MA, USA), according to the manufacturer’s description using QuantStudio 7 Flex Real-Time PCR System (Thermo Fisher Scientific, Waltham, MA, USA). As a second step, identified differentially expressed (CNS+ vs. CNS‒ groups) miR candidates were assessed in the validation cohort. This qPCR verification was carried out on the 7900HT Fast Real-Time PCR System (Thermo Fisher Sci- entific, Waltham, MA, USA). The experiments were per- formed in duplicates using TaqMan Advanced miRNA Assays and TaqMan Fast Advanced Master Mix (Thermo Fisher Scientific, Waltham, MA, USA) following the manufacturer’s instructions.
Cel-miR-39 (synthesized with 5′-phosphates; Assay ID:
000200) was added as a non-human spike-in control to samples during RNA isolation. After the qPCR reactions, all amplification curves were inspected regardless to patients’ CNS status in order to exclude nonspecific arte- facts. The expression fold change value was calculated according to the comparative cycle threshold (Ct) algo- rithm for each sample. In the validation analysis, at each miR under the detection level, missing Ct values were replaced with maximum Ct per assay, except for normal- izer miR.
Determination of CSF EV characteristics
To evaluate small EV density, firstly, CD63+ EVs were isolated from CSF samples after centrifuging at 300g for 5 min and 2000g for 20 min. EVs were bound by adding 10 μl anti-CD63-coated beads (Exosome-Human CD63 Isolation/Detection Reagent, Thermo Fisher Scientific, Waltham, MA, USA) prepared according to the manufac- turer’s instructions to 300 μl supernatant. After overnight incubation with mixing at 4 °C, beads were magnetically separated (DynaMag Spin Magnet, Thermo Fisher Scien- tific, Waltham, MA, USA), washed with PBS and beads were labelled with anti-CD63-PE (SAB4700218, Sigma- Aldrich) for 20 min. Up to 5000 beads were then meas- ured on a FACSCalibur (BD Biosciences, San Jose, CA, USA) instrument. Output was analyzed using FlowJo software (FlowJo LLC, Ashland, OR, USA; version:
10.5.3).
In another experiment, small EV-rich fractions (irre- spective of the presence of CD63) were isolated for further analysis according to the directives of the Inter- national Society for Extracellular Vesicles [19]. Briefly, CSF was centrifuged in order to remove large cell debris (300g for 5 min) and pelleting of large, secreted microves- icles from the cell-free supernatant (12,500g for 20 min).
A collection of small EVs was performed with two rounds of ultracentrifugation (UC) at 100,000g for 70 min at 4 °C, completed with a washing step using PBS between the UCs. Finally, the pellet was resuspended in 60 µl PBS. A 3 µl droplet was dried on a formvar-coated 300 mesh Ni grid (SPI Supplies, USA) for 10 min. The residual liquid was removed and samples were processed for immuno- electron microscopy with anti-CD63 and anti-CD81 anti- bodies, simultaneously, following previously described steps [20]. Sample examination was carried out using JEOL 1011 transmission electron microscope (Tokyo, Japan).
Bioinformatic analysis
The R language and environment for statistical comput- ing and graphics was used for bioinformatic analysis
(R Foundation for Statistical Computing, Vienna, Aus- tria; version 3.5.3). Selection of miRs for normalization purposes was performed using geNorm [21] and Nor- mFinder [22] algorithms. MiR with probable uniform expression levels in all study samples and a satisfactory abundance in CSF and PB was accepted as reference miR.
Principal component analysis (PCA) with FactoMineR package [23] was used for exploratory multivariate data investigation in the discovery study. PCA helped distin- guish between CSF samples with CNS+ or CNS− back- ground based on miRNomic profile and select candidate miRs for further examinations. Empirical Bayes statisti- cal tests with false discovery rate (FDR) adjustment were performed using the limma package [24] for the evalua- tion of differential miR expression in the validation study.
All linear models were adjusted for age at diagnosis and gender. To determine the diagnostic accuracy of promis- ing markers, area under the receiver operating character- istic (ROC) curve and predictive values were defined by pROC package. Alpha level of 0.05 was used as criterion for statistical significance after FDR correction. The data- sets used and analysed during the current study as well as full analysis code are available from the corresponding author on reasonable request.
Results
Differences in CSF microRNA expression between CNS+ and CNS‒ patients of the discovery cohort
Firstly, we examined whether microRNAs (miRs) were detectable in frozen cerebrospinal fluid (CSF) samples, collected from patients of the discovery cohort. Inter- estingly, in direct measurements with the use of a spec- trophotometer, the concentration of unamplified cDNA prepared from total miR was slightly higher in CNS‒ patients than in the CNS+ group (mean ± standard error:
1222.3 ± 19.4 in CNS− group vs. 1126.8 ± 9.1 in CNS+ group; p = 0.002).
We used TLDA cards to screen the miR profile of CSF samples derived from patients with precursor B-cell ALL (pB-ALL) and peripheral blood (PB) samples of non-leu- kemic control individuals, respectively. In 83% of miRs, the standard error (SE) of the average Ct values in sam- ple duplicates remained under 2 (range: 0.05‒4.69). Three (miR-106a-5p, miR-383-5p, miR-654-5p) of the 47 miRs were not detectable in any of the CSF samples. MiR expression measurements by TLDA cards identified miR- 532-5p as the most stably expressed miR in collective examination of CSF and PB samples. Thus, miR-532-5p was assigned as reference miR and mean relative CSF gene expressions was calculated relative to the reference PB samples. All miRs were quantified at two different treatment checkpoints: (i) at diagnosis in both CNS+ and
CNS− patient groups and (ii) on the 15th follow-up day in CNS+ patients, see Fig. 1a.
Expression fold changes (relative to normalizer miR) of each miR in each sample were evaluated by princi- pal component analysis (PCA) with a goal of identifying miRs that could potentially influence the classification of the patients by their CNS status. It was observed that three members of the miR-181-family (miR-181a-5p, miR-181b-5p, miR-181c-5p) had consistent and consider- able positive contributions to all the first three principal components (PCs) and their aggregated contributions were above the expected average cut-off value (Addi- tional file 1: Table S3). The first three PCs are included to reach a total sum of at least 70% of the original variation (PC1: 36.8%; PC2: 22.9%; PC3: 16.4%). The PCA biplot of PC1 and PC2 (Fig. 1b) shows the clusters of CNS+ and CNS‒ diagnostic samples with clustering performed at a confidence interval of 95%. Small angles between the miR-181-family members on loading plot of PC1 and PC2 (Fig. 1b) imply strong positive pairwise correlations.
A decrease in CSF miR levels to the 15th day of the treatment was also found in CNS+ patients. Among all tested RNAs, levels of miR-181a-5p, miR-181b-5p and miR-181c-5p showed the strongest reductions, as their expression fold changes (ΔFC) were 36.2, 299.4 and 39.8 times lower than at the diagnosis, respectively (see more information in Additional file 1: Table S4). In accordance with the previously mentioned results, miR-181a-5p and miR-181b-5p were selected for further validation.
Diagnosis of CNS leukemia on the basis of miR‑181a‑5p level in CSF of patients with ALL
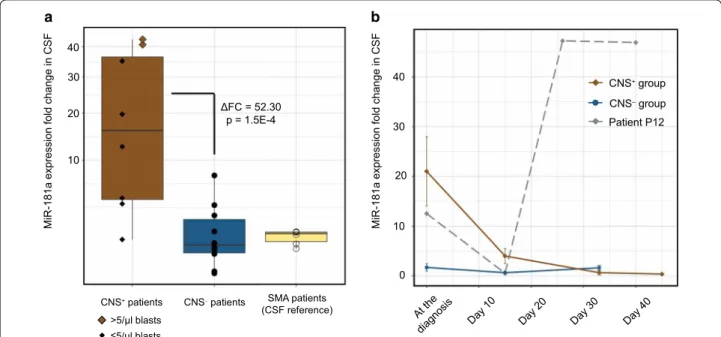
Relying on the TLDA card-based findings, two candidate markers (miR-181a-5p, miR-181b-5p) were tested using CSF samples in the validation cohort consisted of lym- phoid, myeloid and mixed phenotype acute leukemia. We were able to confirm the high expression of miR-181a-5p in diagnostic CSF samples in a partly independent set of 8 CNS+ ALL patients compared with 10 CNS− ALL patients by conventional qPCR, see Fig. 2a. However, similar results were not found when also including AML patients to the analysis. In those patients with ALL, miR-181a-5p expression levels conferred a more than 52-fold increased risk for CNS leukemia (CNS+ vs. CNS− patients: ΔFC = 52.30, p = 1.49E−4). MiR-181a-5p rela- tive expression level in CSF were independent of B- or T-cell immunophenotypes of ALL. Patients with overt CSF blastosis (CSF with a cell count of > 5/μl and blasts in excess on the cytospin slide) had the most outstanding miR-181a-5p expressions within the CNS+ ALL group.
Median miR-181a-5p expression in ALL patients with- out CNS leukemia did not reach the median miR level
detected in reference CSF samples collected from SMA patients (Fig. 2a). There were no significant expression differences in the case of miR-181b-5p in the validation cohort.
Regarding ALL patients in the validation cohort, the diagnostic efficacy of miR-181a-5p in CSF was evaluated by receiver operating characteristic (ROC) method. This novel marker yielded a sensitivity of 90.0% and specific- ity of 87.5% (area under the ROC curve, AUC: 92.5%) for CNS disease at a cut-off ΔFC value of 3.7, as shown in Additional file 2: Figure S1. To compare the clinical
applicability of this miR marker with conventional cyto- morphology technique, the latter one was also assessed based on previous reports [25] and signed as a ROC- curve in Additional file 2: Figure S1.
To address the issue of treatment-induced alteration dynamics of miR expression in time, we determined the miR-181a-5p expression level in CSF samples of ALL patients during the induction chemotherapy. MiR levels were measured at three timepoints: at diagnosis (before any drug administration), on the 15th day of therapy and on the 33rd day of therapy. We managed to obtain
CNS─CSF at diagnosis CNS+CSF at diagnosis CNS+CSF on 15thday
−10 0 5
−ddCt
a
miR-125b-5p
miR-100-5p cel-
miR-39 miR-9-5p
miR-34a-5p miR-181c-5
p
miR-155-5p miR-181a-5
p miR-320a miR-1973
miR-660-5p miR-21-5
p
miR-128-3p miR-181b-5
p miR-146a-5p miR-501-5p miR-1290 miR-374a-5p miR-20a-5p
miR-30d-5p miR-342-3p miR-17-5
p let-7a-5p miR-92a-3p miR-16-5p miR-93-5p let-7f-5p miR-361-3p miR-103a-3p miR-222-3p miR-484
miR-126-3p miR-
654-5p
miR-511-5p miR-370-3p miR-494-3p miR-632 miR-223-3p
miR-19b-3p miR-629-5
p
miR-19a-3p miR-99a-5p
CNS+CSF at diagnosis CNS─CSF at diagnosis CNS+CSF on 15thday 0
0
‒ 6 6
‒ 5 5
PC2 (22.9%)
b
PC1 (36.8%) 3
‒ 3
Fig. 1 MiR-181-family has consistent contribution to altered microRNA expression in cerebrospinal fluid samples in discovery cohort. a Heatmap shows the overexpressed (red) and the downregulated (blue) microRNAs (miRs) in distinct sample types. Gross divergence in miR pattern of patients with or without initial CNS disease is highlighted with black frames. Mean relative expression levels were determined by ddCt algorithm, using miR-532-5p as reference miR and PB samples of control individuals as reference samples. b Biplot derived from principle component analysis shows clusters of CNS-positive and CNS-negative diagnostic samples at a confidence level of 95%. Corresponding loading plot (vectors) displays miR-181-family members. The cosine between two vectors approximates the correlation between miR variables. Position of vectors indicates considerable positive contributions to first and second principal component. CNS central nervous system, CSF cerebrospinal fluid, ddCt delta–delta Ct, miR microRNA, PC principal component
an extra sample from a patient (P2) with massive CNS involvement at 45th day of therapy and samples at excep- tional therapy days (15th, 26th and 40th) from a patient (P12) with fatal disease course. Figure 2b shows changes in relative expression level of CSF miR-181a-5p in CNS+ and CNS− ALL groups and, separately, in patient P12.
The average level of miR-181a-5p decreased by 96.7%
among CNS+ patients (P12 was excluded from this analy- sis) to the 33rd day of therapy, while it remained around the expression detected in diagnostic sample at our later time points in patients without CNS leukemia. Interest- ingly, patient P12′s miR-181a-5p expression has risen in parallel with clinically observed disease progression.
Patient P12 could not finish the induction chemotherapy and was treated in intensive care unit until death. In a patient with CNS+ relapse (P1, ΔFC = 2.40) we observed a more than twofold rise in miR-181a-5p expression to the 15th treatment day from the initial level. This change was not seen in relapsed patients with blast-free CSF (P17 and P18; ΔFC = 0.06 and ΔFC = 0.83, respectively).
Inferiority of bone marrow and peripheral blood miR‑181‑family expression to indicate CNS status in ALL We studied whether the expression levels of miR-181a-5p and miR-181b-5p in PB and BM samples could provide diagnostic or predictive information on CNS leukemia
involvement. Initial PB miR-181a-5p level significantly fell down to the15th and to the 33rd day of treatment in ALL patients regardless of CNS status (to day 15:
ΔFC = − 6.42, p = 0.02; to day 33: ΔFC = 7.95, p = 0.03).
However, there was no difference in miR-181a-5p expres- sion at diagnosis between CNS+ and CNS‒ ALL groups in PB.
MiR-181a-5p expression levels in BM highly exceeded corresponding CSF expression in CNS‒ ALL patients at the diagnosis (ΔFC = 21.97, p = 0.007), but there was no such relation in the CNS+ group. Initial BM expression of miR-181a-5p distinguished only those patients with CNS+ and CNS− ALL who were characterized by pre- cursor B-cell immunophenotype (ΔFC = 9.18, p = 0.04).
However, miR-181a-5p level in PB of control individu- als was lower than in BM of pB-ALL patients in both CNS status groups (CNS+ status: ΔFC = 55.82, p = 0.001;
CNS‒ status: ΔFC = 6.08, p = 0.04). Decrease in miR- 181a-5p level from the diagnosis of ALL to the 33rd day of therapy was also detectable in BM samples not only among CNS+ patients (ΔFC = − 187.96, p = 0.006), but also in the CNS− group (ΔFC = − 8.54, p = 0.002).
a b
Fig. 2 MiR-181a-5p level is a central nervous system involvement indicator in pediatric acute lymphoblastic leukemia. a Each dot indicates the miR-181a-5p expression of a patient. Horizontal line in box plots represents median fold change (FC), extent of boxes indicates upper and lower quartiles, whiskers show maximum and minimum values. b Lines are dedicated to follow the FC alterations in patient groups with and without meningeal leukemia and in a highlighted patient with progressive disease course during induction chemotherapy. Points indicate average FC values, while whiskers mark standard errors. CSF cerebrospinal fluid, CNS central nervous system, SMA spinal muscular atrophy, ΔFC difference in fold change
Atypical small extracellular vesicles in CSF of ALL patients with CNS involvement
Whether extracellular vesicle (EV) production from par- ameningeal leukemic infiltration can be demonstrated by CSF sampling is not yet known. Immunomagnetic bead separation technique was applied to compare the number of CD63+ particles (typically endosome-derived small EVs) in CSF samples of CNS+ and CNS‒ ALL patients (n = 2 and n = 2, respectively). Their measurable amount was very low and no difference was found in the propor- tion of CD63+ beads (mean ± SE: 1.0 ± 0.2% in CNS+ group vs. 1.1 ± 0.1% in CNS− group). Next, from both CNS+ and CNS− patient groups, a representative pB- ALL and a representative T-ALL CSF sample processed by ultracentrifugation (nonselective for cluster of differ- entiation markers) were supervised by immunolabelling for CD63 and CD81 markers using transmission electron microscopy (TEM). Interestingly, a considerable differ- ence was observed in the density of vesicular elements between CNS+ and CNS− patients, as shown in Fig. 3.
High amount of EVs in the CNS+ pB-ALL sample mostly showed CD63‒/CD81− characteristics (Fig. 3a). Whilst, there were low number of EVs in the CNS− pB-ALL sam- ple (Fig. 3b). CSF samples of T-ALL cases showed quite similar pattern, but in this immunophenotype group we found a CD63−/CD81− conglomerate of EVs in the CNS− sample as well (Fig. 3c, d). Presence of CD63+ and CD81+ small EVs in CSF, even if a low number, were confirmed in both CNS groups and immunophenotypes.
Discussion
Contrary to the overall survival rate of 70–85% among children with acute leukemia, leukemic infiltration of the central nervous system (CNS) niche is associated with relapses and major therapeutic obstacles [2]. We still lack methods to follow up CNS leukemia with appro- priate sensitivity. There are two major clinical enigmas related to CNS disease: (i) how can we better screen occult meningeal leukemia and thereby prescribe ade- quate CNS-directed treatment for those who need it, and (ii) may we apply novel molecularly targeted therapies against CNS infiltration in the era of precision oncology?
It is also not fully understood whether the initial CNS leukemia burden or its dynamics during treatment have more prognostic value.
Here we proposed a potential biomarker for the CNS status in ALL. Cerebrospinal fluid (CSF) miR-181a-5p expression levels were unexpectedly high in patients with cytologically confirmed CNS+ ALL, while levels in those lacking meningeal involvement were measured around control levels. This result originated from a dis- covery screening of 47 candidate miRs and was validated in an extended, but still limited study set. Similarly, a
considerable difference was observed in the density of small vesicular elements in CSF samples of CNS+ and CNS‒ patients with ALL. To date, only one study has reported that miRs can be measured in the CSF collected from children with leukemia [26]. Furthermore, our study is unique in that miR expression alterations can be followed individually in time thanks to the serial sample collection, and miR patterns in different compartments of sampling can be compared. CSF-based EV studies in leukemia are also in their early infancy.
Despite the omnipresence of ribonucleases, miRs were found to be highly stable in all body fluids, hence, could be utilized as clinical biomarkers [27]. MiR-181a serves as a regulator of normal hematopoiesis and its disrup- tion has been linked to various types of cancer, includ- ing hematological malignancies [28]. It is one of the most abundant miRs in lymphocytes [29]. In acute leukemia, the exact role of miR-181a is still unclear as contradicting papers claim its oncogene as well as tumor suppressor effects [30–33]. Besides, several mechanisms spreading to the CNS by ALL cells have been revealed recently and can be influenced by miR-181a regulatory actions. Of particular interest to our findings, overexpression of vas- cular endothelial growth factor A (VEGFA), a miR-181a regulated hypoxia-responsive gene, proved to provide survival advantage to CNS-penetrating ALL cells in the hypoxic, nutrient-poor microenvironment of the CNS.
This phenomenon was described in both primary pre-B ALL cells isolated from the CSF of children with CNS involvement and a mouse primograft model for CNS+ ALL [34–36]. The positive correlation between the miR- 181a expression and VEGFA production in a non-epithe- lial tumor tissue was proposed through the scrutiny of human chondrosarcoma cells [37]. A detailed explana- tion how miR-181a promotes the SRC/VEGF signaling pathway was shown in preclinical models of colorectal cancer [38]. A similar mechanism might work in ALL, too. Yet, the nature of CNS disease evolution is not fully understood. While the VEGFA mechanism suggests increased vascular permeability and reduced barrier function of endothelium to make cell migration possible into the CNS, a novel study claims that the whole pro- cess happens abluminally, along emissary bridging vessels based on integrin alpha-6 (ITGA6)-laminin interaction [39]. Interestingly, ITGA6 may interact with miR-181a according to the mirDIP v4.1 integrative miR target pre- dictor database [40].
Whether the ability to invade the CNS is a generic property of all ALL blasts or only a subpopulation of cells can selectively enter this compartment is a sub- ject of recent debate. We found that bone marrow (BM) miR-181a-5p expression of CNS‒ patients (i) exceeded the average level of CNS− CSF and control samples and
a b
c d
500 nm 200 nm
200 nm
500 nm 1000 nm
200 nm 500 nm
200 nm 1000 nm
Fig. 3 Atypical extracellular vesicles in cerebrospinal fluid of patients with different central nervous system (CNS) status. a Transmission electron microscopy (TEM) images of a cerebrospinal fluid (CSF) sample from a CNS+ patient with precursor B-cell acute lymphoblastic leukemia (pB-ALL) depict several small extracellular vesicles (EVs). Inserted panels show the absence of CD63/CD81 immunogold labelling which is a key feature of these EVs. b TEM images taken from the CSF sample of a patient with CNS‒ pB-ALL. Appearance of gold particles refer to CD63 (10 nm) and CD81 (5 nm) positivity of the EVs. c Small EVs in a patient with relapsed CNS+ T-cell ALL show mainly the absence of CD63/CD81 immunogold labelling.
d CD63+/CD81+ small EVs in CSF from a patient with T-cell ALL without CNS involvement. Conversely, inserted slide shows a conglomerate of EVs without typical markers of exosomes originating from multivesicular body
(ii) responded to the chemotherapy with significant reduction, similarly to the CNS+ BM samples. Thus, our data tend to support the theory that ALL cells in the BM compartment have a common ability to reach meningeal surfaces, as previously proposed [41, 42].
Also, the seeding of CNS leukemia may depend on a dynamic relationship between extramedullary micro- environment and blast cells which is influenced by regulatory elements (e.g. miR-181a), rather than prede- termined cell-intrinsic and clone-specific ‘CNS-tropic’
features (e.g. cell surface protein composition). Basi- cally, it was out of our aims to identify the cellular ori- gin of miR-181a-5p in this study setting. Yet, there are some points which suggest the examination of leukemic blasts as potential miR-181 secretors: (i) miR-181a is a well-known small RNA produced by lymphoid cells [29]; (ii) miR-181a was found in significant amount in blast-rich BM samples, regardless of CNS status; (iii) in CNS− CSF samples, where blasts were absent, the average expression of miR-181a was very low. How- ever, it is also a possibility that miR-181a originates from non-leukemic cells communicating with leukemic blasts (e.g. stromal cells in BM or resident cells in CNS leukemic niche) and we measured this phenomenon in our samples. There are plenty of evidence that miR- 181-family plays role in the modulation of tissue dif- ferentiation, remodeling and degeneration in the CNS, moreover, it has anti-inflammatory effect in the context of neuroinflammation [43].
According to our data, miR-181a-5p may provide about 35% sensitivity benefit compared to the cytospin method when diagnosing ALL infiltration in the CNS at the ini- tiation of chemotherapy. However, a paper described that occult meningeal disease during therapy resulted in sig- nificantly higher rates of relapses and death in pediatric ALL, while no such influences were found with initial CSF evaluation [44]. Thus, the alteration of initial miR- 181a-5p level might be considered to estimate prognosis.
Candidate miR expression analysis of peripheral blood (PB) samples identified no benefit of measuring miR-181-family levels to diagnose CNS involvement. In contrast, we showed the possible role of diagnostic BM miR-181a-5p expression in determining CNS status, however, it was demonstrated solely in pB-ALL patients.
This finding might propose a less invasive alternative to LP as BM aspiration which is sometimes also performed at CSF sampling time points. However, higher BM miR- 181a-5p level may be associated with general miRNomic disturbance under leukemic conditions as CNS‒ patients showed elevated relative expression as well. We rather prefer the investigation of miR-181a-5p level alteration
in time as it may monitor the CNS-attacking blast capac- ity of the BM compartment. To indicate subsequent CNS relapse by BM examination, others identified cel- lular proteins [45] and miR pattern [46] in BM cells of ALL patients, but venipuncture-based CNS involvement markers were not published.
This is the first study in which small extracellular vesicle (EV) composition of CSF was assessed in rela- tion with CNS disease state in acute leukemia patients.
Atypical small EVs were found in unexpectedly high den- sity in CNS+ diagnostic CSF samples. The phenotype of these vesicles is not fully understood. They were nega- tive for CD63 and CD81, which contradict the multive- sicular body origin [47]. Nonexosomal subpopulation of small EVs was previously demonstrated [48], and most of the EVs in CNS+ CSF reached the lower limit of the microvesicle size range. Otherwise, it is unlikely that these bodies are lipoproteins with EV-like appearance as CSF lipoprotein content is minimal [49].
In summary, our data represent the first description of a miR as possible CNS infiltration marker in pediatric ALL and extends our knowledge about a small EV sub- group that may associate with CNS+ status. However, several limitations should be noted when interpreting our results. Since CNS involvement is a rare condition in childhood leukemia, the difficulty of obtaining CNS+ samples resulted in low patient numbers. Our results should be verified in larger cohorts before concluding any practical benefit. Another bias is the selection of patients with and without the meningeal disease, which relied on the insensitive conventional cytologic assessment tools.
Yet, this study provides the rationale for future investi- gations of miRs in the CSF for diagnostic and prognos- tic purposes. Our results encourage further research regarding the targeted therapy of CNS leukemia [35, 36]
or miR-181a-based therapeutics as seen in lung cancer models in vitro [50].
Conclusions
Disease course indicators are the “Achilles heel” of ther- apy success in pediatric ALL and miR-181a-5p expression in CSF may provide potential new tools for this purpose.
Based on our experiments, it can worth to further exam- ine miR-181a-5p level in CSF as highly sensitive and spe- cific CNS involvement indicator in ALL to find a novel approach which can upgrade contemporary diagnostic methods. Moreover, with our very first experiments, we propose further CSF small EV measurements and char- acterization from CNS leukemia perspective.
Supplementary information
Supplementary information accompanies this paper at https ://doi.
org/10.1186/s1296 7-020-02415 -8.
Additional file 1: Table S1. Detailed description of patient cohorts.
Table S2. List of 47 microRNAs screened in discovery study. Table S3.
Contribution of miR-181-family members to principal components.
Table S4. Rate of expression decrease of microRNAs in discovery cerebro- spinal fluid samples at day 15th.
Additional file 2: Figure S1. Comparison of receiver operating character- istic (ROC) curves of miR-181a-5p and conventional cytospin methods.
Abbreviations
ALL: Acute lymphoblastic leukaemia; AML: Acute myeloid leukaemia; BM:
Bone marrow; CNS: Central nervous system; CSF: Cerebrospinal fluid; Ct: Cycle threshold; EV: Extracellular vesicle; FDR: False discovery rate; LP: Lumbar punc- ture; miR: microRNA; MPAL: Mixed phenotype acute leukaemia; PB: Peripheral blood; PCA: Principal component analysis; PFP: Platelet-free plasma; qPCR:
Quantitative polymerase chain reaction; ROC: Receiver operating charac- teristic; SMA: Spinal muscular atrophy; TEM: Transmission electron micros- copy; TLDA: Custom TaqMan Advanced Low-Density Array; VEGFA: Vascular endothelial growth factor A; ΔFC: Expression fold change.
Acknowledgements
The authors would like to thank Mónika Sándorné Vángor for her enthusiastic and reliable work in the laboratory. We really appreciate the help of nurses in the sample collection.
Authors’ contributions
BE performed the experiments and the bioinformatic analysis, designed the study and wrote the manuscript. NK interpreted the data, JCS, AR and TV performed laboratory work. AG performed bioinformatic analysis. JM and MZ treated the patients and collected clinical data. CS corrected and approved the final version of the manuscript. DJE designed and supervised the study and provided patient samples. GTK designed and supervised the study, criti- cally reviewed the manuscript. ÁFS revised the concept, interpreted the data and supervised the study. All authors read and approved the final manuscript.
Funding
This work was supported by the National Research, Development and Innova- tion Office (NKFIH, grant No. K115861, D.J. Erdélyi), the Hungarian Pediatric Oncology Network (grant No. 01/MGYH-MGYGYT/2018), the New National Excellence Program of the Ministry of Human Capacities (ÚNKP-18-2-I-SE-37), the Semmelweis Science and Innovation Fund (STIA-KF-17, Á.F. Semsei) and the EFOP-3.6.3-VEKOP-16-2017-00009 project. The funders had no role in study design, data collection and analysis, decision to publish, or preparation of the manuscript.
Availability of data and materials
The datasets used and/or analysed during the current study are available from the corresponding author on reasonable request.
Ethics approval and consent to participate
All procedures performed in this study, involving human participants were in accordance with the ethical standards of the Medical Research Council of Hungary and with the 1964 Helsinki declaration and its later amendments. The study was approved by the central ethical committee (institute: ETT-TUKEB;
approval numbers: 60106-1/2015/EKU and 6886/2019/EKU). The study is com- pliant with all relevant ethical regulations for human research participants, and informed consent was obtained from all patients or legal guardians.
Consent for publication
The authors confirm that written consent from each patient has been obtained to publish the manuscript.
Competing interests
The authors declare that they have no competing interests.
Author details
1 2nd Department of Pediatrics, Semmelweis University, 7-9 Tűzoltó Str, Budapest 1094, Hungary. 2 Department of Genetics, Cell- and Immunobiology, Semmelweis University, 4 Nagyvárad Sqr, Budapest 1089, Hungary. 3 Depart- ment of Anatomy, Cell and Developmental Biology, Eötvös Loránd University, 1/c Pázmány Promenade, Budapest 1117, Hungary. 4 Heim Pal National Pediatric Institute, 86 Üllői Str, Budapest 1089, Hungary. 5 MTA-SE Immune- Proteogenomics Extracellular Vesicle Research Group, Semmelweis University, 4 Nagyvárad Sqr, Budapest 1089, Hungary. 6 Department of Measurements and Information Systems, Budapest University of Technology and Economics, 2 Magyar tudosok korutja, Budapest 1117, Hungary.
Received: 8 February 2020 Accepted: 15 June 2020
References
1. Force LM, Abdollahpour I, Advani SM, Agius D, Ahmadian E, Alahdab F, et al. The global burden of childhood and adolescent cancer in 2017:
an analysis of the Global Burden of Disease Study 2017. Lancet Oncol.
2019;20(9):1211–25.
2. Pui C-H, Howard SC. Current management and challenges of malignant disease in the CNS in paediatric leukaemia. Lancet Oncol. 2008;9:257–68.
3. Evans AE, Gilbert ES, Zandstra R. The increasing incidence of central nerv- ous system leukemia in children. Cancer. 1970;26:404–9.
4. Laningham FH, Kun LE, Morris EB, Pui C-H. Childhood central nervous system leukemia: historical perspectives, current therapy, and acute neurological sequelae. Neuroradiology. 2007;49:873–88.
5. Nguyen K, Devidas M, Cheng S, La M, Raetz EA, Carroll WL, et al. Factors influencing survival after relapse from acute lymphoblastic leukemia: a Children’s Oncology Group study. Leukemia. 2008;22:2142–50.
6. Aoki J, Ishiyama K, Taniguchi S, Fukuda T, Ohashi K, Ogawa H, et al.
Outcome of allogeneic hematopoietic stem cell transplantation for acute myeloid leukemia patients with central nervous system involvement. Biol Blood Marrow Transplant. 2014;20(12):2029–33.
7. Heidari N, Saki N, De Filippis L, Shahjahani M, Teimouri A, Ahmadzadeh A. Central nervous system niche involvement in the leukemia. Clin Transl Oncol. 2016;18(3):240–50.
8. Barredo JC, Devidas M, Lauer SJ, Billett A, Marymont M, Pullen J, et al. Iso- lated CNS relapse of acute lymphoblastic leukemia treated with intensive systemic chemotherapy and delayed CNS radiation: a Pediatric Oncology Group study. J Clin Oncol. 2006;24(19):3142–9.
9. Gaipa G, Basso G, Biondi A, Campana D. Detection of minimal residual disease in pediatric acute lymphoblastic leukemia. Cytom Part B.
2013;84B:359–69.
10. Ranta S, Nilsson F, Harila-Saari A, Saft L, Tani E, Söderhäll S, et al. Detection of central nervous system involvement in childhood acute lymphoblastic leukemia by cytomorphology and flow cytometry of the cerebrospinal fluid. Pediatr Blood Cancer. 2015;62(6):951–6.
11. Crespo-Solis E, López-Karpovitch X, Higuera J, Vega-Ramos B. Diagnosis of acute leukemia in cerebrospinal fluid (CSF-acute leukemia). Curr Oncol Rep. 2012;14:369–78.
12. Rupaimoole R, Slack FJ. MicroRNA therapeutics: towards a new era for the management of cancer and other diseases. Nat Rev Drug Discov.
2017;16(3):203–21.
13. Lim EL, Trinh DL, Ries RE, Wang J, Gerbing RB, Ma Y, et al. MicroRNA expression-based model indicates event-free survival in pediatric acute myeloid leukemia. J Clin Oncol. 2017;35(35):3964–77.
14. Tkach M, Théry C. Communication by extracellular vesicles: where we are and where we need to go. Cell. 2016;164:1226–32.
15. Johnson SM, Dempsey C, Chadwick A, Harrison S, Liu J, Di Y, et al. Meta- bolic reprogramming of bone marrow stromal cells by leukemic extracel- lular vesicles in acute lymphoblastic leukemia. Blood. 2016;128(3):453–6.
16. Mahmoud HH, Rivera GK, Hancock ML, Krance RA, Kun LE, Behm FG, et al.
Low leukocyte counts with blast cells in cerebrospinal fluid of children with newly diagnosed acute lymphoblastic leukemia. N Engl J Med.
1993;329:314–9.
•fast, convenient online submission
•
thorough peer review by experienced researchers in your field
• rapid publication on acceptance
• support for research data, including large and complex data types
•
gold Open Access which fosters wider collaboration and increased citations maximum visibility for your research: over 100M website views per year
•
At BMC, research is always in progress.
Learn more biomedcentral.com/submissions
Ready to submit your research? Choose BMC and benefit from:
17. Lacroix R, Judicone C, Mooberry M, Boucekine M, Key N, Dignat-George F.
Standardization of pre-analytical variables in plasma microparticle deter- mination: results of the International Society on Thrombosis and Haemo- stasis SSC Collaborative workshop. J Thromb Haemost. 2013;11:1190–3.
18. Rzepiel A, Kutszegi N, Gézsi A, Sági JC, Egyed B, Péter G, et al. Circulating microRNAs as minimal residual disease biomarkers in childhood acute lymphoblastic leukemia. J Transl Med. 2019;17:372.
19. Théry C, Witwer KW, Aikawa E, Alcaraz MJ, Anderson JD, Andriantsito- haina R, et al. Minimal information for studies of extracellular vesicles 2018 (MISEV2018): a position statement of the International Society for Extracellular Vesicles and update of the MISEV2014 guidelines. J Extracell Vesicles. 2018;7:1535750.
20. Visnovitz T, Osteikoetxea X, Sódar BW, Mihály J, Vukman KV, Tóth EÁ, et al.
An improved 96 well plate format lipid quantification assay for stand- ardisation of experiments with extracellular vesicles. J Extracell Vesicles.
2019;8(1):1565263.
21. Vandesompele J, De Preter K, Poppe B, Van Roy N, De Paepe A, Spele- man F. Accurate normalization of real-time quantitative RT-PCR data by geometric averaging of multiple internal control genes. Genome Biol.
2002;3(7):RESEARCH0034.1-0034.11.
22. Andersen CL, Jensen JL, Ørntoft TF. Normalization of real-time quantita- tive reverse transcription-PCR data: a model-based variance estimation approach to identify genes suited for normalization, applied to bladder and colon cancer data sets. Cancer Res. 2004;64(15):5245–50.
23. Lê S, Josse J, Husson F. FactoMineR: an R package for multivariate analysis.
J Stat Softw. 2008;25(1):1–18.
24. Phipson B, Lee S, Majewski I, Alexander W, Smyth G. Robust hyperparame- ter estimation protexts against hypervariable genes and improves power to detect differential expression. Ann Appl Stat. 2016;10(2):946–63.
25. de Graaf MT, de Jongste AHC, Kraan J, Boonstra JG, Smitt PAES, Gratama JW. Flow cytometric characterization of cerebrospinal fluid cells. Cytom Part B Clin Cytom. 2011;80B:271–81.
26. Shalaby T, Fiaschetti G, Baulande S, Gerber NU, Baumgartner M, Grotzer MA. Detection and quantification of extracellular microRNAs in medul- loblastoma. J Cancer Metastasis Treat. 2015;1(2):67–75.
27. Grasedieck S, Sorrentino A, Langer C, Buske C, Döhner H, Mertens D, et al.
Circulating microRNAs in hematological diseases: principles, challenges, and perspectives. Blood. 2013;121(25):4977–84.
28. Lin S, Pan L, Guo S, Wu J, Jin L, Wang J-C, et al. Prognostic role of microRNA-181a/b in hematological malignancies: a meta-analysis. PLoS ONE. 2013;8(3):e59532.
29. Ye Z, Li G, Kim C, Hu B, Jadhav RR, Weyand CM, et al. Regulation of miR- 181a expression in T cell aging. Nat Commun. 2018;9:3060.
30. Verduci L, Azzalin G, Gioiosa S, Carissimi C, Laudadio I, Fulci V, et al. Micro- RNA-181a enhances cell proliferation in acute lymphoblastic leukemia by targeting EGR1. Leuk Res. 2015;39:479–85.
31. Nabhan M, Louka ML, Khairy E, Tash F, Ali-Labib R, El-Habashy S.
MicroRNA-181a and its target Smad 7 as potential biomarkers for tracking child acute lymphoblastic leukemia. Gene. 2017;628:253–8.
32. Liu X, Liao W, Peng H, Luo X, Luo Z, Jiang H, et al. MiR-181a promotes G1/S transition and cell proliferation in pediatric acute myeloid leukemia by targeting ATM. J Cancer Res Clin Oncol. 2016;142:77–87.
33. Marucci G, Radmacher MD, Maharry K, Mrózek K, Ruppert AS, Paschka P, et al. MicroRNA expression in cytogenetically normal acute myeloid leukemia. N Engl J Med. 2008;358:1919–28.
34. Münch V, Trentin L, Herzig J, Krauss J, Kestler H, te Kronnie G, et al. Migra- tion of acute lymphoblastic leukemia cells into the central nervous system is regulated by VEGF. Blood. 2015;126(23):2634.
35. Kato I, Nishinaka Y, Nakamura M, Akarca AU, Niwa A, Ozawa H, et al.
Hypoxic adaptation of leukemic cells infiltrating the CNS affords a thera- peutic strategy targeting VEGFA. Blood. 2017;129(23):3126–9.
36. Münch V, Trentin L, Herzig J, Demir S, Seyfried F, Kraus JM, et al.
Central nervous system involvement in acute lymphoblastic
leukemia is mediated by vascular endothelial growth factor. Blood.
2017;130(5):643–55.
37. Sun X, Wei L, Chen Q, Terek RM. MicroRNA regulates vascular endothelial growth factor expression in chondrosarcoma cells. Clin Orthop Relat Res.
2015;473:907–13.
38. Sun W, Wang X, Li J, You C, Lu P, Feng H, et al. MicroRNA-181a promotes angiogenesis in colorectal cancer by targeting SRCIN1 to promote the SRC/VEGF signaling pathway. Cell Death Dis. 2018;9:438.
39. Yao H, Price TT, Cantelli G, Ngo B, Warner MJ, Olivere L, et al. Leukaemia hijacks a neural mechanism to invade the central nervous system. Nature.
2018;560:55–60.
40. Tokar T, Pastrello C, Rossos AEM, Abovsky M, Hauschild A, Tsay M, et al.
mirDIP 4.1—integrative database of human microRNA target predictions.
Nucleic Acids Res. 2018;46:D360–70.
41. Williams MT, Yousafzai YM, Elder A, Rehe K, Bomken S, Frishman-Levy L, et al. The ability to cross the blood–cerebrospinal fluid barrier is a generic property of acute lymphoblastic leukemia blasts. Blood.
2016;127(16):1998–2006.
42. Bartram J, Goulden N, Wright G, Adams S, Brooks T, Edwards D, et al. High throughput sequencing in acute lymphoblastic leukemia reveals clonal architecture of central nervous system and bone marrow compartments.
Haematologica. 2018;103:e110–4.
43. Indrieri A, Carrella S, Carotenuto P, Banfi S, Franco B. The pervasive role of the miR-181 family in development, neurodegeneration, and cancer. Int J Mol Sci. 2020;21:2092.
44. Martínez-Laperche C, Gómez-García AM, Lassaletta Á, Moscardó C, Vivanco JL, Molina J, et al. Detection of occult cerebrospinal fluid involve- ment during maintenance therapy identifies a group of children with acute lymphoblastic leukemia at high risk for relapse. Am J Hematol.
2013;88:359–64.
45. van der Velden VHJ, de Launaij D, de Vries JF, de Haas V, Sonneveld E, Voerman JSA, et al. New cellular markers at diagnosis are associated with isolated central nervous system relapse in paediatric B-cell precursor acute lymphoblastic leukaemia. Br J Haematol. 2016;172:769–81.
46. Zhang H, Luo X, Zhang P, Huang L, Zheng Y, Wu J, et al. MicroRNA pat- terns associated with clinical prognostic parameters and CNS relapse prediction in pediatric acute leukemia. PLoS ONE. 2009;4(11):e7826.
47. Andreu Z, Yáñez-Mó M. Tetraspanins in extracellular vesicle formation and function. Front Immunol. 2014;5:442.
48. Kowal J, Arras G, Colombo M, Jouve M, Paul J, Primdal-Bengtson B, et al.
Proteomic comparison defines novel markers to characterize heteroge- neous populations of extracellular vesicle subtypes. Proc Natl Acad Sci USA. 2016;113:E968–77.
49. Wang H, Eckel RH. What are lipoproteins doing in the brain? Trends Endo- crinol Metab. 2014;25(1):8–14.
50. Braicu C, Gulei D, Cojocneanu R, Raduly L, Jurj A, Knutsen E, et al. MiR- 181a/b therapy in lung cancer: reality or myth? Mol Oncol. 2019;13:9–25.
Publisher’s Note
Springer Nature remains neutral with regard to jurisdictional claims in pub- lished maps and institutional affiliations.