and upregulation of brain MEF2C along breast cancer brain metastasization
Marta Sereno1, Janos Hasko2, Kinga Molnar2, Sarah J. Medina3, Zita Reisz4, Rui Malho5, Mafalda Videira1,6, Laszlo Tiszlavicz4, Stephanie A. Booth3,7, Imola Wilhelm2,8 , Istva´n A.
Krizbai2,8 and Maria Alexandra Brito1,9
1 Faculdade de Farmacia, Research Institute for Medicines (iMed.ULisboa), Universidade de Lisboa, Portugal 2 Institute of Biophysics, Biological Research Centre, Szeged, Hungary
3 Prion Diseases Section, Public Health Agency of Canada, National Microbiology Laboratory, Winnipeg, MB, Canada 4 Department of Pathology, University of Szeged, Hungary
5 Faculdade de Ciencias, BioISI, Instituto de Biossistemas e Ci^ ^encias Integrativas, Universidade de Lisboa, Portugal
6 Department of Galenic Pharmacy and Pharmaceutical Technology, Faculdade de Farmacia, Universidade de Lisboa, Portugal
7 Department of Medical Microbiology and Infectious Diseases, Faculty of Health Sciences, University of Manitoba, Winnipeg, MB, Canada 8 Institute of Life Sciences, Vasile GoldisßWestern University of Arad, Romania
9 Department of Biochemistry and Human Biology, Faculdade de Farmmacia, Universidade de Lisboa, Portugal
Keywords
bioinformatics; brain metastasis; breast cancer; microRNAs; myocyte enhancer factor 2C; next-generation sequencing Correspondence
M. A. Brito, Faculdade de Farmacia, Universidade de Lisboa, Av. Prof. Gama Pinto, Lisboa 1649-003, Portugal Tel: +351 217946449
E-mail: abrito@ff.ulisboa.pt
Marta Sereno and Janos Hasko contributed equally to this article
Istvan A Krizbai and Maria Alexandra Brito shared last authorship
(Received 17 September 2019, revised 31 October 2019, accepted 8 January 2020, available online 5 February 2020) doi:10.1002/1878-0261.12632
Breast cancer brain metastases (BCBMs) have been underinvestigated despite their high incidence and poor outcome. MicroRNAs (miRNAs), and particularly circulating miRNAs, regulate multiple cellular functions, and their deregulation has been reported in different types of cancer and metastasis. However, their signature in plasma along brain metastasis development and their relevant targets remain undetermined. Here, we used a mouse model of BCBM and next-generation sequencing (NGS) to estab- lish the alterations in circulating miRNAs during brain metastasis forma- tion and development. We further performed bioinformatics analysis to identify their targets with relevance in the metastatic process. We addition- ally analyzed human resected brain metastasis samples of breast cancer patients for target expression validation. Breast cancer cells were injected in the carotid artery of mice to preferentially induce metastasis in the brain, and samples were collected at different timepoints (5 h, 3, 7, and 10 days) to follow metastasis development in the brain and in peripheral organs. Metastases were detected from 7 days onwards, mainly in the brain. NGS revealed a deregulation of circulating miRNA profile during BCBM progression, rising from 18% at 3 days to 30% at 10 days follow- ing malignant cells’ injection. Work was focused on those altered prior to metastasis detection, among which were miR-802-5p and miR-194-5p, whose downregulation was validated by qPCR. Using TARGETSCANand DI- ANA TOOLS, the transcription factor myocyte enhancer factor 2C (MEF2C) was identified as a target for both miRNAs, and its expression was increas- ingly observed in malignant cells along brain metastasis development. Its upregulation was also observed in peritumoral astrocytes pointing to a role
Abbreviations
30UTR, 30-untranslated region; BBB, blood–brain barrier; BC, breast cancer; BCBM, breast cancer brain metastasis; BCCs, breast cancer cells; EDTA, ethylenediaminetetraacetic acid; GFAP, glial fibrillary acidic protein; MC, monoclonal; MEF2C, myocyte enhancer factor 2C;
miRNAs or miR-, microRNAs; NGS, next-generation sequencing; PBS, phosphate-buffered saline; PC, polyclonal; qPCR, quantitative real- time polymerase chain reaction.
of MEF2C in the crosstalk between tumor cells and astrocytes. MEF2C expression was also observed in human BCBM, validating the observation in mouse. Collectively, downregulation of circulating miR-802-5p and miR-194-5p appears as a precocious event in BCBM and MEF2C emerges as a new player in brain metastasis development.
1. Introduction
Breast cancer (BC) is the most frequently diagnosed cancer among women worldwide. It represents about 12% of all new cancer cases and 25% of cancers in women, being one of the leading causes of female death from cancer, according to the International Agency for Research on Cancer (Ferlay et al., 2015; Torre et al., 2016). BC has a high incidence and is, next to lung can- cer, the second most frequent cause of brain metastases, which are usually associated with a poor prognosis and diminished life expectancy after diagnosis (Leoneet al., 2015). After transmigrating to the brain, BC cells (BCCs) encounter an ideal environment for metastatic growth, since the blood–brain barrier (BBB) restricts the entrance of most chemotherapeutic agents and pro- vides protection against immune surveillance (Winkler, 2015). Moreover, the BBB and the crosstalk between malignant and brain cells favor brain metastasis (Wil- helmet al., 2019). Altogether, this renders the brain a sanctuary against antitumor strategies, hindering the treatment of brain metastases with the available current therapies (Koteckiet al., 2018).
MicroRNAs (miRNAs or miR-) are a subclass of sin- gle-stranded small noncoding RNAs with about 21–25 nucleotides long that are endogenously produced and found in diverse organisms, including humans. They play important gene-regulatory roles by pairing to the 30-untranslated region (30UTR) of mRNAs of protein- coding genes to direct their posttranscriptional regula- tion, mainly by repressing their expression (Wahid et al., 2010). For any given miRNA, there are a large number of potential target sites, even within the same gene, with a number of factors influencing miRNA- mRNA interactions (Lim et al., 2005). Recently, both tissue and circulating miRNAs have arisen as efficient and specific biomarkers for different types of cancer and metastases, having specific expression profiles (Heet al., 2015). Particularly, circulating miRNAs can be of inter- est, due to their high stability and easy quantification in biofluids (Chenet al., 2008), being key components of liquid biopsies, which are more and more replacing tra- ditional biopsies for diagnosis and prognosis of cancer (Karachaliouet al., 2015).
Despite the emerging role of miRNAs in different types of cancers and metastases, data about their expression pattern in BC brain metastasis (BCBM) are limited. This prompted us to profile miRNAs along BCBM development, identify their target genes, assess the corresponding protein expression in the mouse brain, and further validate their presence in resected brain metastasis samples from BC patients.
2. Materials and methods
2.1. Cell culture and mouse model of breast cancer brain metastasis
A mouse model of BCBM, relying on the inoculation of murine mammary carcinoma triple-negative 4T1 cells in the carotid artery of Balb/c mice, was used.
4T1 cells, purchased from ATCC (Middlesex, UK), were maintained in RPMI 1640 Medium (PAN Bio- tech, Aidenbach, Germany) supplemented with ultra- glutamine I (Lonza, Basel, Switzerland) and 5% heat- inactivated fetal bovine serum (PAN Biotech) in a 5%
CO2 atmosphere at 37 °C. These metastatic BCCs (19106 cells in a total volume of 200 µL of Ringer- HEPES) were xenografted, under isoflurane anesthesia, in the right common carotid artery of 7- to 8-week-old female Balb/c mice, purchased from Charles River Laboratories (Wilmington, MA, USA). Control mice were inoculated with Ringer-HEPES. Mice were housed and bred in the animal facility of the Biologi- cal Research Centre, Szeged, Hungary. Plasma samples were collected (n=5), and brains, lungs, kidneys, and livers were harvested (n =6), 5 h, 3 days, 7 days, or 10 days postinoculation.
All animal experimentation was performed by cer- tified team members at the Biological Research Cen- tre, according to the recommendations of the Declaration of Helsinki and Tokyo, and was per- formed according to the EU Directive 2010/63/EU on the protection of animals used for experimental and other scientific purposes. The protocol was reviewed and approved by the Regional Animal Health and Food Control Station of Csongrad
County (license numbers: XVI./2980/2012 and XVI./
764/2018).
2.1.1. Plasma sample collection
Blood samples were collected for analysis of miRNA expression in plasma by next-generation sequencing (NGS) and further validation by quantitative real- time polymerase chain reaction (qPCR). Approxi- mately 500µL blood samples were collected directly from the heart of live mice under isoflurane anesthe- sia. The samples were collected using syringes previ- ously washed with ethylenediaminetetraacetic acid (EDTA, 0.5M, pH 8.0) into tubes containing 40 µL of the anticoagulant. After collection, the blood sam- ples were centrifuged for 10 min at 380 g, at 4°C, and the plasma was collected. The plasma samples were stored at 80 °C until further analysis.
2.1.2. Organ collection
For histological analysis of metastasis development in selected brain regions and in peripheral organs, brains, lungs, kidneys, and livers were harvested at the differ- ent timepoints after injection. Anesthetized mice were perfused with 50 mL of phosphate-buffered saline (PBS), followed by 25 mL of 4% paraformaldehyde in PBS to fix the tissues. The brains, lungs, kidneys, and livers were harvested and postfixed overnight in 4%
paraformaldehyde in PBS at 4°C and afterward were kept in PBS containing 0.1% sodium azide. The cere- bellum, cranial hippocampus, and striatum (coronal sections at 6.12, 1.82, and 0.5 mm Bregma coordi- nates, respectively), as well as lungs, kidneys, and liv- ers, were paraffin-embedded and serially cut into 4- lm-thick sections.
2.2. Human brain metastasis samples
Six-micrometre-thick paraffin-embedded sections of resected human brain metastases were obtained from the Department of Pathology of the University of Szeged, Szeged, Hungary. Samples were collected from female patients (n =4), with stage IV triple-negative breast cancer with well-established brain metastases.
Human samples were collected in accordance with the permission of the Human Investigation Review Board, University of Szeged (Permit number: EMLOSEB001, project title: Retrospective analysis of surgical samples of breast cancer patients), issued on January 31, 2017, in agreement with the Declaration of Helsinki of the World Medical Association.
2.3. Histological and immunofluorescence analysis
2.3.1. Hematoxylin–eosin staining
For hematoxylin–eosin staining, the tissue was deparaf- finized in xylene (Klinipath, Duiven, Netherlands) (10 min), rehydrated in successive ethanol solutions (100% ethanol for 3 min, 96% ethanol for 3 min, and 70% ethanol for 3 min), and in tap water (1 min). The nuclei were stained with Papanicolaou’s solution 1a Har- ris’ hematoxylin solution (Merck Millipore, Darmstadt, Germany) for 10 min. Sections were then differentiated using a solution of 1% hydrochloric acid in 70% ethanol (20 s) and bluing in 1% ammonia water (10 s). The cyto- plasm was stained with eosin Y solution 0.5% alcoholic (Merck Millipore) for 2 min. Finally, sections were dehy- drated in a series of alcohols (70% ethanol for 3 min, 96% ethanol for 3 min, and 100% ethanol for 3 min) and diaphanized in xylol for 4 min and finally mounted with Quick-D Mounting Medium (Klinipath).
Photographs of hematoxylin–eosin staining were acquired with an Olympus BX51 Microscope equipped with DP50 digital camera and Olympus Plan Apo objectives (Labocontrole, Lisbon, Portugal). For anal- ysis of metastasis extension and distribution, the area of metastases in each brain region and peripheral organs was measured in 10 fields per organ or region, at each timepoint, using IMAGEJ 1.29x software (National Institutes of Health, USA). The results are presented as the ratio of tumor area to tissue area.
2.3.2. Immunofluorescence
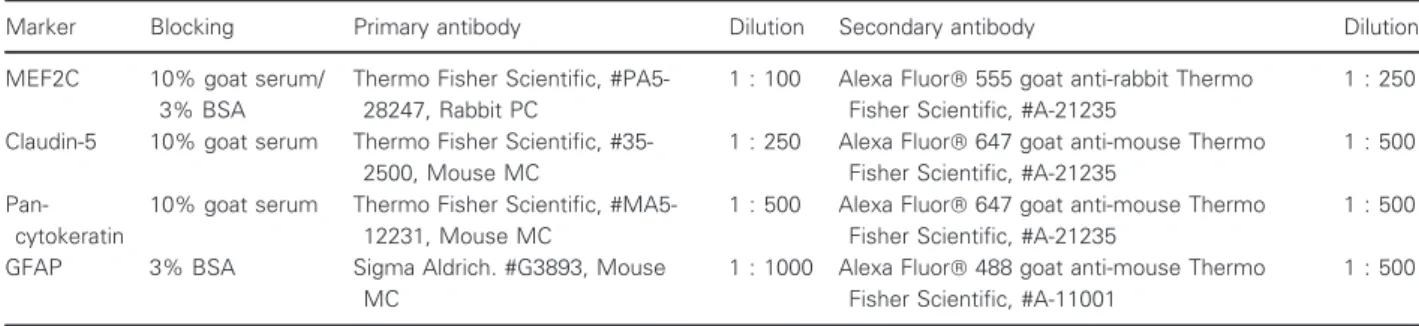
Brain sections were processed for immunofluorescence analysis of myocyte enhancer factor 2(MEF2)C, clau- din-5, pan-cytokeratin, and glial fibrillary acidic pro- tein (GFAP). The experimental conditions are described below and summarized in Table 1. Sections were deparaffinized in xylene (20 min) and rehydrated through successive immersion in 100% ethanol (20 min), 96% ethanol (10 min), 70% ethanol (10 min), and finally tap water (10 min). Heat-medi- ated antigen retrieval was performed with 10 mM
citrate buffer pH 6.0 during 15 min in the microwave.
A permeabilization step was performed with 0.5% Tri- ton X-100 for 15 min, and tissue sections were blocked with the appropriate blocking solutions for 60 min.
The primary antibodies were diluted in the respective blocking solutions with 0.5% Triton X-100, and sec- tions were incubated overnight at 4°C. Then, the incubation with the respective fluorescently labeled
secondary antibody diluted in the respective blocking solutions with 0.5% Triton X-100 was performed dur- ing 60 min at room temperature. Between the several steps after the antigen retrieval treatment, washes with PBS (10 min) were performed. Negative controls with omission of primary antibodies were performed to exclude nonspecific binding or cross-reactivity. Nuclei were labeled with Hoechst 33342 dye diluted 1 : 1000 in PBS for 10 min, followed by mounting with Slow- Fade Diamond Antifade Mountant (both from Thermo Fisher Scientific, Waltham, MA, USA).
Thin optical images (c. 3µm thick) were acquired using a Leica SP-E confocal microscope (Leica Micro- sistemas, Lisbon, Portugal), equipped with 488, 532, and 635 nm lasers and operating in the mode 10249 1024, 400 Hz (c. 1/3 s per frame). For immunofluorescence analysis, ten fields of the cranial hippocampus (the brain region more prone to metastasis development) of each animal were acquired under the same conditions; MEF2C expression was analyzed based on the evaluation of total fluorescence by tumor area, determined by delimitation of each metastasis, using IMAGEJ software. Results were expressed as fluo- rescence intensity bylm2of tumor area. For evaluation of MEF2C nuclear translocation in metastasis, the num- ber of cells with nuclear expression in each metastasis was counted and compared with the total number of cells in each metastasis. The results were presented in percentage of cells with MEF2C nuclear expression.
2.4. miRNA analysis
2.4.1. Next-generation sequencing
For the NGS analysis, RNA was extracted from 50 to 200µL of plasma using Norgen’s Plasma/Serum RNA Purification Mini Kit and eluted in 25µL. Due to small amounts of RNA, samples from the same treat- ment were pooled and 48 ng of RNA was used for
library preparation using Illumina’s TruSeq Small RNA Kit (Illumina, San Diego, CA, USA). Samples were indexed accordingly for multiplexing, and 15 cycles of PCR amplification were performed. To obtain the desired product size, a BluePippin isolation (Sage Science Inc., Beverly, MA, USA) using a 3%
agarose gel and gated at 120–140 bp, followed with a clean-up using AMPure XP beads, was performed. To confirm that the desired product was selected, the cleaned-up library-prepped samples were run on Agi- lent’s Bioanalyzer using a High Sensitivity DNA chip.
These samples were run on a MiSeq v3 Reagent Kit flow cell from Illumina, performing 85 SR cycles. The resulting FASTQ files were uploaded into Genboree Workbench (genboree.org) where miRNA read counts were determined using the exceRpt small RNA-seq Pipeline v4.6.2 and compared against mouse genome mm10 (Gene Expression Omnibus # GSE136149).
2.4.2. RNA extraction, cDNA preparation, and qPCR For the qPCR, we first isolated total RNA from the plasma samples using the miRCURY RNA Isolation Kit for biofluids (Exiqon, Vedbaek, Denmark), accord- ing to manufacturer’s instruction. RNA was then tran- scribed into cDNA, using the reverse transcription kit Universal cDNA Synthesis Kit II (Exiqon), according to manufacturer’s instructions for plasma. However, the initial RNA volume was increased four times in a final volume of reaction of 15µL. Prior to the reverse transcription reaction, the synthetic RNA Spike-in Uni-SP6 (Exiqon) was added to the mixture. The reac- tion was performed on a Bio-Rad iQ5 thermocycler, using the following conditions: 42°C for 60 min;
95°C for 5 min to heat-inactivate the reverse tran- scriptase; and cooling down and storage at 4°C. The qPCR was performed using the same equipment and miRCURY LNA SYBR Green PCR Kit (Exiqon) according to manufacturer’s instructions using cDNA diluted at 1 : 6. The following conditions were used:
Table 1.Summary of the experimental conditions used for immunofluorescence analysis of brain tissue.
Marker Blocking Primary antibody Dilution Secondary antibody Dilution
MEF2C 10% goat serum/
3% BSA
Thermo Fisher Scientific, #PA5- 28247, Rabbit PC
1 : 100 Alexa Fluor555 goat anti-rabbit Thermo Fisher Scientific, #A-21235
1 : 250 Claudin-5 10% goat serum Thermo Fisher Scientific, #35-
2500, Mouse MC
1 : 250 Alexa Fluor647 goat anti-mouse Thermo Fisher Scientific, #A-21235
1 : 500 Pan-
cytokeratin
10% goat serum Thermo Fisher Scientific, #MA5- 12231, Mouse MC
1 : 500 Alexa Fluor647 goat anti-mouse Thermo Fisher Scientific, #A-21235
1 : 500
GFAP 3% BSA Sigma Aldrich. #G3893, Mouse
MC
1 : 1000 Alexa Fluor488 goat anti-mouse Thermo Fisher Scientific, #A-11001
1 : 500
BSA, bovine serum albumin; GFAP, glial fibrillary acidic protein; MC, monoclonal; MEF2C, myocyte enhancer factor 2C; PC, polyclonal.
50 cycles of 95°C for 15 s, 56°C for 30 s, 72°C for 30 s, and a ramp rate of 1.6°Cs1, followed by a melting curve analysis. Predesigned LNA primer pairs were purchased from Exiqon for each of the selected miRNAs (mmu-miR-802-5p, mmu-miR-194-5p) and for miR-16-5p that was used as an endogenous control to normalize the expression level. qPCR was per- formed in 96-well plates, with each sample performed in triplicate, and a no-template control was included for each amplification. Determination of the threshold cycle was performed using the BIO-RAD IQ5 THERMOCY- CLER’S software, while the quantitation was determined by the comparative Ct method. The results were pre- sented as fold change (FC). For quality control, the PCR products were run by electrophoresis on a 4%
agarose gel (1% Agarose+3% NuSieve Agarose) for 1 h at 100 mV to confirm the presence and expected size of the PCR products.
2.5. Bioinformatical target prediction
To predict possible targets of each miRNA, a bioinfor- matical analysis was performed using two different tar- get prediction tools, available online:TARGETSCANv.7.2 (Agarwal et al., 2015) and DIANA TOOLS MICROT-CDS
v.5.0. (MDet al., 2013).TARGETSCAN categorizes miR- NAs by the state of the families’ conservation. ForDI- ANA TOOLS MICROT-CDS, a threshold of 0.7 was applied as recommended by the software. The results of the target prediction were sorted by the scores obtained with TARGETSCAN (cumulative weighted context ++
score, total context score, and aggregate PCT) and withDIANA TOOLS microT-CDS (miTG). Total context score is the sum of the contribution of 14 features for each of the four seed site types, with the most nega- tive total context score value representing the highest probability of repression. The cumulative weighted context score was calculated using total context scores and cumulative predicted repression at different sites existing in a target mRNA. It estimates the total repression expected from multiple sites of the same miRNA for each target. Values can be between 1 and 1, but the more negative the value, the greater the repression (Agarwal et al., 2015). It is the most rele- vant score, regarding efficacy of repression prediction byTARGETSCAN, which also gives a probability of pref- erentially conserved targeting, the aggregate PCT. This score is an estimate of the probability that a site is conserved due to the maintenance of miRNA target- ing, rather than by chance or any other reason not pertinent to miRNA targeting (Friedmanet al., 2009).
Finally, the miTG score, calculated byDIANA TOOLS, is a general score for the predicted interaction. The
higher the score, the greater the confidence (Riffo- Campos et al., 2016). The results obtained with both tools were compared, and only the targets predicted by both tools were considered. Due to the high number of predicted targets for some miRNAs, a bibliographi- cal search was done to select the targets with more rel- evance for further validation.
2.6. Statistical analysis
Results were analyzed using GRAPHPAD PRISM 5.0 (GraphPad Software, San Diego, CA, USA).
Immunofluorescence and hematoxylin–eosin results are expressed as mean SEM. A one-way ANOVA, fol- lowed by the Bonferronipost hoctest, was used to eval- uate whether there were statistically significant changes in parameters measured by immunofluorescence and hematoxylin–eosin, between the different timepoints and studied organs or brain regions. qPCR results are expressed as mean SD. A two-tailedt-test was used to evaluate whether there were significant changes in the expression of the different miRNAs in the 4T1 group, when comparing to the control group. P values<0.05 were considered statistically significant.
3. Results
3.1. Well-established metastases are detected in the brain from 7 days onwards after inoculation of breast cancer cells
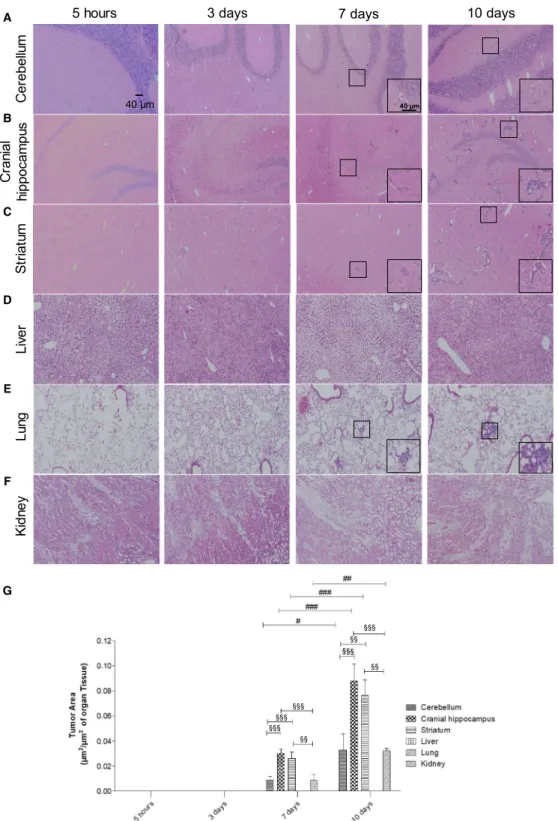
To check the metastatic pattern in the used animal model, the tumor area was determined at different time- points after injection of the tumor cells (5 h, 3, 7, and 10 days), in three brain regions (cerebellum, cranial hip- pocampus, and striatum), as well as in peripheral organs (lungs, kidney, and liver). Observation of hematoxylin– eosin-stained brain sections revealed that at 5 h and 3 days, no metastases were detectable in any of the stud- ied regions, whereas their presence was detected at 7 days and even more at 10 days (Fig. 1A–C). Regard- ing the peripheral organs, metastases were only detected in the lungs (Fig. 1D–F). Analysis of metastasis area revealed that the most affected brain region both at 7 and 10 days was the cranial hippocampus, immediately followed by the striatum, while the least affected one was the cerebellum (Fig. 1G). It also revealed that the tumoral area in the lungs was similar to that of the least affected brain region. These results show that 4T1 cells in this mouse model preferentially metastasize to the brain; therefore, this is a good in vivo model for the study of peripheral events associated with brain
metastasization. Since the brain region with the highest tumoral area was the cranial hippocampus, this region was selected for the subsequent brain analyses.
3.2. miRNAs are aberrantly expressed in plasma of 4T1-injected mice along the metastasization process
As previously mentioned, it has been suggested that different types of metastasis can have unique circulat- ing miRNA signatures (Rosenfeld et al., 2008). How- ever, no specific miRNA profile has yet been described for BCBM. So, once the metastatic profile of this model was established, our aim was to identify the specific circulating miRNA signature of BCBM by finding aberrantly expressed miRNAs. To this end, plasma samples collected from 4T1-injected mice and from controls at 3, 7, and 10 days were subjected to NGS analysis. To render feasible the analysis of the large data obtained from the NGS analysis, we estab- lished as arbitrary criteria the miRNAs that were upregulated or downregulated, with FC >2.0 or FC
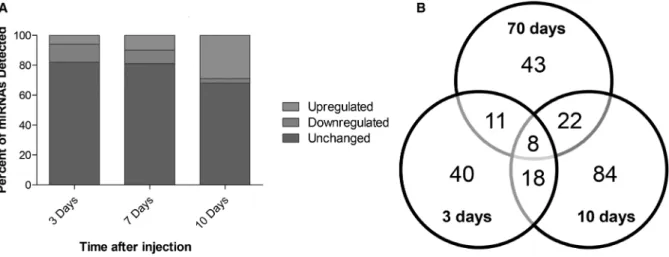
<0.5, respectively. Although most miRNAs remained unchanged for all the timepoints, the percentage of deregulated ones increased with time (Fig. 2A). While at 3 and 7 days ~18% of the miRNAs were deregu- lated, that percentage increased to ~30% at 10 days.
An interesting observation within the deregulated miR- NAs was that throughout time, the number of down- regulated miRNAs decreased, while the number of upregulated ones increased. In fact, at 3 days 77 miR- NAs were found to be altered (Fig. 2B), 52 of which were downregulated, while the remaining 25 were upregulated; so, more than half of the deregulated miRNAs were downregulated. At 7 days, 84 miRNAs were deregulated but approximately half of the miR- NAs were upregulated (43 miRNAs). Contrarily, at 10 days, a total of 133 miRNAs were deregulated but only 11 of them were downregulated, while the remaining 122 were upregulated. So, besides having more deregulated miRNAs at 10 days, the number of upregulated miRNAs suffered a dramatic increase, comparing to 3 and 7 days. Moreover, comparison between the altered miRNAs among the different time- points revealed that they were not all the same in all the timepoints. Indeed, while most miRNAs were solely deregulated at a single timepoint, only eight miRNAs were altered at 3, 7, and 10 days after injec- tion of the 4T1 cells (Fig. 2B), namely miR-34c-3p, miR-335-3p, miR-708-3p, miR-690, miR-340-3p, miR- 425-3p, miR-130a-5p, and miR-449a-5p. Altogether, these results demonstrated that the miRNA signature varies throughout time and that those that are altered
prior to metastasis are not necessarily the same that are deregulated in more advanced stages of the tumor.
These results also showed that at more advanced stages of tumor progression, miRNAs tend to be more upregulated than in earlier stages.
3.3. A specific set of miRNAs is aberrantly expressed prior to detectable metastasis formation
Since the high number of altered miRNAs (Fig. 2B) precludes the validation of all of them, we selected for further analysis the miRNAs with the highest expres- sion considering those with read counts higher than 20 000, either in the control samples or in 4T1-injected samples. In these conditions, the number of aberrantly expressed miRNAs was 8, 7, and 39, at 3, 7, and 10 days, respectively (Fig. 3A). Considering the rele- vance that precociously altered miRNAs in plasma may have as potential biomarkers of brain metastasis development, we focused our studies in those altered at 3 days (prior to brain metastasis detection) and pre- sent the miRNAs that were deregulated at 7 and 10 days in Tables S1 and S2. Among the altered miR- NAs at 3 days, five were downregulated (miR-194-5p, miR-802-5p, miR-17-3p, miR-145-5p, and miR-338- 3p), while three were upregulated (miR-205-5p, miR- 92a-1-5p, and miR-181a-1-3p), as indicated in Fig. 3B.
None of these maintained a deregulated expression throughout the three timepoints, indicating that their aberrant expression is characteristic of early stages of BCBM progression.
3.4. Target prediction for the selected miRNAs, through a bioinformatical approach
Once aberrantly expressed miRNAs were identified, we further wanted to identify their targets with relevance for the development of BCBM. However, the high number of single miRNA targets and miRNA-mRNA interactions, and the fact that they are influenced by numerous conditions, renders challenging their correct identification. Nowadays, numerous web-based bioin- formatical tools provide algorithms to predict potential miRNA target genes and interactions, which allows narrowing down the potential targets for experimental validation. So, a bioinformatical prediction of the tar- gets for each of the miRNAs with an early aberrant expression (Fig. 3B) was performed usingTARGETSCAN
v.7.2 and DIANA TOOLS MICROT-CDS v.5.0. The selected miRNAs were entered in both tools according to the following descriptives: mmu-miR-194-5p, mmu-miR- 802-5p, miR-17-3p, mmu-145-5p, miR-338-3p, mmu-
lainarC supmacoppihmullebereCStriatum
5 hours 3 days 7 days 10 days
LungLiverKidney
40 μm 40 μm
§§§
§§§
§§§
§§
§§
§§
§§§
A
B
C
D
E
F
G
Fig. 1.Profile of breast cancer metastases in the brain and peripheral organs. Hematoxylin–eosin staining of cerebellum (A), cranial hippocampus (B), striatum (C), liver (D), lung (E), and kidney (F) was performed, and the tumor area was quantified (G) at several timepoints after inoculation of triple-negative breast cancer cells in 7- to 8-week-old female Balb/c mice (n= 6). Insets show the magnification of the selected representative metastasis (inside the squares). The results are expressed as meanSEM. A one-way ANOVA, followed by the Bonferronipost hoctest, was used to evaluate the significant changes in parameters, between the different timepoints and studied organs.
#P<0.05,##P<0.01, and###P<0.001 between indicated timepoints, for the same regions;§§P<0.01 and§§§P<0.001 between indicated regions for the same timepoint.
miR-205-5p, mmu-miR-92a-1-5p, and mmu-miR-181a- 1-3p. Conservation is an important aspect of miRNA target prediction, and poorly conserved miRNAs lead to less reliable results. Using TARGETSCAN v.7.2, miR- 17-3p, miR-92a-1-5p, and miR-181a-1-3p were consid- ered part of the poorly conserved miRNA families,
while the remaining miRNAs were part of the broadly conserved miRNA families. To strengthen the reliabil- ity of the results, the predicted targets from each of the tools were compared and only those identified by both were considered. Table 2 summarizes the number of predicted targets by each tool and the common
Fig. 2.Overview of the next-generation sequencing (NGS) results, regarding the altered expression of microRNAs (miRNAs) in plasma along brain metastasization of breast cancer. Plasma samples were collected at several timepoints after inoculation of triple-negative breast cancer cells, or vehicle (control), in 7- to 8-week-old female Balb/c mice. NGS miRNA analysis was performed, followed by analysis of the number of miRNAs whose expression was altered in comparison with the corresponding timepoint control. miRNAs with fold change from control>2.0 were considered to be significantly upregulated, while miRNAs with fold change<0.5 were considered to be downregulated.
The remaining miRNAs were considered unchanged. The percentage of upregulated, downregulated, or unchanged miRNAs was calculated for each timepoint (A). Venn diagram indicating the number of overlapping and nonoverlapping deregulated miRNAs in the three studied timepoints (B).
A B
miR-19 4-5
p
miR-8 02-5p
miR -17-3
p
miR- 145-5p
miR-33 8-3p
miR-2 05-5p miR
-92a- 1-5p
miR-1 81a-
1-3 0 p
1 2 3 4 syad3tasANRimfonoisserpxederetlA )lortnocsvegnahCdloF(
Fig. 3.Up- and downregulated microRNAs (miRNAs) with read counts higher than 20 000, throughout metastatic progression and specific miRNAs that were altered prior to metastasis and selected for further studies. Next-generation sequencing results were narrowed down based on their fold change from control and read counts, and only the miRNAs with read counts higher than 20 000 were considered for each timepoint (A). At the timepoint of interest for this study (3 days), eight miRNAs were identified, five of which were downregulated (fold change<0.5), while three were upregulated (fold change>2.0) (B).
ones, and Tables S3–S10 indicate the results of the bioinformatical analysis for each miRNA.
It is evident by the results presented in Table 2 that this type of bioinformatical prediction of the genes repressed by specific miRNAs generates huge amounts of information. Therefore, it would be very time- and cost-consuming, and thus not reasonable, to experi- mentally validate all the targets. So, we performed a bibliographical search for the predicted targets. This search was directed to the proteins that have been related to BCBM, as well as with other processes that can be relevant for metastatic progression, including angiogenesis, disruption of the BBB, and invasion, among others. Besides proteins that have been described in BC, other types of cancers like brain tumors were also considered. Since miRNAs mainly work by negatively regulating gene expression, for the downregulated miRNAs (miR-194-5p, miR-802-5p, miR-17-3p, miR-145-5p, and miR-338-3p), we looked for oncogenic proteins, while for the upregulated miR- NAs (miR-205-5p, miR-92a-1-5p, and miR-181a-1-3p),
we looked for tumor-suppressive proteins with a potential role in BCBM. Based on this bibliographic search, we selected miR-802-5p and miR-194-5p as the miRNAs of higher interest to further study, since these miRNAs have been shown to have tumor-suppressive roles in different types of cancer. While miR-802-5p was shown to decrease the proliferation of BCCs, through the downregulation of FoxM1 (Yuan and Wang, 2015), miR-194-5p has also been described to inhibit the proliferation and migration of BC, both in vivo and in vitro, though no specific targets were proposed (Le et al., 2012). Therefore, the downregulation of miR-802-5p and miR-194-5p observed in our study at 3 days postinjection of 4T1 cells (Fig. 3B) is in line with a tumor suppressor role of these miRNAs. Based on the scores previously obtained, some targets with oncogenic functions were identified (Table 3). Among them was MEF2C, which appeared as a common tar- get of both miR-802-5p and miR-194-5p, and was therefore selected for further studies.
3.5. Validation of miR-802-5p and miR-194-5p by qPCR
NGS analysis is a very useful tool that enabled us to identify the changes in the plasma miRNome during brain metastasization. However, NGS of miRNAs is subject to sequencing errors and the search and removal of adapter sequences can also influence the results, with risk of false positives or negatives (Git et al., 2010). Thus, to validate the aberrant expression of the selected miRNAs in plasma at 3 days, qPCR analysis of miR-802-5p and miR-194-5p was per- formed. Without a consensus about the ideal reference gene to study miRNA expression in plasma, we opted for miR-16-5p because it has been demonstrated to be stably expressed in plasma of several different mouse
Table 2.Number of miRNA targets revealed by the bioinformatical target prediction, using TARGETSCAN v.7.2, DIANA TOOLS MICROT-CDS
v.5.0, or both.
miRNA TARGETSCAN
DIANA TOOLS MICROT-CDS
Common targets
miR-194-5p 305 551 169
miR-802-5p 251 666 140
miR-17-3p 4335 464 261
miR-145a-5p 539 706 224
miR-338-3p 342 745 158
miR-205-5p 374 925 207
miR-92a-1-5p 1982 227 76
miR-181a-1- 3p
479 16 1
Table 3.Predicted targets for microRNA (miR)-802-5p and miR-194-5p based on the bioinformatical analysis and a bibliographic research.
miRNA Target gene Name Weighted context score Aggregate PCT miTG
miR-802-5p MSI1 Musashi RNA-binding protein-1 0.43 0.67 0.8566
RHOA RAS homolog family member A 0.38 0.34 0.8175
TCF4 Transcription factor 4 0.18 0.19 0.9751
CDH11 cadherin 11, type 2, OB-cadherin (osteoblast) 0.3 0.55 0.8580
CCND2 Cyclin D2 0.10 0.32 0.8698
MEF2C Myocyte enhancer factor 2C 0.03 0.71 0.9523
miR-194-5p STAT1 Signal transducer and activator of transcription 1 0.45 <0.10 0.7627
RAP2B RAP2B, member of RAS oncogene family 0.44 0.79 0.8139
HBEGF Heparin-binding EGF-like growth factor 0.25 0.69 0.993
AKT2 v-akt murine thymoma viral oncogene homolog 2 0.15 0.53 0.7733
MEF2C Myocyte enhancer factor 2C 0.16 0.55 0.7413
CHD2 Cadherin 2, type 1, N-cadherin (neuronal) 0.17 0.55 0.7967
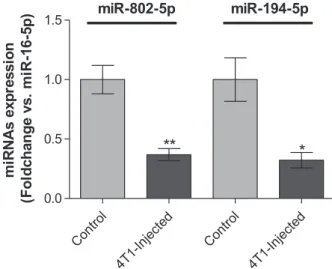
strains at different ages and disease conditions (Mi et al., 2012). Moreover, Rinnerthaler et al.(2016) have demonstrated that miR-16-5p is also stably expressed in breast cancer tissues, both from primary and meta- static sites, indicating that it is a good housekeeping gene for our study, which was further confirmed by qPCR data. qPCR results (Fig. 4) allowed to validate the downregulation of miR-802-5p (P <0.01) and of miR-194-5p (P< 0.05) in plasma of 4T1-injected mice, when comparing to controls, at 3 days postinjection.
Moreover, the qPCR analysis gave alterations in the same order of magnitude of NGS (Table 4), thus vali- dating the downregulation of miR-802-5p and miR- 194-5p. So, the results of both qPCR and NGS tech- niques revealed the downregulation of miR-802-5p and
miR-194-5p, pointing to these miRNAs as efficient predictors of the upcoming occurrence of brain metas- tasis in cases of BC.
3.6. MEF2C, a predicted target of both miR-802- 5p and miR-194-5p, is highly expressed in breast cancer brain metastasis
MEF2C, a member of the family of transcription fac- tors MEF2, was initially described to be activated dur- ing embryogenesis to regulate tissue-specific gene expression and promote organ development, and is nowadays recognized to be also expressed during adult life in many types of cells, including neuronal and endothelial cells (Donget al., 2017). Although there is yet no proof of MEF2C involvement in the brain metastasization process, it has been proposed as a novel candidate oncogene, though evidence is limited to very few types of malignancies (Bai et al., 2015;
Zhanget al., 2014).
The MEF2C gene was predicted as a target for miR-802-5p (Table 3). Although for the repression of MEF2C by miR-802-5p, the cumulative weighted con- text score ++ was low (cumulative weighted context score ++ =0.03), the miTG was quite high (miTG=0.9523), and, among the predicted targets, it was the one with the highest PCT (PCT= 0.71).
Moreover, MEF2C was also a predicted target for miR-194-5p, the other miRNA that was validated as being downregulated in plasma (cumulative weighted context score ++ =0.16; miTG= 0.74; PCT= 0.55).
Altogether, this strengthens the possibility that MEF2C is involved in the brain metastasization pro- cess. In order to confirm this hypothesis, we assessed MEF2C expression in the brain parenchyma, during metastatic development (Fig. 5). Due to its previously described role in endothelial cells and angiogenesis (Maiti et al., 2008), we studied its expression by immunofluorescence together with claudin-5, a protein highly expressed in brain endothelial tight junctions (Cardoso et al., 2010). Curiously, no colocalization was detected between claudin-5 and MEF2C but MEF2C expression was found in perivascular cells at an early timepoint of metastatic development (3 days) (Fig. 5A). To confirm the nature of these cells, we double-labeled MEF2C with pan-cytokeratin, an epithelial marker expressed by malignant cells in the currently used model. Indeed, we observed a colocal- ization of MEF2C with pan-cytokeratin and could confirm that from 3 days onwards, MEF2C is highly expressed in isolated malignant cells and in well-estab- lished metastases (Fig. 5B). Analysis of MEF2C immunoreactivity showed a 24% increase in MEF2C Contro
l
4T1-Inject ed
Contro l
4T1-Injecte d 0.0
0.5 1.0
1.5 miR-802-5p miR-194-5p
** *
noisserpxe sANRim )p5-61-Rim .sv egnahcdloF(
Fig. 4.Validation of the next-generation sequencing (NGS) results by quantitative real-time PCR (qPCR) for microRNA (miR)-802-5p and miR-194-5p. Plasma samples were collected 3 days after injection of 4T1 cells or vehicle (control) in female Balb/c mice.
Expression of miR-802-5p (n= 5) and miR-194-5p (n= 3) was evaluated by qPCR. Results are shown as mean valuesSD and expressed as fold change vs. miR-16-5p (endogenous control).
*P<0.05 and **P<0.01 vs. control, by a two-tailed unpaired Student’st-test.
Table 4. Comparison of next-generation sequencing (NGS) and quantitative real-time polymerase chain reaction (qPCR) data regarding microRNAs (miRNAs or miR) aberrant expression in 4T1- injected mice.
miRNA
NGS qPCR
Fold change Fold change P-value
miR-802-5p 0.1890 0.3682 <0.01
miR-194-5p 0.4471 0.3180 <0.05
3 syad5 sruohlortnoC10 days7 syad
MEF2C + Claudin-5 MEF2C + Pan-cytokeratin MEF2C
Claudin-5 Pan-CytokeratinMEF2C
20 µm 20 µm
A B
C D
expression/tumor area in metastasis throughout time, between 3 and 10 days (P< 0.01) and a 20% elevation between 7 and 10 days (P<0.01) (Fig. 5C). These results showed that MEF2C is not expressed in endothelial cells, but it is highly expressed in brain metastatic cells and in well-established metastasis.
Moreover, MEF2C was increasingly expressed by tumor cells throughout time, which supports the involvement of this transcription factor in metastasis development.
3.7. MEF2C translocates to the nucleus in advanced stages of metastasis development MEF2C is known to be a transcription factor, syn- thetized in the cytoplasm and translocated into the nucleus after activation (Liu et al., 2018). Indeed, MEF2C was mostly concentrated in the cytoplasm at 3 and 7 days, while at 10 days following inoculation of malignant cells, it was homogenously expressed between the nucleus and the cytoplasm (Fig. 5). An analysis of the number of cells with nuclear staining per metastasis for the different timepoints showed that there was a significant increase of the percentage of cells with nuclear staining of approximately 29%
between 3 and 10 days (P<0.005) and of 32%
between 7 and 10 days (P <0.01) with no significant differences between 3 and 7 days (Fig. 5D). These results showed that there is a nuclear translocation of MEF2C with metastasis enlargement, indicating that MEF2C is more active in later stages of the metastatic development and pointing to this transcription factor as a new player in BCBM and a potential target for modulation.
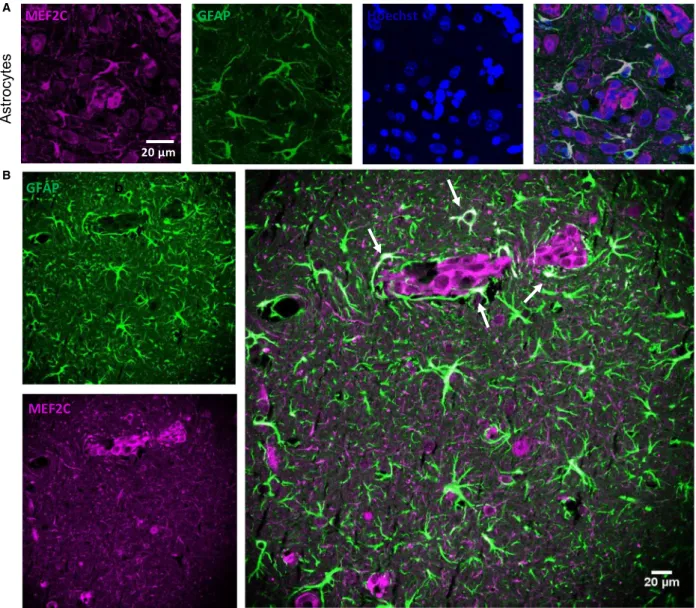
3.8. MEF2C is highly expressed by peritumoral astrocytes
Cells belonging to the neurovascular unit, including microglia and astrocytes, are known to interact with malignant cells after the transmigration through the BBB (Hasko et al., 2019). An interesting observation from this study was the MEF2C expression in star- shaped cells close to the metastatic lesions, as early as
at 3 days, but not in controls (Fig. 5B). A double staining with GFAP, a marker for astrocytes, showed colocalization with MEF2C in such star-shaped cells (Fig. 6A,B). Curiously, not all GFAP-expressing cells expressed MEF2C, as MEF2C labeling was mainly found in GFAP-expressing cells close to metastases (Fig. 6B), contrary to the ones that were further away from the tumors and that only expressed GFAP. These results reveal that peritumoral astrocytes, rather than distant ones, express MEF2C, pointing to a role of MEF2C in the crosstalk between tumor cells and astrocytes.
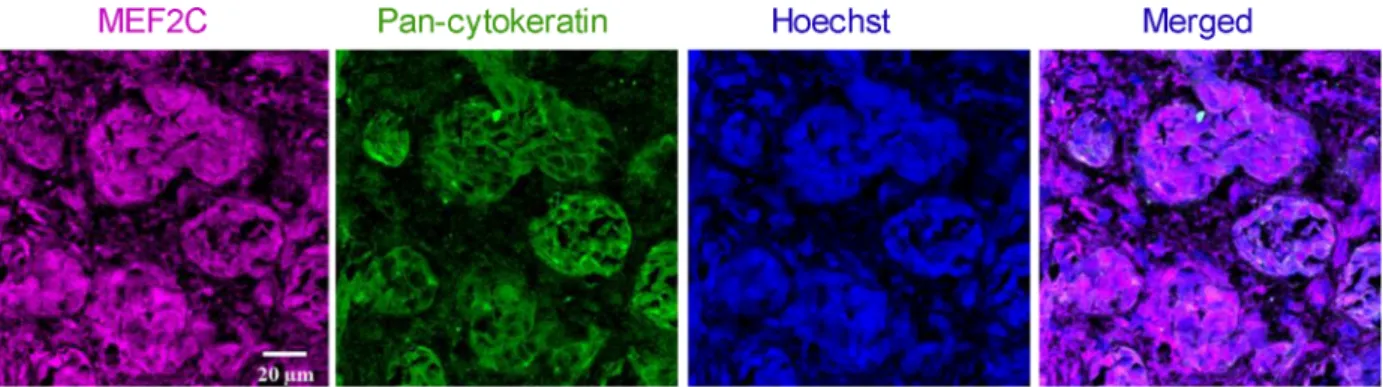
3.9. MEF2C is highly expressed in resected brain metastases from triple-negative breast cancer patients
To understand whether the results obtained in mouse brain sections are translatable to humans, we per- formed immunofluorescence analysis of sections from resected brain metastases, derived from triple-negative BC in human patients. To distinguish tumoral from peripheral tissue, a double staining with pan-cytoker- atin was performed. As shown in Fig. 7, MEF2C expression was observed in metastasis, as corroborated by the double labeling with pan-cytokeratin showing the colocalization of the transcription factor and the epithelial marker expressed by BC cells in brain metas- tasis. Altogether, these results show that MEF2C is expressed in triple-negative breast carcinoma brain metastases.
4. Discussion
Due to the improved techniques for early detection of BC, together with the development of better ther- apeutic approaches, metastases are presently the major problem in oncology. Brain metastases are particularly challenging since they are usually detected upon appearance of clinical manifestations, which corresponds to a stage of the disease with poor prognosis, inasmuch as the BBB restricts the therapeutic options. Therefore, discovery of early biomarkers of brain metastasization and novel
Fig. 5.Myocyte enhancer factor 2C (MEF2C) expression in the brain parenchyma along brain metastasization. Immunofluorescence analysis of MEF2C in brain sections for different timepoints after 4T1 or vehicle (control) injection. Double labeling with claudin-5 showed that MEF2C is not expressed in endothelial cells but only in perivascular cells (A). Double labeling immunofluorescence analysis of MEF2C and pan-cytokeratin revealed that MEF2C-positive cells are tumor cells (B). MEF2C labeling was also observed in other star-shaped cells (arrows) (B). Semiquantitative analysis of MEF2C expression along time showed an increasing expression in tumor cells (C) and an increasing nuclear translocation of MEF2C (D). Results are expressed as meanSEM. A one-way ANOVA, followed by the Bonferronipost hoctest, was used to evaluate the significant changes in the parameters between the different timepoints.##P<0.01 between indicated groups.
targets for modulation are needed for a precocious intervention and improvement of the patients’ out- come. Based on the fact that circulating miRNAs have increasingly been recognized as specific and sensitive biomarkers of different types of cancer (Wang et al., 2018), we hypothesized that miRNAs are aberrantly expressed in plasma samples prior to the establishment of brain metastases and could potentially work as early biomarkers for BCBM.
Our study revealed the early alteration in the expres- sion levels of several miRNAs, and particularly the downregulation of miR-802-5p and miR-194-5p in
plasma, and that their common target, MEF2C, is increasingly expressed in the brain along BC metas- tasis development. These findings pave the way for considering the altered miRNAs as potential biomarkers and MEF2C as a possible target for modulation to prevent or abrogate BCBM.
Among the different types of BC, triple-negative BC is the most aggressive and has a high predisposition to develop brain metastases (Niwinska et al., 2010). So, we used the murine mammary carcinoma 4T1 cell line, which is an aggressive triple-negative tumor model that is highly tumorigenic and invasive, and metastasizes
setycortsA
MEF2C GFAP Hoechst
b
MEF2C GFAP
20 µm A
B
Fig. 6.Myocyte enhancer factor 2C (MEF2C) expression in the peritumoral astrocytes. Brain sections from 4T1-injected mice were analyzed, to study the expression of MEF2C in nontumoral cells, in close proximity to tumor cells. A double labeling for MEF2C and a marker for astrocytes (GFAP) was performed. Colocalization between MEF2C and GFAP was observed (A). Astrocytes that are close to the tumor (arrows) express MEF2C, while those that are further from the tumor only express GFAP (B). The different channels of the labeling are presented, as well as the merged pictures. Hoechst is labeling the nucleus.
with a pattern very similar to that of human mammary cancer (Pulaski and Ostrand-Rosenberg, 2001). The cells were injected in the common carotid artery, as an experimental model of brain metastasis (Zhang et al., 2017), already applied successfully by us (Haskoet al., 2019; Herman et al., 2019). To ascertain brain speci- ficity, metastatic progression was followed in different brain regions and peripheral organs. Whereas no metastases were observed in kidney or liver, they were detected in the lung. Importantly, the tumor area in the lung was similar to that of cerebellum, which was the least affected of the studied brain regions. These results indicate that in the experimental conditions used, BCCs are more prone to develop metastasis in the brain, particularly in the hippocampus, than in peripheral organs, rendering the used mouse model a suitable one to study brain metastasis from BC and its relationship with the miRNA alterations in peripheral circulation.
Analysis of the plasma miRNome by NGS con- firmed our hypothesis that cell-free miRNAs are dereg- ulated during brain metastasis development and provided insights about the cell-free miRNA signature in peripheral circulation along metastatic progression.
Based on the pattern of metastasis, it is conceivable that the observed alterations in the plasma miRNA levels are mainly due to metastasization to brain, though not excluding any contribution from peripheral organs like the lungs. Moreover, the increasing num- ber of deregulated miRNAs along time suggests an association with metastatic development. However, the main contributors to such altered levels remain to be determined, namely whether they result from an altered tumor cells’ activity or from a reaction from surrounding cells in the affected organ, presumably the brain. In line with the later possibility, there are
evidences that upon tumor cell injection, the brain pre- metastatic niche can modulate the levels of the miR- NAs to create a tumor-favorable environment (Liu and Cao, 2016). Another relevant observation ensuing from NGS results is that miRNA levels are dynamic and are changing with time, and the same miRNAs that are deregulated in earlier stages of the tumor are not the same that are deregulated in more advanced stages, except for a small number of miRNAs that are deregulated throughout the metastatic development.
This is supported by a recent study, showing that miRNA expression profiles can efficiently distinguish and categorize BC patients into early and advanced stages (Yerukala Sathipati and Ho, 2018).
Search for miRNAs with an aberrant expression prior to metastasis detection revealed miR-194-5p, miR-802-5p, miR-17-3p, miR-145-5p, and miR-338-3p, which are downregulated, and miR-205-5p, miR-92a- 1-5p, and miR-181a-1-3p, which are upregulated. Con- sidering that miRNAs mainly act by negatively regu- lating gene expression, it is predictable that those with a decreased expression mainly act as tumor suppres- sors, by downregulating oncogenes, while the upregu- lated ones should mainly work as oncogenes, downregulating tumor suppressor genes (Zhang et al., 2007). Although the presently identified miRNAs have never been described in the development of BCBM, other studies support their tumor-suppressive/onco- genic roles in other BC or metastatic conditions (De Colaet al., 2015; Donzelliet al., 2015; Le et al., 2012;
Lin et al., 2013; Taylor et al., 2013; Ye et al., 2014;
Yuan and Wang, 2015). Among those miRNAs, miR- 802-5p and miR-194-5p emerged as the most promis- ing, by being downregulated prior to metastasis development, and potentially being related to the upregulation of oncogenic proteins, as revealed by
Fig. 7.Myocyte enhancer factor 2C (MEF2C) expression in human brain metastases from triple-negative breast carcinoma. Double labeling immunofluorescence analysis was performed for MEF2C with pan-cytokeratin in sections from resected brain metastasis, from triple- negative breast cancer patients. MEF2C shows colocalization with pan-cytokeratin. The different channels of the labeling are presented, as well as the merged pictures. Hoechst is labeling the nucleus. Representative photographs from four different cases analyzed are shown.
bioinformatical target prediction and bibliographic search.
The downregulation of miR-802-5p has been described for different types of cancer. In prostate can- cer, this miRNA inhibited epithelial–mesenchymal transition, an essential step for metastasis develop- ment, by downregulating flotillin-2, a known down- stream gene of p53. Accordingly, its forced expression led to a decrease in mesenchymal markers and sup- pressed metastatic ability of cancer cells (Wang et al., 2017). MiR-802-5p downregulation was also shown to increase Wnt activation in pancreatic adenocarcinoma (Muller et al., 2015). Regarding miR-802-5p in BC, it was shown to have a lower expression in BCCs com- paring to normal breast epithelial cells, and that its overexpression decreased BC proliferation in both in vitro and in vivo experiments, through downregula- tion of FoxM1 (Yuan and Wang, 2015). These evi- dences support that miR-802-5p can have a tumor- suppressive action and that its downregulation may play a role in the metastatic progression.
Regarding miR-194-5p, ambiguous results are found in the literature. In fact, there are reports of elevated levels in esophageal squamous cell carcinoma (Wu et al., 2014) and in prostate cancer patients who subse- quently experienced recurrence (Selth et al., 2013). In contrast, another study showed significantly lower miR-194-5p in colorectal cancer patients than in con- trol subjects, and an inverse correlation with the advanced stages, suggesting that reduced levels of the miRNA could serve as diagnostic and prognostic biomarkers for patients with colorectal cancer (Basati et al., 2016). In BC, miR-194-5p was described as hav- ing tumor-suppressive roles by inhibiting proliferation and migration in vitro and in vivo (Le et al., 2012).
However, a recent paper demonstrated that miR-194- 5p enhances cell proliferation, migration, and invasion in different BC cell lines via Wnt/b-catenin pathway regulation (Yang et al., 2018). These contradicting reports may be a consequence of the multitude of genes and functions that one single miRNA can regu- late and of the multiple factors and cellular contexts that influence their expression (Dykxhoorn, 2010).
However, none of these studies analyzed plasma levels of miR-194-5p prior to development of brain metasta- sis. Thus, they do not argue against the herewith pre- sented downregulation of miR-194-5p, which in turn is in line with its predicted targets that have been described as oncogenes in BC or other types of cancer and to promote metastatic development.
The dysregulation of a miRNA also implies the dys- regulation of its targets. Thus, having found two miR- NAs with an altered expression, the bioinformatical
analysis was used as a way to have better insights about the mechanisms and pathways in which these miRNAs can be involved during brain metastasis development. Among these targets emerged MEF2C, related to both miR-802-5p and miR-194-5p. MEF2C has recently been proposed as a new oncogene, pro- moting metastasis in pancreatic adenocarcinoma by inducing MMP10 transcription (Zhang et al., 2014) and mediating VEGF induction of vasculogenic mimi- cry, migration, and invasion in hepatocellular carci- noma (Bai et al., 2015). MEF2C is a member of the MEF2 protein family that was initially associated with the development of heart and muscle and is now known to have close connections with biological fea- tures that are characteristic of cancer, like uncon- trolled proliferation and enhancement of invasion (Chen et al., 2017). Accordingly, one of its members, MEF2D, has been related to lung cancer (Zhang et al., 2015), hepatocellular carcinoma (Ma et al., 2014), and glioma (Zhao et al., 2015), with its expres- sion regulated by miR-1244, miR-122, and miR-18a, respectively. Besides miRNAs, signaling pathways such as Ca2+signaling pathway, EGFR, MAP kinase, Wnt, and PI3K/Akt signaling pathways can activate MEF2 (Chen et al., 2017). Moreover, a molecular regulatory loop whereby MEF2D regulates miR-1244 was observed in lung cancer (Zhang et al., 2015). As far as ME2C is concerned, it demonstrated its activation by the MAPK p38 in inflammation in monocytic cells (Han et al., 1997), whereas downregulation of the MUC4/ErbB2/p38/MEF2C-dependent pathway was shown to suppress invasion and metastasis of pancre- atic ductal adenocarcinoma (Zhang et al., 2014).
MEF2C expression was also shown in BC, with studies showing its upregulation in MCF7 BCCs occurring together with upregulation of apoptosis-related cys- teine peptidase gene, one of the initiator caspases (Motaghed et al., 2014). MEF2C expression was also reported in primary BC tissues and shown to be acti- vated by p38MAPK in metastatic BC (Ostrander et al., 2007). Our analysis of the brain parenchyma revealed that MEF2C is highly expressed in BCBM and that its expression increases with tumor progres- sion. This had never been described before but sug- gests an oncogenic role for MEF2C in promoting BCBM. Furthermore, a nuclear translocation of MEF2C was observed in later stages of tumor progres- sion. Since MEF2C is a transcription factor, the natu- ral assumption is that this translocation means a higher activation of MEF2C to promote its target genes transcription, like the aforementioned MMP10 and VEGF, and support metastatic growth. Interest- ingly, a nuclear translocation of MEF2C was also
observed in hepatocellular carcinoma, in which the cytosolic location was associated with the proliferation biomarker Ki-67, while the nuclear location was corre- lated with the angiogenesis-associated biomarker CD31, suggesting that the subcellular distribution dic- tates the overall effect of MEF2C (Bai et al., 2015).
The proliferative activity here detected by Ki-67, together with the MEF2C inhibition of apoptosis observed in endothelial cells (Hayashiet al., 2004) and developing neurons (Okamoto et al., 2000), may fur- ther contribute to metastasis development. These observations provide a basis for further studying the contribution of MEF2C to the brain metastatic pro- cess and the underlying signaling pathways. It would also be interesting to analyze whether MEF2C is phos- phorylated as reported in acute myeloid leukemia where phosphorylation appeared to induce apoptosis resistance and its inhibition reverted chemotherapy resistance (Brownet al., 2018). Moreover, by revealing MEF2C in BCBM, they point to the relevance of fur- ther studying this transcription factor both as a prog- nostic biomarker and as a potential target for modulation.
Upregulation of MEF2C found in mouse samples was validated by the observation of a marked expres- sion of the protein in resected brain metastasis from BC patients, which increases the relevance of the pre- sent study. Interestingly, overexpression of MEF2C was also observed in pretreatment bone marrow speci- mens from acute myeloid leukemia patients, which was correlated with MEF2C protein expression, suggesting a contribution to the aggressive nature of at least some subtypes of the disease (Laszloet al., 2015). Moreover, MEF2C was considered one of the driving oncogenes in acute lymphoblastic leukemia and demonstrated to be overexpressed in T cells from disease patients (Colomer-Lahiguera et al., 2017). In the same study, MEF2C dysregulation was correlated with a poor response of the patients to glucocorticoid therapy.
Based on these observations, it is conceivable that the expression of MEF2C in human brain metastasis from BC patients contributes to the poor prognosis by com- promising the response to the therapy.
Astrocytes are key components of the brain meta- static microenvironment and are determinants of malignant cell fate in the brain. Although, initially, astrocytes have an harmful role for tumor cells, in later stages astrocytes share a bidirectional communi- cation with tumor cells and produce proteases, growth factors, and inflammatory cytokines, to support tumor growth (Wilhelmet al., 2019). MEF2C expression has previously been described as a regulator of the inflam- matory response by microglia, during aging
(Deczkowska et al., 2017), but its expression in astro- cytes has not been described, yet. Here, we show that astrocytes start expressing MEF2C after tumor cell extravasation. Interestingly, mainly peritumoral astro- cytes express MEF2C, contrarily to non-peritumoral astrocytes. This can indicate that MEF2C is involved in the crosstalk between astroglial cells and tumor cells during BCBM formation, to support tumor growth, which deserves further studies.
5. Conclusions
With this work, we showed that during BCBM for- mation, circulating miRNAs are deregulated in a time-dependent manner, with some of them deregu- lated even before brain metastasis detection. Prospec- tive studies in patients will clarify whether decrease in miR-802 and miR-194 predicts the appearance of sec- ondary tumors in the central nervous system in humans. Our study might thus provide a basis for the development of novel diagnostic strategies based on the detection of plasma miRNAs as biomarkers of brain metastases.
We also described for the first time the overexpres- sion of MEF2C and its translocation into the nucleus, which suggest a supporting role in the devel- opment of brain metastasis from BC for this tran- scription factor, predicted to be a target of both miR-802-5p and miR-194-5p. Noteworthy, its overex- pression in peritumoral astrocytes may underline the interplay between these glial cells and the malignant ones. Finally, the unequivocal expression of MEF2C in resected brain metastasis from BC patients allows the translation of the findings obtained in a mouse model to humans.
Acknowledgements
This work was funded by the Portuguese Foundation for Science and Technology (FCT), Portugal, grant numbers PTDC/MED-ONC/29402/2017, UID/DTP/
04138/2019, PPBI-POCI-01-0145-FEDER-022122, and 441.00 HUNGRIA; the National Research, Develop- ment and Innovation Office (NKFIH, Hungary), grant numbers FK-124114, K-116158, TET_16-1- 2016-0079, GINOP-2.3.2-15-2016-00020, and GINOP- 2.3.2-15-2016-00034; the Executive Unit for Financing Higher Education, Research, Development and Inno- vation (UEFISCDI, Romania), grant numbers PN- III-P1-1.1-TE-2016-1352 and PN-III-P4-ID-PCE-2016- 0408; and the Janos Bolyai Research Fellowship of the Hungarian Academy of Sciences, grant number BO/00334/16/8.
Conflict of interest
The authors declare no conflict of interest.
Author contributions
MAB conceived the study and gathered together the team. MS, JH, KM, and SJM performed the experi- ments. MAB, SAB, IW, and IAK contributed to experimental development control and validation, as well as to data analysis. RM, MV, ZR, and LT pro- vided resources for study development and data acqui- sition. MS prepared the figures and the original draft.
All authors provided critical feedback and reviewed and edited the manuscript. MAB, IW, and IAK obtained the funding for the study accomplishment.
References
Agarwal V, Bell GW, Nam JW and Bartel DP (2015) Predicting effective microRNA target sites in mammalian mRNAs.eLife4, 1–38.
Bai XL, Zhang Q, Ye LY, Liang F, Sun X, Chen Y, Hu QD, Fu QH, Su W, Chen Zet al. (2015) Myocyte enhancer factor 2C regulation of hepatocellular carcinoma via vascular endothelial growth factor and Wnt/b-catenin signaling.Oncogene34, 4089–4097.
Basati G, Razavi AE, Pakzad I and Malayeri FA (2016) Circulating levels of the miRNAs, miR-194, and miR- 29b, as clinically useful biomarkers for colorectal cancer.Tumour Biol37, 1781–1788.
Brown FC, Still E, Koche RP, Yim CY, Takao S, Cifani P, Reed C, Gunasekera S, Ficarro SB, Romanienko P et al. (2018) MEF2C phosphorylation is required for chemotherapy resistance in acute myeloid leukemia.
Cancer Discov8, 478–497.
Cardoso FL, Brites D and Brito MA (2010) Looking at the blood-brain barrier: molecular anatomy and possible investigation approaches.Brain Res Rev64, 328–363.
Chen X, Ba Y, Ma L, Cai X, Yin Y, Wang K, Guo J, Zhang Y, Chen J, Guo Xet al. (2008) Characterization of microRNAs in serum: a novel class of biomarkers for diagnosis of cancer and other diseases.Cell Res18, 997–1006.
Chen X, Gao B, Ponnusamy M, Lin Z and Liu J (2017) MEF2 signaling and human diseases.Oncotarget8, 112152–112165.
Colomer-Lahiguera S, Pisecker M, Konig M, Nebral K, Pickl WF, Kauer MO, Haas OA, Ullmann R, Attarbaschi A, Dworzak MNet al. (2017) MEF2C- dysregulated pediatric T-cell acute lymphoblastic leukemia is associated with CDKN1B deletions and a poor response to glucocorticoid therapy.Leuk Lymphoma58, 2895–2904.
De Cola A, Volpe S, Budani MC, Ferracin M, Lattanzio R, Turdo A, D’Agostino D, Capone E, Stassi G, Todaro Met al. (2015) miR-205-5p-mediated downregulation of ErbB/HER receptors in breast cancer stem cells results in targeted therapy resistance.
Cell Death Dis6, e1823–e1823.
Deczkowska A, Matcovitch-Natan O, Tsitsou-Kampeli A, Ben-Hamo S, Dvir-Szternfeld R, Spinrad A, Singer O, David E, Winter DR, Smith LKet al. (2017) Mef2C restrains microglial inflammatory response and is lost in brain ageing in an IFN-I-dependent manner.Nat Commun8, 717.
Dong C, Yang XZ, Zhang CY, Liu YY, Zhou RB, Cheng QD, Yan EK and Yin DC (2017) Myocyte enhancer factor 2C and its directly-interacting proteins: a review.
Prog Biophys Mol Biol126, 22–30.
Donzelli S, Mori F, Bellissimo T, Sacconi A, Casini B, Frixa T, Roscilli G, Aurisicchio L, Facciolo F, Pompili Aet al. (2015) Epigenetic silencing of miR-145-5p contributes to brain metastasis.Oncotarget6, 35183– 35201.
Dykxhoorn DM (2010) MicroRNAs and metastasis: little RNAs go a long way.Cancer Res70, 6401–6406.
Ferlay J, Soerjomataram I, Dikshit R, Eser S, Mathers C, Rebelo M, Parkin DM, Forman D and Bray F (2015) Cancer incidence and mortality worldwide: sources, methods and major patterns in GLOBOCAN 2012.Int J Cancer136, E359–E386.
Friedman RC, Farh KK, Burge CB and Bartel DP (2009) Most mammalian mRNAs are conserved targets of microRNAs.Genome Res19, 92–105.
Git A, Dvinge H, Salmon-Divon M, Osborne M, Kutter C, Hadfield J, Bertone P and Caldas C (2010) Systematic comparison of microarray profiling, real-time PCR, and next-generation sequencing technologies for measuring differential microRNA expression.RNA16, 991–1006.
Han J, Jiang Y, Li Z, Kravchenko VV and Ulevitch RJ (1997) Activation of the transcription factor MEF2C by the MAP kinase p38 in inflammation.Nature386, 296–299.
Hasko J, Fazakas C, Molnar K, Meszaros A, Patai R, Szabo G, Erdelyi F, Nyul-Toth A, Gyori F, Kozma M et al. (2019) Response of the neurovascular unit to brain metastatic breast cancer cells.Acta Neuropathol Commun7, 133.
Hayashi M, Kim SW, Imanaka-Yoshida K, Yoshida T, Abel ED, Eliceiri B, Yang Y, Ulevitch RJ and Lee JD (2004) Targeted deletion of BMK1/ERK5 in adult mice perturbs vascular integrity and leads to endothelial failure.J Clin Invest113, 1138–1148.
He Y, Lin J, Kong D, Huang M, Xu C, Kim TK, Etheridge A, Luo Y, Ding Y and Wang K (2015) Current state of circulating microRNAs as cancer biomarkers.Clin Chem61, 1138–1155.