Classical pathology and mutational load of breast cancer – integration of two worlds
Jan Budczies,1,2†* Michael Bockmayr,1†Carsten Denkert,1,2Frederick Klauschen,1Jochen K Lennerz,3 Balazs Gy€orffy,4,5,6 Manfred Dietel,1,2 Sibylle Loibl,7Wilko Weichert8,9,10and Albrecht Stenzinger8,11*
1Institute of Pathology, Charite University Hospital, Berlin, Germany
2German Cancer Consortium (DKTK), Berlin, Germany
3Massachusetts General Hospital/Harvard Medical School, Department of Pathology, Center for Integrated Diagnostics (CID), Boston, Massachusetts
4MTA TTK Lend€ulet Cancer Biomarker Research Group, Budapest, Hungary
52nd Department of Pediatrics, Semmelweis University, Budapest, Hungary
6MTA-SE Pediatrics and Nephrology Research Group, Budapest, Hungary
7German Breast Group, Neu-Isenburg, Germany
8Institute of Pathology, University Hospital Heidelberg, Heidelberg, Germany
9National Center for Tumor Diseases (NCT), Heidelberg, Germany
10German Cancer Consortium (DKTK), Heidelberg, Germany
11Fellow of the NCT Heidelberg School of Oncology (NCT-HSO), Heidelberg, Germany
*Correspondence to: Albrecht Stenzinger, Institute of Pathology, University Hospital Heidelberg, Im Neuenheimer Feld 224, 69120 Heidelberg, Germany. e-mail: albrecht.stenzinger@med.uni-heidelberg.de or Jan Budczies, Institute of Pathology, Charite University Hospital, Chariteplatz 1,10117 Berlin, Germany. e-mail: jan.budczies@charite.de
Abstract
Breast cancer is a complex molecular disease comprising several biological subtypes. However, daily routine diagnosis is still based on a small set of well-characterized clinico-pathological variables. Here, we try to link the two worlds of surgical pathology and multilayered molecular profiling by analyzing the relationships between clinico-pathological phenotypes and mutational loads of breast cancer. We evaluated the number of mutated genes with somatic non- silent mutations in different subgroups of breast cancer based on clinico-pathological, including immunohistochemi- cal and tumour characteristics. The analysis was performed for a cohort of 687 primary breast cancer patients with mutational profiling, gene expression and clinico-pathological data available from The Cancer Genome Atlas (TCGA) project. The number of mutated genes was strongly positively associated with higher tumour grade (p51.4e214) and with the different immunohistochemical and PAM50 molecular subtypes of breast cancer (p51.4e210 and p54.3e210, respectively). We observed significant associations (|R|>0.4) between the abundance of mutated genes and expression levels of genes related to proliferation in the overall cohort and hormone receptor positive cohort, including the Recurrence Score gene signature (e.g.,MYBL2 and BIRC5). Specific mutated genes (TP53, NCOR1, NF1, PTPRD and RB1) were highly significantly associated with high loads of mutated genes. Multivariate analysis for over- all survival (OS) revealed a worse survival for patients with high numbers of mutated genes (hazard ratio54.6, 95%
CI: 1.0 – 20.0,p50.044). Here, we report a strong association of the number of mutated genes with immunohisto- chemical and PAM50 subtypes and tumour grade in breast cancer. We provide evidence that specific levels of the mutational load underlie different morphological and biological phenotypes, which collectively constitute the current basis of pathological diagnosis. Our study is a step towards genomics-informed breast pathology and will provide a basis for future studies in this field bridging the gap between morphology, tumour biology and medical oncology.
Keywords:breast cancer; clinical parameters; pathology; staging; tumour grade; tumour size; genetics; mutations; prognosis
Received 11 March 2015; accepted 13 June 2015
†Jan Budczies and Michael Bockmayr contributed equally to this work.
Contract/grant details: This work was supported by the German Cancer Consortium (DKTK; to CD, JB and WW) and by the Deutsche Forschungsge- meinschaft (DFG) and Ruprecht-Karls-Universit€at Heidelberg within the funding programme Open Access Publishing (to AS). AS is supported by a fel- lowship of the NCT-Heidelberg School of Oncology (NCT-HSO).
The authors declare that no competing interests exist.
VC 2015 John Wiley and Sons Ltd and The Pathological Society of Great Britain and Ireland J Path: Clin Res 2015 This is an open access article under the terms of the Creative Commons Attribution-NonCommercial-NoDerivs License, which permits use and
Published online June 2015 in Wiley Online Library (wileyonlinelibrary.com).DOI: 10.1002/cjp2.25
Introduction
Breast cancer is a complex molecular disease [1,2] and the most common cancer in women worldwide with each 8th to 9th woman affected during lifetime in the United States and Western Europe. While mortality is decreasing due to advances in both diagnostic and thera- peutic approaches, breast cancer is still the second most common cause of death from cancer in women [3].
As demonstrated by a multitude of high-throughput molecular profiling studies [4–7] over the last 15 years spearheaded by the pioneering work of Perou et al [4], breast cancer is a heterogeneous disease comprising several biologically defined subtypes that are associated with distinct clinical behaviour and each require specific therapeutic strategies [8]. Cur- rently, four subtypes (luminal A and luminal B, HER2-enriched and basal like/triple negative) are firmly established but more recent data even suggest a finer molecular classification in ten subtypes [9]
whose clinical implications, however, still need to be explored. Complementing these advances, several multigene predictors have been developed to aid pre- diction of response towards adjuvant therapy and risk stratification of recurrence [10–12].
The current histomorphological typing system [13]
still plays a significant role in the detection of rare subtypes but yields only limited clinically exploitable information for the most prevalent histological breast cancer type, invasive carcinoma of no special type (NST). With a shift to smaller tumours due to screen- ing programs, tumour stagingper sehas only limited prognostic power [13,14] with recent studies suggest- ing that a refinement of the current staging system through inclusion of molecular profiles might prove beneficial [15,16]. The Elston–Ellis modification [17,18] of the Scarff–Bloom–Richardson grading sys- tem [19] is widely used to estimate outcomes but the semi-quantitative evaluation of morphological fea- tures rather than quantitative assessment of genetic parameters appears to introduce a considerable bias leaving grading results alone with a comparably lim- ited impact on clinical decision making [13,14,20].
These developments and subsequent implementa- tion of molecular classifications into routine diagnos- tics led to guidelines [21] which attribute a less important prognostic and particularly predictive power to classic morphology-based parameters, that is, typing, grading and staging [13,14,20–22].
This being said, it should be noted that, in principle, conventional morphology-based parameters, when applied in combination and evaluated by trained experts contribute to a reliable, valid and robust esti-
mation of the course of disease in many cancers includ- ing breast cancer [20]. Very surprisingly, however, studies investigating the actual genetic underpinnings of phenotype-based prognosticators and comparing these results with established molecular subtypes are still rare. A landmark study by Sotiriouet al[23] dem- onstrated histological grading to be associated with dif- ferent gene expression signatures which also allowed stratifying the large set of grade 2 tumours into sub- groups with different clinical outcome.
Interestingly, recent genomic profiling studies [24–31] suggested a substantial degree of intra- and inter-tumour heterogeneity fuelling selection proc- esses during evolution of breast cancer [32,33], which may complicate prognostication as well as pre- diction and impede cancer precision medicine approaches [34]. In this context, it is worth recalling that just as the molecular phenotype, the morphologi- cal phenotype of the tumour, including tumour grade and tumour size is essentially a result of accumulated genetic aberrations over time, thereby reflecting tumour evolution at the phenotypic level.
Availability of a large dataset from The Cancer Genome Atlas (TCGA) enabled us to narrow in on these associations. Specifically, here, we investigated relations between the abundance of mutated genes and the morphological as well as biological pheno- type of breast cancers.
Material and methods
Dataset
The study cohort (for details, see Table 1) included 687 breast cancer patients with both tumour exome sequenc- ing and tumour grade data available. The primary vari- able under investigation was the number of mutated genes defined as genes carrying at least one somatic non-synonymous mutation in the coding region.
To obtain this quantity, we counted the number of genes with simple somatic mutations (substitutions, small insertions or deletions) in the coding region that led to a change in the amino acid sequence. Mutation data, clinico-pathological data and RNAseq data were downloaded from TCGA at https://tcga-data.nci.nih.
gov/tcga/dataAccessMatrix.htm. Overall survival (OS) data with a limited mean follow-up time of 3.0 years and a limited median follow-up time of 2.0 years were avaiable. Seventy-four (10.8%) out of the 687 patients were followed until an event. Additionally, data on tumour grading and on tumours size (in cm) that were not available from TCGA were manually extracted from the corresponding pathology reports.
In the current study, we only used data sets that were published previously and labelled ‘No restric- tions; all data available without limitations’ according to the TCGA publication guidelines (see http://can- cergenome.nih.gov/publications/publicationguidelines, for details). We also extracted the PAM50 data sup- plied as supplementary data in [2].
With respect to the somatic mutation data, non- synonymous mutations comprising insertions, dele- tions and substitutions in the coding region of genes were included. Structural rearrangements, aneuploidy, translocations or duplications as well as silent muta- tions were excluded from the analysis. For details visit https://wiki.nci.nih.gov/display/TCGA/Mutation1 Annotation1Format.
Statistics
All statistical analyses and visualizations were per- formed using the statistical environment R including the R-packages clinfun, beeswarm, survival and binom [35–39].
The number of mutated genes was correlated with patient age and tumour size using Spearman correla- tions, with tumour grade using the Jonckheere–Terpstra test, with histopathological subtype, hormone receptor
(HR) status, HER2 status and molecular subtype using the exact Fisher test. p-values<0.05 were considered statistically significant. Robust linear regression was executed using Huber’s M-estimator as it is imple- mented in the function rlm of the R package MASS [40]. Correlations of the number of mutated genes with the mutation status of 23 recurrently mutated breast cancer genes [2] were investigated using Wilcoxon’s rank test.p-values<0.05 after Bonferroni-correction for the 23 genes were considered statistically significant.
Genome-wide gene expression data (generated by RNAseq) of breast cancer, HR1 breast cancer and HR2 breast cancer were correlated with the number of mutated genes using the Spearman correlation coefficient. p-values<0.05 after Bonferroni correla- tion for the total number of 20 531 genes were con- sidered statistical significant. For visualization, fold changes (FC) between highly mutated tumours (22 or more mutations) and lowly mutated tumours (21 or less mutations) were calculated. Gene ontology (GO) categories were obtained from GO2MSIG [41].
Univariate and multivariate survival analysis was executed using the function coxph from the R pack- age survival. p-values<0.05 were considered signifi- cant. Prognostic evaluation of cut-off points for the number of mutated genes was executed as it is imple- mented in the Cutoff Finder software [42]. The muta- tion status of each of the 23 recurrently mutated breast cancer genes was correlated with patient age and tumour size using the Wilcoxon test, with tumour grade using the chi-squared test for trends, with histopathological subtype, HR status, HER2 sta- tus and molecular subtype using the exact Fisher test.
p-values<0.05 after Bonferroni-correction for the 23 genes were considered statistically significant.
Results
We performed an integrated analysis of somatic mutations data, clinico-pathological data and RNAseq data that were publicly available from the TCGA project. Characteristics of the cohort comprising 687 patients are provided in Table 1. The primary vari- able under investigation was the number of genes carrying at least one non-silent somatic mutation (hereinafter simply termed ‘mutated genes’).
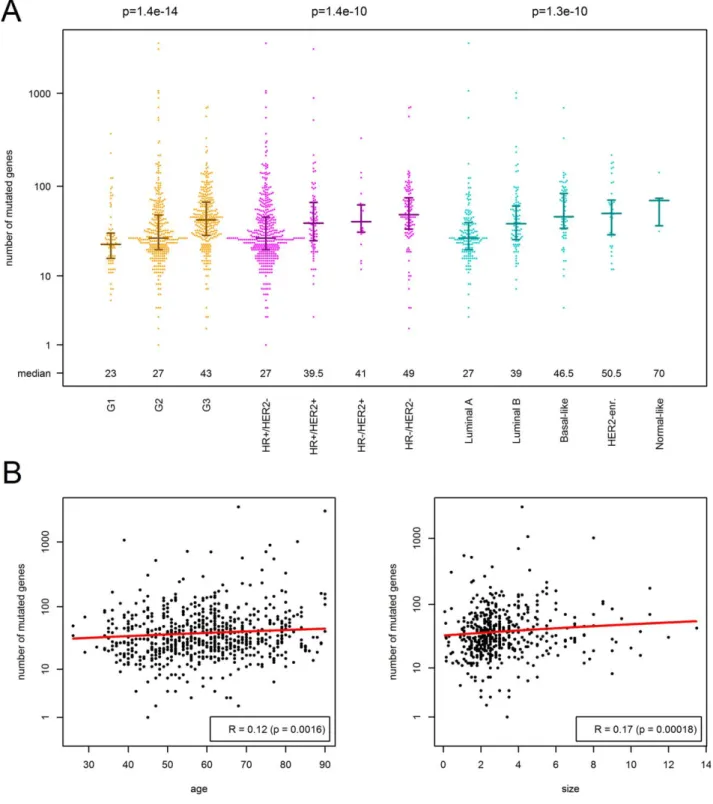
Associations of clinico-pathological parameters with muta- tional load.First, we correlated the number of mutated genes with the clinico-pathological characteristics of the tumour (Table 2, Figure 1). The number of mutated genes was strongly associated with tumour grade increasing from a median of 23 mutated genes Table 1.Clinico-pathological characteristics of the study cohort
including 687 primary breast cancer patients
Characteristics Group Number of patients
Total All patients 687 (100%)
Age Median (q1-q3) 59 (49–68)
Size Median (q1-q3) 2.5 (1.9–3.8)
N N0 324 (47.2%)
N1 351 (51.1%)
NA 12 (1.8%)
G G1 74 (10.8%)
G2 319 (46.4%)
G3 294 (42.8%)
Histopathology Lobular 107 (15.6%)
NST/other 579 (84.3%)
NA 1 (0.2%)
Hormone receptor HR2 148 (21.5%)
HR1 532 (77.4%)
NA 7 (1.0%)
HER2 HER22 517 (75.3%)
HER21 113 (16.5%)
NA 57 (8.3%)
Subtype HR1/HER22 405 (59.0%)
HR1/HER21 90 (13.1%)
HR2/HER22 111 (16.2%)
HR2/HER21 23 (3.4%)
NA 58 (8.4%)
TP53 Mut 207 (30.1%)
wt 480 (69.9%)
PIK3CA Mut 212 (30.9%)
wt 475 (69.1%)
q15first quartile,q35third quartile, NA5missing data
in G1 tumors via 27 in G2 tumors to 43 in G3 tumours (p51.4e214). When analysing the three components of tumour grade, nuclear pleomorphism (atypia) showed the strongest association with the number of mutated genes (p55.5e211), but mitotic count and the degree of tubule formation also con- tributed significantly (p54.8e208 and p51.4e203, respectively). In addition, the number of mutated genes was strongly associated with the molecular subtype of breast cancer as determined by routine immunohistochemistry and the PAM50 classifier (p51.4e210 and p54.3e210, respectively). As shown in Table 2 and Figure 1, HR2/HER2 breast cancer and HR2/HER21 breast cancer harboured much more mutated genes compared with HR1/
HER22 breast cancer. In contrast, we observed no statistically significant differences between the muta- tional loads of the two main histological subtypes, invasive lobular carcinoma (ILC) and NST (27 versus 23 mutated genes (median), p50.23). To narrow in on relations between histological tumour types and mutational load, we analyzed the abundance of mutated genes in all ILC (of any grade) and com- pared the results with the mutational load of NST carcinomas stratified according to grade (supplemen- tary material Figure S1). While ILC harboured a mean of 27 mutated genes, G1–G3 NST displayed 23, 27 and 43 mutated genes, respectively (p50.027, p50.66,p50.0011). These data showed that ILC of any grade are fairly comparable with G2 NST with respect to their mutational load and ILC, G1 and G2 NST are in the lower range of mutational loads com- pared with G3 NST (p59.12e212). Interestingly, ILC of any grade shared a high burden of mutated PIK3CA with G1–G3 NST. Highly mutated genes in ILC were PIK3CA (43.9%), CDH1 (56.1%), MLL3 (7.5%), FOXA1 and TP53 (6.5% each), as well as MAP3K1 and GATA3 (4.7% each). 54.6% of NST
G1 showed mutated PIK3CA, followed by MAP3K1 (16.4%), GATA3 (14.6%), MAP2K4 (10.4%), and FOXP1 and TP53 (3.6% each). With higher tumour grades, NST tumours with mutated MAP2K4 (G2:
5.0%, G3:1.8%), MAP3K1 (G2: 10.5%, G3: 3.2%) and GATA3 (G2: 14.2%, G3: 5.6%) decreased while cases with TP53 mutations strongly increased (G2:
19.7%, G3: 52.6%).
Further, we detected significant associations of the number of mutated genes with patient age (p50.0016), tumour size (p50.00018), and nodal stage (p50.0048). The median number of mutated genes in node positive (N1) tumours was 30 com- pared with 34 in N0 tumours. To quantify the strength of association with the continuous parame- ters, we executed robust linear regression of the num- ber of mutated genes against patient age and against tumour size. Only 2.1 mutated genes were added per 10 years of the patient’s life (slope, p50.0012), while 26.0 mutated genes (intercept, p54.2e209) occurred independent of the age at diagnosis. Further, only 1.6 mutated genes were added when the tumour’s maximum dimension extended by 1 cm (slope, p50.0015), while 33.1 mutated genes (intercept, p55.8e244) occurred independent of the tumour size.
Finally, we executed the aforementioned analyses separately in HR1 breast cancer (n5532) and in HR2breast cancer (n5148). The number of mutated genes significantly correlated with tumour grade and HER2 status in HR1breast cancer (p54.8e209 and p50.00039), but not in HR2breast cancer. Interest- ingly, the correlation with patient age was stronger in HR1 breast cancer (R50.2) compared with HR2 breast cancer (R50.14). Using estimates from robust linear regression, this corresponded to 3.4 mutated genes per 10 years life time occurring in HR1tumours compared with 2.5 mutated genes per 10 years life time occurring in HR2tumours.
Table 2.Association of the number of mutated genes (non-silent somatic mutation) with clinico-pathological characteristics of breast cancer
Variable Number of mutated genes (median) p-value
Age R50.12, slope52.1, intercept526.0 0.0016
1. Tumour size R50.17, slope51.6 intercept533.1 0.00018
2. Nodal status N0534, N1 530 0.0048
3. Histopathology ILC527, NST533 0.23
4. Tumour grade G1523, G2527, G3543 1.0e214
5. Hormone receptor (HR) HR1 528, HR2 546 1.0e210
6. HER2 HER22 531, HER21 540 0.0066
7. Subtype (based on IHC) HR1/HER22 527, HR1/Her21 540, HR2/HER22 549, HR2/HER21 541 1.0e210 8. Subtype (based on PAM50) Luminal A527, Luminal B539, Basal-like546, HER2-enriched550, Normal-like570 4.3e210 The number of mutated genes correlated significantly with patient age, tumour size, nodal status, tumour grade, as well as immunohistochemical and PAM50 molecular subtypes. Associations with tumour grade, hormone receptor (HR) status and molecular subtype were much stronger compared with the associations with the other clinico-pathological parameters. Associations with patient age and tumour size were quantified using Spearman correlations and robust linear modelling. For patient age, the slope describes the increase in mutated genes per 10 years. For the tumour size, the slope describes the increase in mutated genes per 1cm increase in the maximum tumour dimension
Figure 1.Association of the number of mutated genes (non-silent somatic mutation) with clinico-pathological characteristics of breast cancer. (A) In the beeswarm plot, each coloured dot represents a tumour. The bands indicate the first quartile, the median and the third quartile (n5median of mutated genes). The number of mutated genes was strongly associated with tumour grade, molecu- lar subtyping by immunohistochemistry and SISH for ER, PR and HER2 as well as molecular subtyping by PAM50. (B) Scatterplots showing weak, but significant association of the number of mutations with patient age and tumour size in cm. The red curves repre- sent the results of robust linear fitting. Not that the results of linear modeling appear as curves (not straight lines), because of the logarithmic scale of they-axis.
Associations of recurrently mutated genes with mutational load.Second, we correlated the number of mutated genes with the mutation status of each of the 23 genes that were reported by TCGA [2] as recurrently mutated in breast cancer (Figure 2, sup- plementary material Table S1). It turned out that the number of mutated genes was strongly associated with the mutation status of the tumour suppressor gene TP53 (median of the number of mutated genes 47 in TP53-mutated tumours versus 27 in TP53 wild-type tumours; p53.8e221), while it was not associated with the mutation status of the oncogene PIK3CA (p50.36). Additionally, a significantly enhanced number of mutated genes was observed in, NCOR1-mutated, NF1-mutated, PTPRD-mutated and RB1-mutated tumours (Figure 2). In addition, we analyzed the correlation of the total mutational load with the mutation status of BRCA1 and BRCA2.
Note that, in this analysis, only somatic mutations were taken into account, as germline variant calling is currently not available for the TCGA BRCA data set. BRCA1 somatic mutated tumours tended (p50.058) to harbour an enhanced total number of mutated genes (n567) compared with tumours without somatic BRCA1 mutations (n532). BRCA2 somatic mutated tumours had a significantly (p50.0037) enhanced total number of mutated genes
(n5112) compared with tumours without somatic BRCA2mutations (n532).
Associations of gene expression profiles with mutational load.Third, we analyzed the correlation of the gene expression landscape with the number of mutated genes (Figure 3, supplementary material Table S3).
To this end, Spearman correlations were calculated between RNAseq data and the number of mutated genes. The number of genes whose expression showed a strong positive or negative correlation with the number of mutated genes (|R|>0.4) was 44 in breast cancer (all p<8.8e228; Figure 4A), 11 in HR1breast cancer (all p<4.7e222; Figure 4B) and 23 in HR2 breast cancer (all; p<5.1e207; Figure 4D). In a functional analysis based on GO categories, we found the cellular process ‘mitotic cell cycle (GO:0000278)’ to be strongly and significantly enriched in the gene lists for breast cancer (20 genes, p53.3e219) and for HR1 breast cancer (5 genes, p51.0e205). When relaxing the correlation thresh- old to |R|>0.3, larger numbers of 120 and 84 cell cycle genes belonged to the gene lists (significance of enrichment: p52.6e256 and p52.8e252, respectively). Moreover, we observed similar results for associations between the abundance of mutated genes and the five proliferation-related genes from Figure 2.Association of the number of mutated genes (non-silent somatic mutation) with mutation status of genes frequently mutated in breast cancer. In the beeswarm plot, each coloured dot represents a tumour. The bands indicate the median including the first and third quartile (n5median of mutated genes). The number of mutated genes was not associated withPIK3CAmutation sta- tus, but strongly and highly significantly associated with mutatedTP53. Moreover, the number of mutated genes was strongly and significantly associated with mutatedNCOR1,NF1,PTPRDandRB1.
the Recurrence Score gene signature [11] in HR1 breast cancers (all correlation p<2.4e222; Figure 4C, supplementary material Table S2). Taken together, in the overall cohort as well as in HR1 -driven tumours, we found especially upregulated cell cycle and proliferation-related genes to be associated with higher numbers of mutated genes. Specifically, CDC20, MYBL2 and BIRC5 (Survivin) as well as MKI67, which is routinely used for diagnostic work-up of breast cancers ranged among the top genes. In the gene expression data of HR2 breast cancer, functional analysis did not detect any enriched GO category and all correlating genes were downregulated.
Associations of recurrently mutated genes with clinico- pathological parameters.Next, we correlated the muta- tion status of the 23 genes that were described as recur- rently mutated in breast cancer [2] with tumour grade, molecular subtype and other clinico-pathological char-
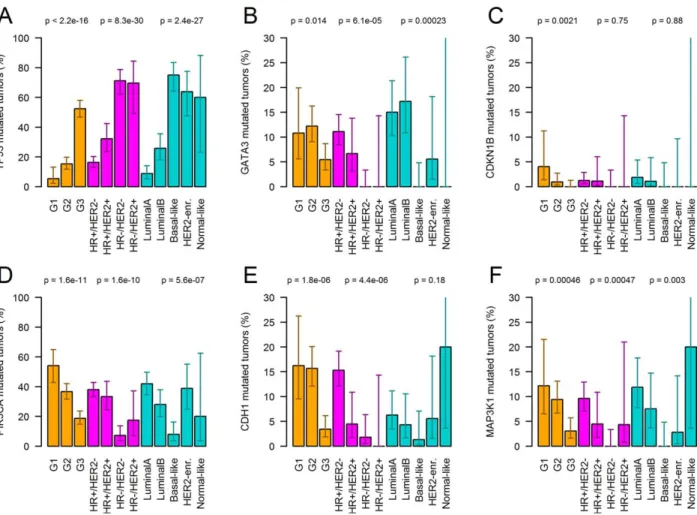
acteristics of breast cancer (Figure 4). Mutation status ofPIK3CA,TP53, CDH1and CDKN1Bcorrelated sig- nificantly with tumour grade. Mutation status of PIK3CA, TP53, GATA3 and CDH1 correlated signifi- cantly with the molecular subtype. Further, we found a strong association between CDH1 mutation status and the histopathological subtype, where 56.1% of the lobu- lar cancers had CHD1 mutations (G1: 57.9%, G2:
56.3%, G3: 50.0%) compared with only 2.1% of NST/
other cancers (G1: 1.8%, G2: 2.1%, G3: 2.1%). Finally, we detected a moderate, but significant association of mutated MLL3 (p50.00046) and FOXA1 (p50.00097) with patient age. Median age of patients harbouring these mutations was 63 and 67 compared with a median age of 59 in patients without these mutations.
Further, we investigated the correlation of somatic BRCA1and BRCA2mutation status with the clinico- pathological data. Mutations in BRCA1 were Figure 3.Gene expression FCs with 95% CIs between tumours with a high number of mutated genes (22 or more) and a low number of mutated genes (21 or less). Cell cycle genes [GO category 0000278: ‘mitotic cell cycle’; (40)] are colored in yellow. (A) Analysis of breast cancer: FCs of 44 genes whose expression strongly correlated with the number of mutated genes (|Spearman-R|>0.4). (B) Analysis of HR1breast cancer: FCs of 11 genes whose expression strongly correlated with the number of mutated genes (|Spearman- R|>0.4). (C) Analysis of HR2breast cancer: FCs of 23 genes whose expression strongly correlated with the number of mutated genes (|Spearman-R|>0.4). (D) Analysis of HR1breast cancer: FCs of the 16 cancer genes included in the Recurrence Score assay.
detected only in the basal-like molecular subtype (in 3.9% of these tumours), but absent in all other PAM50 subtypes (p50.053). BRCA2 mutations were found in the HER2-enriched subtype (8.3%) in the basal subtype (3.9%) and in the luminal A sub- type (1.2%), but absent in the other PAM50 subtypes (p50.032).
Associations of overall survival with mutational load.Finally, we investigated the correlation of out- come with the number of mutated genes (Figure 5).
In univariate analysis of overall survival, the number of mutated genes was a negative prognostic marker with a hazard ratio of 1.18 per 100 mutated genes (p50.00029). In a multivariate analysis including correction for patient age, tumour size, nodal status,
histopathological type, tumour grade, HR status and HER2 status, the number of mutated genes was no longer significant. Next, we analyzed the prognostic power of a dichotomized version of the number of mutated genes. To this end, we made use of the Cut- off Finder [40] to study the impact of the choice of the cut-off point on differences in survival. In multi- variate analysis, we detected a borderline-significant impact of the number of mutated genes on survival for cut-off points between 18.5 and 27.5 (Figure 4).
An optimal cut-off point occurred when classifying tumours in those with 21 or less mutated genes and those with 22 or more mutated genes. This classifica- tion yielded a hazard ratio of 4.6 (95%CI: 1.0–20.0) and significance ofp50.044 in multivariate analysis of overall survival.
Figure 4.Association of the mutation status of specific genes with tumour grade and immunohistochemical as well as PAM50 sub- types (mutation rates including 95% confidence intervals). Genes with significant association after Bonferroni correction are shown (TP53, GATA3, CDKN1B, PIK3CA, CDH1, and MAP3K1). For example, the number of PIK3CA mutated tumours decreased from 54.3 via 36.7% to 18.7% with increasing tumour grade (G1, G2 and G3), while the number ofTP53mutated tumours increased from 5.4 via 15.4% to 52.4%. Mutation status ofPIK3CA,TP53, GATA3, CDH1andMAP3K1 correlated significantly with the molecular subtype.
PIK3CAmutations were much less frequent in triple-negative breast cancer (7.2%) compared with the other subtypes (all mutation rates >17.4%).TP53 mutation rate was much higher in triple-negative (71.2%) and HR2/HER21(69.6%) breast cancer compared with HR1/HER22(16.3%) and HR1/HER21(32.2%) breast cancer.
Discussion
Here, we show that the number of mutated genes, that is, the diversity of the gene pool putatively con- tributing to tumour evolution [34] is strongly associ- ated with both morphological and biological features of breast cancer, which are commonly being used in routine diagnostics to guide clinical management and therapy worldwide. We also provide evidence for associations between the number of mutated genes and mutation status of specific genes as well as with expression levels of genes routinely used to assess the proliferative capacity of breast tumours (eg, Ki67, [43]) and to predict therapy response (eg, cancer gene signature of the Recurrence Score assay [11]).
Gene expression profiling studies combined with survival analysis [4–8] revealed that hormone receptor (HR)-positive (ie, luminal A and luminal B) and HR- negative tumours (ie, HER2-enriched and basal-like) are distinct diseases in both molecular and clinical terms. The intrinsic molecular subtypes are largely dis- tinguished by gene sets measuring epithelial and basal differentiation as well as proliferation and the HER2 pathway. The robustness of the stratifying signatures has been demonstrated across several platforms [2,6,7].
In daily pathological diagnostics, however, immunohis- tochemistry is applied to facilitate approximation of these subtypes [43] and to stratify breast cancer patients into different risk groups and oncological therapies. A more recent combined analysis of genetic and RNA expression profiles of the largest breast cancer series to
date comprising 2000 patients profiles by the META- BRIC study group [9], even revealed 10 different sub- groups associated with different clinical outcomes;
however, this has not entered clinical decision making yet.
In line with these findings, we observed significant differences in the relative abundance of mutated genes across molecular subtypes determined by immunohistochemistry and the PAM50 classifier: the median of mutated genes increased from 27 in HR1/
HER22 tumours to 40 in HR1/HER21 tumours, 41 in HR2/HER21and 49 in HR2/HER22tumours and from 27 in Luminal A to 39 in Luminal B, 46.5 in Basal-like, 50.5 in HER2-enriched and 70 in normal- like tumours.
Recent large-scale molecular profiling studies [2,9]
revealed considerable divergence of the main breast cancer subtypes on the genetic level. Interestingly, as shown by TCGA [2], luminal breast cancers are the most heterogeneous subtypes. Mutations frequently affected transcription factors of the ER pathway (GATA3, FOXA1 and RUNX1) and the PI3K cascade with mutations in PIK3CA as the most frequent genetic aberration followed by mutually exclusive mutations inPIK3R1,AKTandPTEN. Other frequent targets are the MAP-kinases MAP3K1 and MAP2K4 and epigenetic modulators, for example, genes encoding methyltransferases (eg, MLL3), demethyl- transferases (eg,KDM6A) as well as several adenine- thymine-rich interactive domain-containing proteins (ARID1A and others). TP53 mutations occurred in Figure 5.Association of overall survival with the total number of mutated genes (non-silent somatic mutation) in breast cancer. Haz- ard ratios (haz. rat.) are shown for a dichotomized version of the number of mutated genes that was varied along thex-axis. (A) In univariate analysis, no cut-off point between 10 and 180 yielded a significant association with survival. (B) In multivariate analysis including correction for patient age, tumour size, nodal status, histopathological type, tumour grade, hormone receptor status and HER2 status, a high number of mutations were borderline-significant associated with shorter survival for cut-off points between 18.5 and 27.5. The most significant association was obtained for a cut-off point of 21.5 with hazard ratio54.6 (1.0–10.0) andp50.044.
approx. 25.8% of luminal B and 8.8% of luminal A tumours. In contrast, basal-like breast cancer appears to harbour the most unique and distinctive genomic profile. They are primarily characterized by genomic instability that is putatively caused by the loss of function of three tumour suppressor genes and cell- cycle regulators by mutations or deletions: TP53 (75%), RB1 (4%), and BRCA1/2 (7.9%). Similar to basal-like breast cancers, HER2-enriched subtypes showing a certain relation to luminal subtypes also harbour a high frequency of TP53 (63.9%) that is accompanied byPIK3CA mutations (38.9%).
In accord with these observations, extended analy- sis of the whole cohort showed a significantly high prevalence of mutated TP53 in TNBC and HER2- enriched breast cancer, while mutated CDH1 and GATA3 occur significantly more frequently in the HR1 subtype and the HR1/HER22subtype, respec- tively. We also noted that while PIK3CA and CDH1 mutations were significantly enriched in tumours with lower tumour grades, TP53 and CDKN1B were significantly associated with higher tumour grades.
However, when analyzing CDH1 status within histo- logical subtypes, we did not observe any significant correlations with tumour grade. As already reported by other investigators [2,44,45], mutated CDH1 occured almost exclusively in lobular breast cancer.
Interestingly, we did not observed significant asso- ciations between the abundance of mutated genes and several of the frequently mutated breast-cancer related genes briefly summarized above. However, we identified five mutated genes (TP53, NCOR1, PTRD, NF1 andRB1), which showed strong associa- tions to high numbers of mutated genes independent of the tumour subtype. As expected, non-silent muta- tions in TP53 and RB1, which have been causally linked to genomic instability of tumours [46,47], are strongly correlated with the number of mutated genes in breast cancer. Moreover, our data show that high numbers of mutated genes are strongly associated with mutant NCOR1, which is mutated in 4% of breast cancer cases [2]. Although we cannot provide evidence for a causal relationship, it is of note that NCOR1 is a gene encoding a transcriptional co- regulator serving as a linker for transcription factors and chromatin-modifying enzymes and has been implicated in maintaining genomic stability via HDAC3 [48]. Pointing towards a similar direction, the mutant variant of PTPRD (genetic aberrations in 7% of breast cancers [2]) encoding the protein tyro- sine phosphatase receptor type delta was also strongly associated with high numbers of mutated genes in breast cancer. PTPRD has been shown to act as tumour suppressor [49] and impairs function of
Aurora A [50], a protein that has been shown to modulate genomic stability [51]. Last but not least, the mutated variant of the putative breast cancer oncogene NF1 (genetic alterations in 5% of breast cancers [2]) correlated with a high abundance of mutated genes in our study. Neurofibromin1 acts as a negative regulator of RAS by stimulating GTPase activity of RAS [52] and impaired NF1 function has been linked to increased mutations frequencies in mice [53]. Taken together, our observational data indicate that it may be worthwhile to investigate the specific functional relevance of these five genes in breast cancer biology and maintenance of genome integrity in future studies.
In addition, we sought to identify differentially expressed genes that are associated with the number of mutated genes in breast cancer. Interestingly, we found many upregulated cell cycle-related proteins to be related to high numbers of mutated genes in the overall cohort. Among the top upregulated genes were MYBL2, BIRC5 and AURKA, which are also part of the cancer genes interrogated by the Recur- rence Score assay [11]. Narrowing in on this, we observed that particularly the proliferation gene sig- nature of the Recurrence score shows a strong corre- lation with the mutation rate in HR1 breast cancer subtypes. A broader analysis of the HR1 cancers corroboratedMYBL2 and identified other upregulated cell-cycle associated genes, such as PLK1 and CDC20. These data suggest that the link between proliferation and abundant mutations is largely restricted to HR1 tumours and does not pertain to HR2 tumours. It is tempting to speculate that this proliferation signature indicates that increased tumour cell replication and associated stochastically higher mutation rate in luminal tumours fuels the pool of mutated genes thereby advancing tumour heterogene- ity and evolutionary selection processes [34].
Remarkably, we found that tumour grade, that is, phenotypes indicating the degree of cellular differen- tiation, but not the two main breast cancer types, that is, NST and ILC, are strongly associated with differ- ent numbers of mutated genes. Additionally, we iden- tified a significant but comparably weaker correlation of the mutational load with two other measures reflecting the temporal development of the tumour, that is, age at diagnosis and tumour size. Specifically, the expected number of acquired mutated genes was estimated as 2.1 per 10 years and 1.6 per 1 cm, respectively. Hypothesizing that the abundance of mutated genes is a measure of genetic heterogeneity of the tumour [34], we here provide evidence that particularly pathological grading of breast cancer is in fact a microscopic read-out of tumour
heterogeneity, which indicates different biological and clinical behaviour of the tumour. Several studies either sequencing tumour bulks or single tumour cells have demonstrated that breast cancer subtypes exhibit considerable spatial and temporal heterogeneity on the genetic level within the primary, during meta- static progression and in patient-derived xenografts [24–31]. This genomic diversity within breast cancers is a result of but also facilitates cellular evolution [34] allowing the tumour to dynamically adapt to external or internal stimuli as originally conceptual- ized by Nowell in 1976 [54].
While we and others [31,33,34,54] hypothesize that this diverse gene pool may confer survival advantage to the tumour, to our surprise and counter- intuitive, local spread to lymph nodes was associated with slightly but significantly lower numbers of mutated genes compared with node negative tumours. Currently, we are unable explain these results satisfactorily and future studies are needed to investigate these relations further. Although data on follow-up times of the cohort are rather short and limited, and hence, limit analysis as well as data interpretation, our survival data analysis indicates that increasing numbers of mutated genes per se are significantly associated with increased hazard ratios independently of other clinico-pathological parame- ters. Hence, our data may suggest that the abundance of mutated genes has a certain relation with meta- static progression ultimately leading to tumour- related death [55–57]. Further studies are warranted to substantiate our findings and conclusions.
To sum up, we here provide evidence for signifi- cant associations between the genotype and morpho- logical as well biological phenotypes of breast cancer. Specifically, while histological subtypes do not display specific numbers of non-synonymous somatic mutations, immunohistochemically defined subtypes of breast cancer are associated with differ- ent amounts of mutated genes increasing from HR1/
HER22 to HR1/HER21, HR2/HER21 and HR2/
HER22 breast cancers. Moreover, we observed sig- nificant correlations with the expression level of genes involved in cellular proliferation as well as with specific breast-cancer related genes. Interest- ingly, the increasing abundance of mutated genes dis- played strong correlations with increasing tumour grades and also with tumour size and age at diagno- sis albeit to a lower degree. The three main implica- tions of these observations are: 1) a critical reappraisal of tumour grading that warrants further investigation as the tumour grade assessed by con- ventional light-microscopy for prognostication of the course of disease may reflect genetic tumour hetero-
geneity and in turn possibly the evolutionary poten- tial of tumour cells, 2) different molecular subtypes of breast cancer may harbour a different capacity for tumour evolution due to different abundances of mutated genes and 3) we provide evidence for a strong relation between the proliferative capacity as well as specific mutated genes and the number of genes harbouring somatic non-silent mutations in breast cancer.
In conclusion, we believe that our study is a step further towards genomics-informed breast pathology and will provide a basis for future studies in this field bridging the gap between morphology, tumour biology and medical oncology.
List of abbreviations
AFF2 AF4/FMR2 family member 2 ARID1A AT-rich interactive domain-containing
protein 1A AURKA/STK15 Aurora A kinase BIRC5 Survivin
CBFB Core-binding factor subunit beta
CDH1 Cadherin-1
CDC20 cell-division cycle protein 20 CTCF CCCTC-binding factor
ER Estrogen receptor
FC Fold change
GATA3 Transacting T-cell-specific tran- scription factor 3
HER2 Human epidermal growth factor receptor 2
HR Hormone receptor
ILC Invasive lobular carcinoma
MAP3K1 Mitogen-activated protein kinase kinase kinase 1
MAP2K4 mitogen-activated protein kinase kinase 4
MLL3 Histone-lysine N-methyltransferase 3 MYBL2 Myb-related protein B
NCOR1 Nuclear receptor corepressor 1
NF1 Neurofibromin 1
NST Invasive carcinoma of no special type
TNBC Triple negative breast cancer PIK3CA phosphatidylinositol-4,5-bisphosphate
3-kinase, catalytic subunit alpha PLK1 Polo-like kinase
PTEN Phosphatase and tensin homolog PTPRD Receptor-type tyrosine-protein phos-
phatase delta
PR Progesteron receptor
RB1 retinoblastoma 1
RUNX1 Runt-related transcription factor 1 SF3B1 Splicing factor 3B subunit 1 SPC24 kinetochore protein SPc 24 TBX3 T-box transcription factor TP53 tumour suppressor 53 Acknowledgements
We would like to thank Luisa Albe and Marthe Schulz for help with the extraction of grading and tumour size data from pathology reports.
Author contributions
AS and JB conceived and designed the study and super- vised experiments. JB, MB, FK, JKL, SB, GB, MD, CD, WW and AS analyzed sequencing data and clinico- pathological parameters. AS and JB wrote the manuscript with contributions from MB, FK, SB, CD, JKL, WW, and SL. All authors read and approved the final manuscript.
References
1. Stephens PJ, Tarpey PS, Davies H, Van Loo P, Greenman C, Wedge DC,et al. The landscape of cancer genes and mutational processes in breast cancer.Nature2012;486: 400–404.
2. Cancer Genome Atlas Network. Comprehensive molecular por- traits of human breast tumours.Nature2012;490: 61–70.
3. DeSantis C, Ma J, Bryan L, Jemal A. Breast cancer statistics, 2013.CA Cancer J Clin2014;64: 52–62
4. Perou CM, Sørlie T, Eisen MB, van de Rijn M, Jeffrey SS, Rees CA,et al. Molecular portraits of human breast tumours.Nature 2000;406: 747–752.
5. Sørlie T, Perou CM, Tibshirani R, Aas T, Geisler S, Johnsen H, et al. Gene expression patterns of breast carcinomas distinguish tumor subclasses with clinical implications.Proc Natl Acad Sci USA2001;98: 10869–10874.
6. Sorlie T, Tibshirani R, Parker J, Hastie T, Marron JS, Nobel A, et al. Repeated observation of breast tumor subtypes in independ- ent gene expression data sets.Proc Natl Acad Sci U S A. 2003;
100: 8418–8423.
7. Wirapati P, Sotiriou C, Kunkel S, Farmer P, Pradervand S, Haibe- Kains B,et al. Meta-analysis of gene expression profiles in breast cancer: toward a unified understanding of breast cancer subtyping and prognosis signatures.Breast Cancer Res2008;10: R65.
8. Reis-Filho JS, Pusztai L. Gene expression profiling in breast can- cer: classification, prognostication, and prediction.Lancet2011;
378: 1812–1823.
9. Curtis C, Shah SP, Chin SF, Turashvili G, Rueda OM, Dunning MJ,et al. The genomic and transcriptomic architecture of 2,000 breast tumours reveals novel subgroups.Nature 2012;486: 346–
352.
10. van de Vijver MJ, He YD, van’t Veer LJ, Dai H, Hart AA, Voskuil DW,et al. A gene-expression signature as a predictor of survival in breast cancer.N Engl J Med2002;347: 1999–2009.
11. Paik S, Shak S, Tang G, Kim C, Baker J, Cronin M, et al. A multigene assay to predict recurrence of tamoxifen-treated, node- negative breast cancer.N Engl J Med2004;351: 2817–2826.
12. Kronenwett R, Bohmann K, Prinzler J, Sinn BV, Haufe F, Roth C, et al. Decentral gene expression analysis: analytical validation of the Endopredict genomic multianalyte breast cancer prognosis test.BMC Cancer2012;12: 456.
13. Viale G. The current state of breast cancer classification. Ann Oncol2012;23(Suppl 10): x207–10.
14. Singletary SE, Allred C, Ashley P, Bassett LW, Berry D, Bland KI,et al. Revision of the American Joint Committee on Cancer staging system for breast cancer.J Clin Oncol2002;20: 3628–
3636.
15. Mittendorf EA, Jeruss JS, Tucker SL, Kolli A, Newman LA, Gonzalez-Angulo AM,et al. Validation of a novel staging system for disease-specific survival in patients with breast cancer treated with neoadjuvant chemotherapy.J Clin Oncol 2011; 29: 1956–
1962.
16. Bagaria SP, Ray PS, Sim MS, Ye X, Shamonki JM, Cui X,et al.
Personalizing breast cancer staging by the inclusion of ER, PR, and HER2.JAMA Surg2014;149: 125–129.
17. Ellis IO, Galea M, Broughton N, Locker A, Blamey RW, Elston CW. Pathological prognostic factors in breast cancer.
II. Histological type. Relationship with survival in a large study with long-term follow-up. Histopathology 1992; 20:
479–489.
18. Elston CW, Ellis IO. Pathological prognostic factors in breast cancer. I. The value of histological grade in breast cancer: experi- ence from a large study with long-term follow-up.Histopathology 1991;19: 403–410.
19. Bloom HJ, Richardson WW. Histological grading and prognosis in breast cancer; a study of 1409 cases of which 359 have been followed for 15 years.Br J Cancer1957;11: 359–377.
20. Rakha EA, Reis-Filho JS, Baehner F, Dabbs DJ, Decker T, Eusebi V, et al. Breast cancer prognostic classification in the molecular era: the role of histological grade.Breast Cancer Res 2010;12: 207.
21. Goldhirsch, A, Wood WC, Coates AS, Gelber RD, Th€urlimann B, Senn HJ,et al. Strategies for subtypes—dealing with the diversity of breast cancer: highlights of the St Gallen International Expert Consensus on the Primary Therapy of Early Breast Cancer 2011.
Ann Oncol2011;22: 1736–1747.
22. Rakha EA, Ellis IO. Modern classification of breast cancer:
should we stick with morphology or convert to molecular profile characteristics.Adv Anat Pathol2011;18: 255–267.
23. Sotiriou C, Wirapati P, Loi S, Harris A, Fox S, Smeds J,et al.
Gene expression profiling in breast cancer: understanding the molecular basis of histologic grade to improve prognosis.J Natl Cancer Inst2006;98: 262–272.
24. Shah SP, Morin RD, Khattra J, Prentice L, Pugh T, Burleigh A,et al. Mutational evolution in a lobular breast tumour pro- filed at single nucleotide resolution. Nature 2009; 461: 809–
813.
25. Shah SP, Roth A, Goya R, Oloumi A, Ha G, Zhao Y,et al. The clonal and mutational evolution spectrum of primary triple- negative breast cancers.Nature2012;486: 395–399.
26. Wang Y, Waters J, Leung ML, Unruh A, Roh W, Shi X,et al.
Clonal evolution in breast cancer revealed by single nucleus genome sequencing.Nature2014;512: 155–160.
27. Eirew P, Steif A, Khattra J, Ha G, Yap D, Farahani H, et al.
Dynamics of genomic clones in breast cancer patient xenografts at single-cell resolution.Nature2014; 518: 422–426.
28. Nik-Zainal S, Alexandrov LB, Wedge DC, Van Loo P, Greenman CD, Raine K,et al. Breast cancer working group of the international cancer genome consortium. Mutational proc- esses molding the genomes of 21 breast cancers.Cell2012;149:
979–993.
29. Nik-Zainal S, Van Loo P, Wedge DC, Alexandrov LB, Greenman CD, Lau KW,et al. Breast cancer working group of the international cancer genome consortium. The life history of 21 breast cancers.Cell2012;149: 994–1007.
30. Almendro V, Cheng YK, Randles A, Itzkovitz S, Marusyk A, Ametller E, et al. Inference of tumor evolution during chemo- therapy by computational modeling and in situ analysis of genetic and phenotypic cellular diversity. Cell Rep 2014; 6:
514–527.
31. Almendro V, Kim HJ, Cheng YK, G€onen M, Itzkovitz S, Argani P,et al. Genetic and phenotypic diversity in breast tumor metas- tases.Cancer Res2014;74: 1338–1348.
32. Campbell LL, Polyak K. Breast tumor heterogeneity: cancer stem cells or clonal evolution?Cell Cycle2007;6: 2332–2338.
33. Martelotto LG, Ng CK, Piscuoglio S, Weigelt B, Reis-Filho JS, et al. Breast cancer intra-tumor heterogeneity.Breast Cancer Res 2014;16: R48.
34. Burrell RA, McGranahan N, Bartek J, Swanton C, et al. The causes and consequences of genetic heterogeneity in cancer evo- lution.Nature. 2013;501: 338–345.
35. R Development Core Team. 2014. R: a language and environ- ment for statistical computing. R Foundation for Statistical Com- puting, Vienna, Austria. Available at: http://www.R-project.org/.
last accessed on May 20, 2015.
36. Seshan VE. 2014. Clinfun: clinical trial design and data analysis functions. R package version 1.0.6. Available at: http://CRAN.R- project.org/package=clinfun. last accessed on May 20, 2015.
37. Eklund A. 2013. Beeswarm: the bee swarm plot, an alternative to stripchart. R package version 0.1.6. Available at: http://
CRAN. R-project.org/package=beeswarm. last accessed on May 20, 2015.
38. Therneau TM, Grambsch PM.Modeling Survival Data: Extend- ing the Cox Model. Springer: New York, 2000; ISBN 0-387- 98784-3.
39. Dorai-Raj S. 2014. Binom: binomial confidence intervals for sev- eral parameterizations. R package version 1.1-1. Available at:
http://CRAN.R-project.org/package=binom. last accessed on May 20, 2015.
40. Venables WN, Ripley BD.Modern Applied Statistics with S(4th edn). Springer: New York, 2002; ISBN 0–387-95457-0.
41. Powell JA. GO2MSIG, an automated GO based multi-species gene set generator for gene set enrichment analysis.BMC Bioin- formatics2014;15: 146.
42. Budczies J, Klauschen F, Sinn BV, Gy€orffy B, Schmitt WD, Darb-Esfahani S, et al. Cutoff Finder: a comprehensive and straightforward web application enabling rapid biomarker cutoff optimization.PLoS One. 2012;7: e51862.
43. Cornejo KM, Kandil D, Khan A, Cosar EF,et al. Theranostic and molecular classification of breast cancer.Arch Pathol Lab Med2014;
138: 44–56
44. Bertucci F, Orsetti B, Ne`gre V, Finetti P, Rouge C, Ahomadegbe JC,et al. Lobular and ductal carcinomas of the breast have dis- tinct genomic and expression profiles.Oncogene2008;27: 5359–
5372.
45. Petridis C, Shinomiya I, Kohut K, Gorman P, Caneppele M, Shah V,et al. Germline CDH1 mutations in bilateral lobular carcinoma in situ.Br J Cancer2014;110: 1053–1057.
46. Negrini S, Gorgoulis VG, Halazonetis TD. Genomic instability—
an evolving hallmark of cancer.Nat Rev Mol Cell Biol2010;11:
220–228.
47. Hernando E, Nahle Z, Juan G, Diaz-Rodriguez E, Alaminos M, Hemann M,et al. Rb inactivation promotes genomic instability by uncoupling cell cycle progression from mitotic control.Nature 2004;430: 797–802.
48. Bhaskara S, Knutson SK, Jiang G, Chandrasekharan MB, Wilson AJ, Zheng S,et al. Hdac3 is essential for the maintenance of chromatin structure and genome stability.Cancer Cell2010;18:
436–447.
49. Veeriah S, Brennan C, Meng S, Singh B, Fagin JA, Solit DB, et al. The tyrosine phosphatase PTPRD is a tumor suppressor that is frequently inactivated and mutated in glioblastoma and other human cancers.Proc Natl Acad Sci USA2009;106: 9435–
9440.
50. Meehan M, Parthasarathi L, Moran N, Jefferies CA, Foley N, Lazzari E,et al. Protein tyrosine phosphatase receptor delta acts as a neuroblastoma tumor suppressor by destabilizing the aurora kinase A oncogene.Mol Cancer2012;11: 6.
51. Ertych N, Stolz A, Stenzinger A, Weichert W, Kaulfub S, Burfeind P,et al. Increased microtubule assembly rates influence chromosomal instability in colorectal cancer cells.Nat Cell Biol 2014;16: 779–791.
52. Wallace MD, Pfefferle AD, Shen L, McNairn AJ, Cerami EG, Fallon BL,et al. Comparative oncogenomics implicates the neu- rofibromin 1 gene (NF1) as a breast cancer driver. Genetics 2012;192: 385–396.
53. Garza R, Hudson RA 3rd, McMahan CA, Walter CA, Vogel KS, et al. A mild mutator phenotype arises in a mouse model for malignancies associated with neurofibromatosis type 1.Mutat Res 2007;615: 98–110.
54. Nowell PC. The clonal evolution of tumor cell populations.Sci- ence1976;194: 23–28.
55. Baccelli I, Schneeweiss A, Riethdorf S, Stenzinger A, Schillert A, Vogel V, et al. Identification of a population of blood circulating tumor cells from breast cancer patients that ini- tiates metastasis in a xenograft assay.Nat Biotechnol 2013;31:
539–544.
56. Baccelli I, Stenzinger A, Vogel V, Pfitzner BM, Klein C, Wallwiener M,et al. Co-expression of MET and CD47 is a novel prognosticator for survival of luminal breast cancer patients.
Oncotarget2014;5: 8147–8160.
57. Budczies J, von Winterfeld M, Klauschen F, Bockmayr M, Lennerz JK, Denkert C,et al. The landscape of metastatic pro- gression patterns across major human cancers.Oncotarget2015;
6: 570–583.
Figure S1: Association of the number of mutated genes (non-silent somatic mutation) with histopathological subtypes of breast cancer (ILC all grade, NST grade 1, NST grade 2, NST grade 3). In the beeswarm plot, each coloured dot represents a tumour. The bands indicate the first quartile, the median and the third quartile (n5median of mutated genes). Mutational load of ILC was slightly, but significantly, higher than in NST G1 tumours (p50.027). Mutational load of ILC did not show a significant difference compared with NST G2 tumours (p50.66). Muta- tional load was considerably lower in ILC compared with G3 NST tumours (p50.0011).
Table S1: Association of the number of somatically mutated genes (non-silent mutation) with mutation status of genes frequently mutated in breast cancer. For comparison, the Wilcoxon test was applied and bold p-values indicate statistical significance after Bonferroni adjustment.
TSG: Tumour suppressor gene.
Table S2: Association of the number of somatically mutated genes (non-silent mutation, median) with the expression levels of the 16 cancer genes from the OncotypeDX assay. *5p<0.05, **5p<0.05 after Bonferroni-correction.
Table S3 (separate Excel file): Detailed overview of the statistical results of the genes whose expression levels were found to be significantly associated with the abundance of mutated genes in all breast cancers, as well as in ER2and ER1subtypes.