I N T R O D U C T O R Y L E C T U R E
A B S T R A C T
The primary quantum conversion act in photosynthesis is defined as that event during which electronic excitation is converted into chemical species which are separable and which may be isolable. As yet no unambiguous assignment for such an event has been made.
There appear to be two major alternative approaches. The first is that a molecular event occurs leading directly to a chemical species from the excited molecule. While a great deal of work has been done over the years toward this end, no assignment of this sort has yet been achieved and work from this point of view continues. The second approach, involving the transfer of an electron from one molecule to another as the primary event, gives rise to a one-electron oxidant and a one-electron reductant in two different sites physically separated from each other as the primary chemical storage products. It is this latter point of view which is now being most actively sustained, and it is the evidence for this viewpoint which is examined in the present paper. While a good many different kinds of evidence have been brought to bear, we will discuss only two, namely, that derived from the optical changes induced in the photosynthetic apparatus by actinic light and the magnetic changes induced by the actinic light.
An examination of the variety of these changes and the kinetics of their formation and disappearance, as well as the dependence of these kinetics on physical and chemical environmental variables, leads to the supposition that the sequence of events is: absorption of light;
migration of the exciton to the point of electron transfer; electron transfer producing a trapped electron and mobile hole, or, conversely, a trapped hole and mobile electron ; followed by migration of the mobile particle to another point in the photosynthetic apparatus to a corres- ponding trap of opposite type. The reactions succeeding these events,
15 225 M E L V I N C A L V I N
(with I R W I N D . K U N T Z , Jr. and R . H . R U B Y )
University of California, Berkeley, U.S.A.
226 E N E R G Y C O N V E R S I O N
such as the formation of adenosine triphosphate and the reduction of pyridine nucleotide, are dark enzymatic chemical reactions, some of which have been separately achieved.
I N T R O D U C T I O N
The overall process of photosynthesis in green plants is simply represented by Chart I. The energy stored in this process is of the order of 110 kcal/mole of oxygen liberated. The question before us is how the energy of the quantum, of wavelength about 700 nm (35 kcal/quantum) is stored in chemical form. The maximum efficiency with which this reaction can be carried out is quite high. The measure- ments vary from lower than 30 per cent to as high as 80 per cent.
Ch a r t i . (35 KCALS) hv
C O , + IUO
PRIMARY QUANTUM CONVERSION EFFICIENCY ^ 5θ%-> 100%
JNADPI-lHE F F-~?%>I
Λ A T P Γ
CHEMICAL EFF. ~ 85%
-> ( C H20 ) „ + 02
(~8S%?)
AV = H- NO KCALS/MOLE 02
OVERALL EFFICIENCY MEASURED BETWEEN 30 AND 80 PER CENT
We know a good deal about the chemical reactions involved in going from carbon dioxide to carbohydrates. Our knowledge of the path of carbon [4] and the efficiency of the various steps involved in passing from the carbon dioxide to the carbohydrates, indicates that the efficiency of this chemical conversion is not more than 85 per cent, beginning with the agents which are required to carry this out, that is, carbon dioxide, reduced pyridine nucleotide as well as some selected number of collaborative energy sources. Thus, starting with C 02 and these energy-rich molecules, the efficiency is of the order of 85 per cent.
The efficiency of the chemical reactions from the primary photo- products to the energy-rich molecules used in this reaction ( N A D P H and A T P ) is not known, but is presumed to be of the same order of magnitude. A corresponding uncertainty exists about the nature and
I N T R O D U C T O R Y L E C T U R E 227
to be any higher, then the quantum conversion act will have to be correspondingly greater, reaching more than 90 per cent efficiency, particularly if we allow anything much less than 100 per cent efficiency for the chemical path from the primary photoproducts to molecular oxygen.
Before denning what we mean by the quantum conversion act, let us look at the series of reactions from C 02 to carbohydrate which we know something about and point out where that quantum conversion act plays its role. Figure 1 shows this in a schematic fashion. The carbon dioxide enters, reacting with a sugar molecule, giving an efficiency of the chemical reactions leading from the primary photo- products to molecular oxygen. If we take this also to be 8 5 per cent, the chemical efficiency following primary quantum conversion would amount to ~ 60 per cent.
Thus if the overall efficiency of the reaction may be as low as 30 per cent, the efficiency of the primary quantum conversion cannot be less than 50 per cent. If we allow the maximum overall efficiency
228 E N E R G Y C O N V E R S I O N
intermediate. The light produces the reducing power and other high energy molecules which are required to run this carbon cycle. The 85 per cent efficiency figure which I gave you was the efficiency figure for actually running the carbon cycle, using the reduced pyridine nucleotide and A T P to keep it going. (There is a postscript to this which I would like to mention : We now know a little more about the nature of this carboxydismutase reaction [5] and it seems to be a carboxylation of thiolenediol formed from a sulphydryl group in the carboxydismutase enzyme and ribulose diphosphate.)
P H O T O C H E M I S T R Y O F C H L O R O P H Y L L
Let us return now to the question of the nature of the light reaction in so far as we can break it down. The first thing that happens is that the chlorophyll, on which the photosynthesis depends, first absorbs a quantum to form an excited chlorophyll molecule (Reaction (1), Fig. 2). It appears that all of the chlorophyll molecules in the plant are not actually sites at which the quantum conversion occurs, but the excitation of one chlorophyll molecule allows the migration of that exciton among other chlorophyll molecules to a particular chlorophyll molecule, or particular pigment, located somewhere in the photo- synthetic apparatus and possibly associated with some other unknown molecule (M) (Reaction (2), Fig. 2). This is a migration of exciton energy still in the form of electromagnetic energy—electronic excita- tion only—from one molecule into a pattern of molecules to some particular site. Then comes the point, having reached this particular species associated with a particular type of pigment, at which the reaction occurs which leads to a product which must eventually pro- duce an oxidized and a reduced form (Reaction (3), Fig. 2). The overall reaction with which we are dealing is an oxidation-reduction reaction
—the C O 2 is reduced, the water is oxidized, so we know that at some point in the energy conversion scheme there must be an intermediate oxidant and reductant produced, which will ultimately lead chemically to these two kinds of final products.
This is the beginning of the quantum conversion act, but it is not yet the whole act, because whatever these two or more species are, [O] and [R], they must be formed contiguous to each other, since they are formed from a single quantum. The next step in order to prevent the back reaction is the separation of these two, physically, from each other (Reaction (4), Fig. 2). This separation act is part of the primary
I N T R O D U C T O R Y L E C T U R E 22Ç
Ch + (ην ch-
in
* E.M.
Ch t (Ch) · M Ch-M (2)
Ch*- M Q.C
-< [0] + IR1
L
J Separation ^
10x1 [Red]
r5c (5)
(3)
(A)
Fi g . 2.
high-energy phosphate will participate, giving carbohydrate (Reaction (5c), Fig. 2). The high-energy phosphate which we need for these reactions is acquired by a combination of the separated oxidant and reductant, giving energy-containing compounds, some in the form of A T P (Reaction 5b), Fig. 2). The high-energy containing compounds may play a role at various sites in the quantum conversion process.
A T P may form during the passage of oxidant down in potential toward molecular oxygen. However, these steps remain to be deter- mined. The only one we know anything about is the recombination reaction between the chemically separated intermediate oxidant and intermediate reductant.
quantum conversion act. From here on, the intermediate oxidant [Ox] undergoes a whole series of chemical transformations, leading ultimately to molecular oxygen (Reaction (5a), Fig. 2). Water, of course, will be involved in this sequence at some point, and perhaps some additional energy may be introduced (possibly in the form of high-energy phosphate). Similarly, the reduced species [Red] will go on and reduce carbon dioxide, and here, also, energy in the form of
23O E N E R G Y C O N V E R S I O N
The high efficiency requirements for the primary quantum con- version act are for the following reasons: If we must convert the quantum with an efficiency even as high as 50 per cent (and maybe higher than 90 per cent), it is clear that the initial products must have very nearly the same potential energy as the absorbed quantum—it can only be less by the amount that the efficiency is less than 100 per cent.
If the energy content of the two products (O + R, Fig. 3) is very nearly the same as the energy of the excited state from which they are formed, there cannot be a potential energy barrier for their back reaction of any appreciable magnitude (Fig. 3). This is really what the problem is.
A very large bundle of energy—30 to 35 kcal—is to be transformed into The overall systems of Reactions (3) and (4) (as enclosed in Fig. 2) is what we are now defining as the primary quantum conversion act.
You will note that what happens before that time is a physical trans- formation and transfer of energy, and what happens afterward is ordinary chemistry-biochemistry-enzymatic chemistry. It is in this region that we make the break between physical excitation and chemical species.
I N T R O D U C T O R Y L E C T U R E 2ßl
chemical species which we know to have a chemical potential to liberate very nearly that same amount of energy. Therefore, there cannot be a very high potential barrier for back reaction. If Reaction (3) Fig. 2 is 90 per cent efficient, then the barrier for back reaction cannot be more than 3 kcal (cne-tenth of the total quantum). The alternative would be to allow a 15-kcal barrier to the back reaction, thus limiting the efficiency of the primary quantum conversion to 50 per cent and the overall efficiency to less than 20 per cent.
While many workers are willing to accept the requirement of at least 8 quanta per mole of oxygen produced, we ourselves [6] feel that we have demonstrated a long term requirement of less than 7, and perhaps as low as 6, as have a number of others [7,8]. There is one group which claims a long term requirement of 4 or less [9]. It is our intention, therefore, to proceed here on the basis of a 90 per cent efficiency requirement for the primary quantum conversion. Therefore the energy level of the [O] + [R] must not be more than 10 per cent below the energy of the entire quantum (Fig. 3). The quantum takes us up to a level, marked E.S. Fig. 3, which is only 10 per cent above the value of the potential energy of the products, if we are going to store 90 per cent of the quantum energy. Therefore, the barrier over which the chemicals have to pass on the way back, down to the starting point, can be only of very small size.
There is no model in solution photochemistry that approaches this kind of an energy storage. There are many photochemical reactions known, but, in general, the energy of the products of the photo- chemical reactions is very low in relation to the quantum used to produce them. The quantum has five to ten times the amount of energy that one can store in stable products, normally in ordinary solution photochemistry such as an isomerization reaction, tautomeri- zation, dimerization, dissociation, etc. In ordinary photochemical reactions the products which can be separated, and the energy thus stored, is generally very small. In the quantum conversion act we must store 80-90 per cent of the energy in 'stable' chemical products.
We have not given up looking for chemical changes in the chloro- phyll which might possibly be related to these stable chemical inter- mediates, but the tendency has been to seek ways and means in which this separation could occur other than in terms of solution photo- chemistry. The principal types of reactions for which there are models for such a separation are electron transfer and electron migration reactions which can indeed achieve this kind of an energy storage. It
232 E N E R G Y C O N V E R S I O N
H2<Y C 02C H3
CO2C20H39 BACTERIOCHLOROPHYLL
Fi g . 4.
appears that the evidence which is now accumulating is moving pretty definitely in this direction, although I must say it is not unequivocal.
For the present, we are going to discuss the evidence that an electron transfer reaction followed by electron-hole migration is the principal way in which the primary quantum conversion is achieved. The electron-hole migration separates the two primary products of the reaction, the formation of which is only part of the quantum conversion problem. We must not only get the intermediates, but they have to be
C H , CI I, (CL I—OB)
I II."
FIG. 5.
FACING P. 232
FIG. 6. Aspiolistra chloroplast lamina (WEIER, 1962).
I N T R O D U C T O R Y L E C T U R E 233
separated so they don't back react in a random, non-productive fashion; they should have the possibility of reacting under bio- chemically controlled conditions, so that useful products may result.
T H E B I O L O G I C A L P H O T O S Y N T H E T I C A P P A R A T U S
What is the apparatus which performs the quantum conversion?
Chlorophyll (Fig. 4 ) is the principal energy-capturing agent, and I have already indicated to you that there is a good deal of chemistry being done on chlorophyll with the idea that it may be undergoing some kind of observable chemical change in which nuclei are moved.
As yet no unequivocal evidence that such has indeed occurred in biological systems is at hand. The actual biological apparatus which performs the quantum conversion is in the chloroplasts, which contain in them a high degree of structure. Figure 5 shows the structure of one lamellar piece of a chloroplast, showing the fine structure of the piece.
The visible granules are approximately 20 nm in diameter. The 20-nm granules show some hyperfine structure which is probably significant. The granules, or small aggregates of them, we have called ' quantasomes ' because they seem to be the smallest unit of quantum converting particles in the plant. Figure 6 shows a section through these layers, and the granular structure in the lamellae section is visible. This gives us some clue that the apparatus is a highly regular ordered one, which is not surprising [10].
The question now is: How are the molecules ordered in these lamellae or quantasomes ? That question is not so readily answered.
There are a number of suggestions as to how they are ordered, but any unequivocal knowledge of the ordering of the chlorophyll molecules, and the other constituents of the granules, is not yet known to us. We have yet to bridge the gap between the molecular structures which we know—the chlorophyll, carotenoids and other pigments—and the visible structures which we can see under the electron microscope.
Figure 7 shows the approximate chemical composition of the quanta- somes, based on the metal ions present. For each manganese atom there are 115 chlorophyll molecules and a molecular weight of approximately one million. It appears that one of the quantasomes is roughly two such units, the number of chlorophyll molecules being 200-300 in each quanasome, with two manganese atoms per particle as well. There are other components in the particle besides the manganese, copper and iron-containing substances, and the chlorophyll and carotenoids.
There are a number of quinones, one of which is called plastoquinone
234 E N E R G Y C O N V E R S I O N
230 chlorophylls 206,400 160 chlorophyll-α 143,000
70 chlorophyll-6 63,400
48 carotenoids 28,400 14 ß-carotene 7,600
22 lutein 13,600 6 violaxanthin 3,600 6 neoxanthin 3,600
46 quinone compounds 31,800 16 plastoquinone A 12,000
8 plastoquinone Β 9,ooo 4 plastoquinone C 3,000 8-10 α-tocopherol 3,800 4 a-tocopherylquinone 2,000
4 vitamin Kx 2,000
116 phospholipids (phosphatidylglycerol) 90,800
144 digalactosyldiglyceride 134,000 346 monogalactosyldiglyceride 268,000
48 sulpholipid 41,000
? sterols 15,000 unidentified lipids 175,600
Total 991,000 Protein
9380 nitrogen atoms as protein 928,000
2 manganese n o 12 iron including two cytochrome 672
6 copper 218 Total 929,000
Total lipid + protein 1,920,000 Fi g . 7. Quantasome composition [10c].
Is it possible to say anything about the molecular arrangement of these components in the quantasomes ? There is a bit of evidence to the effect that a small fraction of the chlorophyll is oriented—it is not randomly arranged in solution [11]. Figure 8 shows the electric dichroism of the quantasome fragments. The dotted line shows the absorption spectrum and the solid line is the dichroic ratio. At about because of its unique location in the chloroplasts. All may play an important role in the various electron transport reactions which are the chemical reactions following the quantum conversion act.
Molecular Weight Lipid (composition in molecules per quantasome)
I N T R O D U C T O R Y L E C T U R E 235 700 nm there is a relatively large electric dichroism which corresponds to a small fraction (5-15 per cent) of the total chlorophyll with its absorption at this point. A similar conclusion was arrived at by Butler [12] from an examination of the fluorescence of chlorophyll in intact chloroplasts. He found that there was a fluorescence which was polarized and which seemed to be due to this particular kind of chlorophyll, the fluorescence seeming to be of somewhat longer wave- length than the fluorescence of the bulk of the chlorophyll.
Electric dichroism spectrum spinach quanta so mes + 140r
!<·+ 130f-
-M20r
+ 110
vD i c h r o i c / \ Absorption
\ r a t i o / x
+ 100L
Dichroic ratio
350 400 450 500 550 600 650 700 750 Wavelength (mjj)
Fi g . 8.
Thus there seem to be two different kinds of evidence that in the green material there is at least one component of the chlorophyll which is highly ordered. The molecules are ordered enough so that they can be aligned in an electric field as well as a mechanical field (flow dichroism [na]), and, furthermore, these ordered molecules seem to be the ones toward which all of the absorbed quanta in that particular pigment system migrate by exciton migration, and from which the fluorescence comes. The fluorescence is a competitive (wasteful) reaction to the quantum conversion act, which is also presumed to take place in these very special chlorophyll molecules.
The fluorescence evidence, together with the structural evidence, is part of the basis for our notion that following the primary absorption of the quantum anywhere in the bulk chlorophyll it (the quantum)
236 E N E R G Y C O N V E R S I O N
migrates as the excited state to specific sites in the photosynthetic apparatus, and it is at these sites that the quantum conversion takes place.
T H E S P E C T R O S C O P I C M E T H O D I N B I O L O G I C A L M A T E R I A L S
In order to find out what is happening at that site, which is defined as the site of (chlorophyll) pigment 705 (approximately the wavelength of the maximum dichroism), we must try to take the fragment apart still further, to see if we can find materials that have such an absorption and examine their individual photo- and biochemistry. It turns out that whenever this is attempted by going down to structural levels below that of the quantasome, the reactions which we recognize as either whole or partial reactions of photosynthesis fail. It is for this reason that we are confined, so far at least, to studying these primary quantum conversion acts in fairly complex chemical and relatively highly ordered physical systems. Those of you who have been accustomed to the successful approach which biochemistry has taken in the last 20-30 years, that is, dismantling the biological apparatus to the individual molecules of which it is constructed and examining each of the reactions which the individual molecules can carry out and then reconstructing the system from that fragmentary study, will be some- what sceptical or perhaps disappointed. So far we have not succeeded in carrying the fragmentation of the photosynthetic apparatus down below this quantasome level while still retaining the properties which we recognize as components of the photosynthetic process. Therefore we have to find other ways and means of examining them in this complex biological system.
There is really only one way in which such a complex system can be examined, so to speak (and I mean literally look at it) to find out anything about what is going on without destroying it. This is by a spectroscopic method of some sort. One has to examine the system with electromagnetic radiation of a suitable wavelength. One can use anything from radio frequencies down to X-rays, but this is really the only way that we can examine directly what is going on inside this complex structure and analytically separate the various processes, one from another. We can do this by examining what happens inside the quantasome particles, using the principle of the double beam spectro- photometer (Fig. 9). With a device which uses radiation (either radio, visible, infra-red, microwave, etc.) as an analytical tool, we can look at the material in the two vessels and compare the emerging beam.
I N T R O D U C T O R Y L E C T U R E 237
Analytical beam Visible
;
microwave or radiation
/ / A W . ' * / / A W . ' *
J l
Actinic light FIG. 9.
Dark 0 0 T> Ο 0 °I»
Comparing detector
other one microwave frequencies. With these two methods, we can examine two different properties of the particulate material of the quantum conversion apparatus. A third type of examination would be to look at the fluorescence, but we are not going to discuss this in detail here. I have already brought out one of the basic pieces of information resulting from such a study, namely, that exciton migra- tion occurs and that the quantum conversion act probably takes place in one, or possibly two, different kinds of traps for the quanta.
Let us now discuss the results obtained by the two methods:
(1) change in the visible absorption spectrum induced by the actinic light, and (2) changes in the microwave absorption spectrum, and compare the two.
If we shine actinic light on one and have the other vessel in darkness, and compare the two emergent analytical beams by various devices, we are having a look at what the actinic light does to the one by com- paring the change in the illuminated sample with the material in the dark. There are many variations of this type of experiment, but such a comparison is essentially what the spectroscopic examination is. The rest of the paper will deal with this subject, using two kinds of electro- magnetic energy as analytical tools, one of them visible light and the
238 E N E R G Y C O N V E R S I O N E P R I N C H R O M A T O P H O R E S
Figures 10 and n show the result of an examination of bacterial material for photo-induced unpaired electrons. The photosynthetic bacteria seem to be, at least in one respect, somewhat simpler in their photochemical quantum conversion than the green plants. The
FIG. IO. E S R signals from Rhodospirillum rubrum. 5 min continuous illumination.
bacteria do not have one of the very important photosynthetic func- tions, namely, the ability to make molecular oxygen. So, in a sense, they have less of a job to do than the green material of the plants. The next figures will show spectra of the chromatophores, the chlorophyll- containing fragments removed from the photosynthetic bacteria of various kinds. Figure 10 shows the production of unpaired electrons in the whole bacteria as a function of temperature. Here is what appears to be a single absorption band, and you can see that the reaction proceeds
i n t r o d u c t o r y l e c t u r e 2 3 9
FIG. I I . Rise and decay of the e.p.r. in chromatophores of R. rubrum.
If that is the case, you might expect that the growth and decay of the room temperature radicals would be slow, whereas the growth and decay of the radicals made at liquid nitrogen temperature would have a less slow component—everything would be fast. This is shown in Fig. 11 where you can see in the rates at room temperature both a rapid and slow rising component, as well as rapid and slow falling components. When the material is cooled, all the slow components freeze out and only the rapid components are left. Since this photo- graph was made, we have gone to faster times, using a different kind of equipment (flash photolysis) and have obtained a more detailed kinetic picture of the growth and decay curves [15]. The unpaired spins are formed even at liquid nitrogen temperatures and thus must be very close to the primary quantum conversion act itself.
even at liquid nitrogen temperatures, just as it does at room tempera- ture. The important fact is that we can't do very much ordinary bio- chemistry at — i6o°C, so we can be confident that this reaction is something very close to the primary quantum conversion act. The apparent increase and subsequent decrease in the steady-state number of unpaired spins with falling temperature undoubtedly represents a freezing out of successive radical reactions from the biochemical system. Most of the unpaired spins at 25 ° C are surely secondary things, formed in a series of radical reactions after the primary quantum conversion act. When they freeze out, only the physical quantum conversion act itself is left behind.
240 E N E R G Y C O N V E R S I O N
O P T I C A L C H A N G E S I N C H R O M A T O P H O R E S
There is another spectral region which we can examine, namely, the visible, in exactly the same way to see what changes in the visible absorption are introduced when we shine light on one-half of the
• 1 • • • « ' • • - « 1 • ••· • 1 • · · · 1 • • • • 1 • 400 500 600 700 800 900
Wavelength (mjj) FIG. 12.
experimental system. Figure 12 shows the visible absorption spectrum of particles from a particular bacterium, chromatophores of R.
rubrum. The two bands at 880 and 375 nm are the two principal bacteriochlorophyll bands ; the cytochrome bands are hidden under- neath, particularly in the carotenoid region. The lower spectrum
INTRODUCTORY LECTURE 241 shows the difference in optical density (change in absorption) between the illustrated set of chromatophores and the dark set of chromato- phores. There are a large number of things happening: changes are occurring throughout the absorption spectrum of the R. rubrum. One of the big changes is a drop in the absorption of the chlorophyll at 865, and the — 810 and the + 790 peaks look like a shift of some sort at ~ 803. (Note that the scale on the right is larger than the one on the left by a factor of two.) These many peaks and valleys represent optical changes taking place inside the R. rubrum chromatophores in different pigments. The question is : Are these changes in one or several systems, and how can this be recognized ? How can we tell what these difference spectra represent, some of them being increases and some of them being decreases in absorption.
The identification of the changes that are occurring in this material is our principal objective. One can easily see changes in the 865 region, and these have been attributed to the chlorophyll itself. The — 384 and the +360 change is probably due to a shift in the Soret band of the chlorophyll. There are other pigments also involved in this change as well.
There are at least two ways of identifying these various changes.
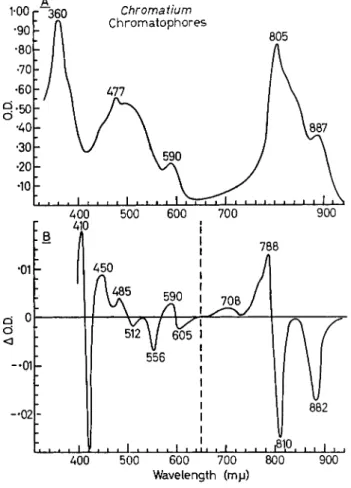
One of them is, of course, to get the individual pigment out which is responsible for the changes in a form which corresponds to the form in which it exists in the chromatophores or quantasomes, and then to demonstrate the change in spectrum by some chemical method—for example, introduce electrons or take electrons away. We have been able to do that with only one pigment, that is, the cytochromes. The cytochrome can be removed from the chromatophores or the chloro- plasts and can be subjected to oxidation or reduction by chemical methods. The spectral changes are observable and can be identified with a small part of the total difference spectrum, shown for Chroma- tium chromatophores in Fig. 13.
The rest of it, however, cannot be. The chlorophyll cannot be, because the moment the chlorophyll is removed from the plant as chlorophyll molecules in ordinary solution, its spectrum is completely different. Therefore, it is not possible to identify the chlorophyll by any other method. We can show that this is an oxidation of chlorophyll, or at least a destruction of it by oxidation, because we can produce the same spectral result by oxidation of the chromatophores by ferri- cyanide as is produced by light. So we say that the light is indeed oxidizing at least one small bit of the chlorophyll [16]. The light is also
16
242 E N E R G Y C O N V E R S I O N
is some work of Ar n o l d and Cl a y t o n [17] of several years ago showing that the absorption changes at 420 nm for a purple bacterium go on at very low temperatures. The absorption at 420 nm is increased when the light is turned on and decreased when it is turned off, and this oxidizing the cytochromes, at least in the Chromatium chromato- phores.
Figure 14 shows some of the low-temperature evidence for the primary character of some of the light-induced spectral changes; this
INTRODUCTORY LECTURE 243
Time
FIG. 14. Absorption changes at 4200 A induced by illumination (λ > 6400 Â) [i7].
KINETIC EXPERIMENTS ON CHROMATOPHORES
So far you have seen the total spectral changes when you shine light on one cell and keep the other one as a dark standard. We have tried to identify some of those changes with certain pigment changes, by isolating the pigments and performing some chemical analyses on them. However, the only one upon which this has been successfully accomplished is the cytochrome. The other changes have so far failed to yield to this method. Therefore, we have to use other methods for differentiating these changes; to determine whether these many changes are due to one and the same molecule or due to different molecular species.
One way of doing this would be to measure the rate at which the changes appear at the different points in the optical spectrum. If the rates are different, either for their appearance or disappearance, then quite obviously they are due to different molecule species. If the rates are the same, they may or may not be due to the same molecular species.
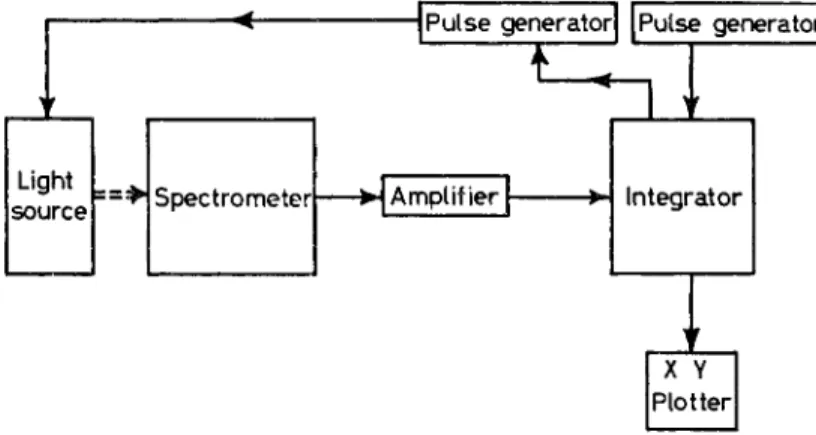
We are now trying to distinguish between all the various changes which we see in the steady light by the rate at which they appear or disappear upon flash illumination. We are using the methods of repeated flash photolysis, shown here in Fig. 15. The change in optical absorption takes place even at liquid helium temperatures. Therefore, one can be fairly sure that these changes correspond to no ordinary chemical reactions occurring at this temperature.
244 ENERGY CONVERSION
produced by a single fast pulse of light is often so small that it is hidden in the noise. What we have done is put on a pulse of about 100 msec of light and recorded the growth and decay of the change, and we have done this repeatedly. We have had the apparatus coupled together in such a way that every time we go through this scanning operation we start at the same point in time with respect to the light flash, and just kept adding up the figures. The noise is random and cancels itself out.
Figure 16 shows some of the kinetic results of the flash photolysis.
With R. rubrum chromatophores you can see that the change at 433 nm has quite a different decay rate than the change at 792 nm and 810 nm,
Pulse generator!
l Pulse
generator t « -Light
source Spectrometer Amplifier Integrator
I χ γ
Plotter FIG. 15. Block diagram for kinetic studies.
which, in turn, is different from the decay rate at 865 nm. This already tells us that these three changes—the 433, 792-810 and 865—are indeed due to three different species. They are disappearing at different rates and are therefore not due to the same species. This is an important piece of evidence because it looked at the start as though the 792-800 nm band was right on the side of the 865 nm band, and we thought they were vibrational components of the chlorophyll absorp- tion band. It now appears that they are two different pigment changes
—they may both be chlorophyll, but, if so, they are two different chlorophyll molecules. The change at 433 nm is spectacularly different and quite obviously is not the Soret band associated with the 865 nm pigment. These are three different species, then.
With this kind of technique, in which we can measure accurately growth and decay rates of signals, we can now compare the growth and
INTRODUCTORY LECTURE 245
FIG. 16.
shows its unpaired electron, which it should show if a single electron transfer has been made. Figure 17 shows that comparison, and you can see the fine wavy line which is the growth and decay (performed by the flash photolysis method) of the paramagnetic resonance signal.
It is quite evident that it does not correspond at all with the decay of the 865. The 865 change decays much more rapidly than does the unpaired electron. The unpaired electron, however, does decay at the same rate as the 433 change.
This information has one positive and one negative consequence.
The positive fact is that it looks as though whatever is changing at 433 decay rates, say, in the R. rubrum chromatophores, of the oxidized chlorophyll, which is measured by the change at 865 nm, with the growth and decay rate of the unpaired spins in the same organism, which we can produce with the same light. We now have two different ways of looking at the material. We can observe the optical absorption at 865 nm, which seems almost certainly to be chlorophyll. We can examine it in the 3 cm microwave region, which 'sees' an unpaired electron, and we can determine whether the oxidized chlorophyll
246 ENERGY CONVERSION
0 2 4 6 8 10 12 U Time (sec)
FIG. 17.
negative observation may be important. The situation may be rep- resented by the following change, showing the electron transfer from the excited chlorophyll molecule in its special location (Fig. 18). We recognize the chlorophyll positive ion radical by its 865 spectrum, but no EPR can be identified with it yet. If this were an ordinary chloro- phyll, either by itself in solution or attached to the protein molecule, and was indeed a single chlorophyll molecule not interacting with other chlorophyll molecules, we would and should see an unpaired electron on it as we do with other organic free radicals, but we do not. Thus, (i.e., whatever that change is due to) is very closely associated with, if not identical to, the species responsible for the unpaired electron. It also tells us, negatively, that the oxidation of chlorophyll by the removal of one electron, which we can demonstrate with ferricyanide corres- ponds to that 865 change, does not show an unpaired spin. This is an important negative conclusion, and is one of the few cases in which a
INTRODUCTORY LECTURE 247
[O] [R]
Ch*+A-
- Δ O.D.
865 + A
No EPR
FIG. 18.
The unpaired spin is presumably delocalized over the whole bed of chlorophyll molecules in one of the chromatophore pigment particles.
This derealization may very well be the essential process for the separation of the intermediate oxidant and the intermediate reductant.
Since this is delocalized and can, in effect, move from one chlorophyll to another, it can be conceived as a charge migration in an array of chlorophyll molecules. This is what we suggest as the heart of the energy conversion process: that the separation occurs by virtue of electron derealization in an array of chlorophyll molecules.
SPECTROSCOPY IN QUANTASOMES FROM GREEN PLANTS In green plants we can also do microwave and optical studies. Figure 19 shows a result of the examination with microwave frequency. It is an absorption spectrum in the 9-kmc region which is induced in the chloroplasts by shining visible actinic light on them and shows the presence of unpaired electrons in the green materials. T w o kinds of spectrum are clearly visible (Fig. 19 (a)). The separation of the two different kinds of unpaired electrons can be achieved by separating the chloroplast into the non-green component (c) and the green component (d). We have separated out most of the broad band, which
although the presence of the chlorophyll positive ion radical can be demonstrated by the optical density change at 865 as an oxidized chlorophyll by a ferricyanide titration with one electron missing, it shows no unpaired spin. This may mean that the unpaired spin is not localized on that chlorophyll molecule.
248 ENERGY CONVERSION
FIG. 19.
electrons rather than producing an isomerization, tautomerization, etc.—that it was actually separating paired electrons from each other [*3> Η]·
Figure 20 shows schematically, on the left where it is labelled 'bacteria', a model of the process as we now hypothesize it: Light absorption by the chlorophyll molecule, exciton migration from one is present in the intact chloroplast, and have left only a very sharp, narrow, very rapidly decaying signal which is characteristic of the green component of the chloroplast. We thus have evidence that light has introduced unpaired electrons into the green material of the plant.
This is the first clue which we had that the light was actually unpairing
INTRODUCTORY LECTURE 249 chlorophyll molecule to another in this array until the exciton finds its way to a specific localized pigment, at which place specific electron transfer occurs, followed by hole migration to another point at which the cytochrome is oxidized. This process—absorption, exciton migration, electron transfer and hole migration—can take place even at liquid nitrogen temperatures. From that point on, it is chemistry, in both plants and bacteria. The essential feature is exciton migration
Hole migration Light absorption
Exciton migration Electron transfer
Electron t r a n s f e r ^ Exciton migration Light absorption
\ 1H20-»021
. C h i . (680) Electron migration
FIG. 20.
following absorption, electron transfer perhaps in a charge-transfer complex as the initiation of the quantum converting act, but the quantum conversion is not complete until the hole is separated from the electron. That kind of separation has to be achieved in some way, and we are proposing that it is achieved in this array by charge migration.
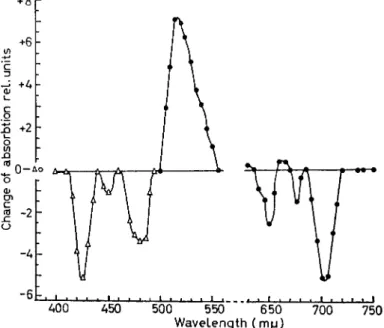
The difference spectrum (light-minus-dark) for some plants (Scenedesmus) is shown in Fig. 21 and it exhibits the same kinds of effects that we saw with the bacteria, except it doesn't go out beyond 700-800 nm. The main difference lies at about 700 nm. That change
250 ENERGY CONVERSION
+ 8 r
WaveLength ( rmj)
FIG. 21. Scendesums difference spectra (after Κοκ).
detail can be discerned. It shows a very large positive change at 520 and a negative change at 480. This particular change is dominating in most green plants, while it is present only to a very small extent, if at all, in the bacteria or blue-green algae. The identity of that change is not yet clear, although it is believed to be due to the presence of the plastoquinone in the chloroplasts, and may be due to a charge-transfer complex between the quinone and the chlorophyll. However, this has not yet been established. It may also be a charge-transfer complex between the carotenoid and the chlorophyll.
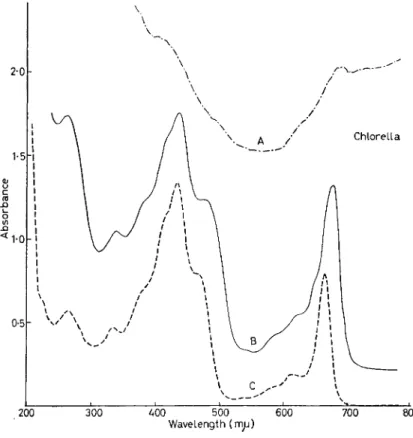
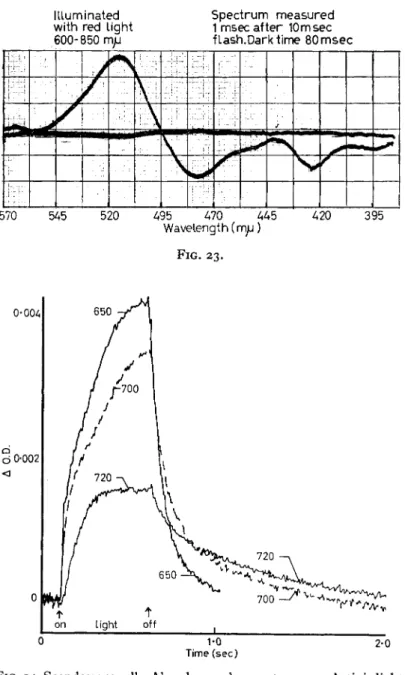
The kinetics of the absorption changes in the green plants can also be determined, and we are just beginning to do that on the same scale can be made the dominant one (at 705 nm), presumed to be at the ordered pigment which shows the electric dichroism. Figure 22 shows the absorption of the Chlorella cells corrected for light scattering, and the spectrum is shifted from what it is in chlorophyll in solution. In Fig. 23 is given a more highly resolved difference spectrum, taken on Chlorella, obtained with the flash photolysis, in which more significant
INTRODUCTORY LECTURE 251
.200 3ÖÖ ÄOÖ 50Ö 60Ö 700 800 Wavelength (nryj)
FIG. 22. Photo-induced absorption changes, Chlorella; ( J O . D . )m ax = i o- 3. Illuminated with red light 600—850 m/x; spectrum measured ι msec after 10 msec flash, dark time 80 msec.
of different wavelengths produces a different time course of change at 525. The 525 obviously cannot be due to a single kind of change, a single kind of electron transfer reaction ; it must have at least two, and perhaps more. It looks as though one of the component changes is brought about by the long wavelength at 720 nm, and both of them are brought about by the shorter wavelength at 650 nm. Thus, there that we did with the bacteria. Figure 24 shows some of the kinetics with intact Scenedesmus cells. It shows the time course of the changes at 525 nm only. The time course of that change is dependent on the wavelength of the light used to induce the change, that is, actinic light
252 ENERGY CONVERSION
Illuminated Spectrum measured with red light 1 msec after 10msec 600-850 mu flash.Dark time 80msec
570 545 520 495 470 445 420 395 Wavelength (mu )
FIG. 23.
on light off
0 V0 2-0
Time (sec)
FIG. 24. Scendesmus cells. Absorbance change at 525 ιημ. Actinic light on 0-5 sec, dark 3-5 sec. Excitation wavelengths 650, 700 and 720 τημ.
INTRODUCTORY LECTURE *53
2-0 r
1-51 ! / \ Porphyr id ium
I i I « 1 J* 1
200 300 400 500 600 700 800 Wavelength (m^i)
( a )
»4 LI ' ' • ' I ' • ' • I 1 1 ' ' I • 1 ' ' I ' • ' ' I ' ' ' ' I ' ' ' ' I ' ' ' ' I ' ' ' 1 I ' ' ' ' M
*2\-
-6h
- 8 -1 » • • • 1 • • • • I • » ' » * » ' « • I • » ' « 1 » « « • 1 « • • • I • • » 1 T 1 » » » > » 1 ' * '
400 500 600 700 800 Wavelength
(rryj)
(b)
FIG. 25. (a) Absorption spectrum of porphyridium [19]. (b) Light- induced difference spectrum on porphyridium [20].
254 ENERGY CONVERSION
Time (sec)
FIG. 26. Porphyridium cruentum cells. Absorbance change at 422 ταμ.
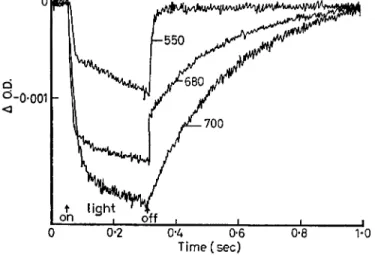
Actinic light on 0*25 sec, dark 0-75 sec. Excitation wavelengths 550, 600, 700 τημ.
produced by 700 nm light is quite different from what is produced by 550 nm light, as shown in Fig. 26. Here the change at short wavelength (422 nm, Fig. 25 (b)) brought about by different actinic light—700, 680 and 550—is examined. The light of 700 nm produces a change at 422, and the kinetics of this is quite slow. At 550 you see only fast kinetics for the change at the same wavelength (although a very slow component is there) ; at 680 you see a mixture of the two, both acts are being performed by 680 light, whereas at 700 and 550 there is only one act each. This is a demonstration that there are two different things being carried out by two different wavelengths and manifesting them- selves by the same absorption change at 422 apparent as a single peak in the J O . D . curve of Fig. 25.
would be two different electron transfer reactions showing an absorp- tion change at 525 in the green plant, one of them brought about by 720 nm light and both of them by the 650.
Figure 25 (a) shows the absorption of another alga (Porphyridium cruentutri) in which the two sensitizing pigment absorptions are much more readily separated. Here you can see quite different pigment systems, one absorbing at 700 nm and the other at about 550 nm. The latter are not present in the green alga. We can show that what is
I N T R O D U C T O R Y L E C T U R E 255
Ch a n c e has recently demonstrated in green plant chloroplasts and whole leaves that the oxidation of cytochrome and the oxidation of chlorophyll take place at the same time and that both of them occur at liquid nitrogen temperature when the light is turned on. In other words, here are two electron transfer reactions, one in which the elec- tron is being removed from the cytochrome as recognized by its change in spectrum, and the other in which an electron is removed from one component of the chlorophyll as presumed to be recognized by its change in spectrum. In neither case do we know where the electron is going. We now have here optical evidence that the light is really transferring an electron from one molecule to another, but so far all we have seen with the light are the molecules from which the electrons are being removed, and we have not yet seen unequivocally anything of where the electrons are going.
Q U A N T U M C O N V E R S I O N I N P H O T O S Y N T H E S I S
The foregoing is a confirmation of the notion that there are two different kinds of quantum conversion acts in the green plants, which was first really hinted at by the work of Em e r s o n [22] about ten years ago, when he found that he could increase the quantum yield of oxygen in a green plant by light of longer than 700 nm if he had, in addition to that, light at about 600 nm. In other words, the sum of the two quantum conversion acts, when two lights were shining on the plant together, was greater than when they were used on the plant separately. The products of these two different quantum converting acts could collaborate at producing higher efficiency than either one alone could do. This is the extra complication in photosynthesis in green plants. This is now a well established notion—that there are two different quantum converting acts in green plants, whereas it appears there is only one in bacteria. The nature of that collaboration has yet to be unequivocally established.
It is clear that information about the collaboration mechanism may be obtained from a detailed study of the kinetics of the production and decay of the optical density changes as they are effected by different wavelengths of actinic light applied in a variety of temporal and intensity relations to each other. Such work has already begun in various laboratories, relating different optical density changes with different actinic wavelengths [23, 24]. Now we are relating variable kinetics at one analysing wavelength as a function of different actinic
256 ENERGY CONVERSION
FIG. 27.
some acceptor. The oxygen redox level is only at ο·8 V, and the pyridine nucleotide level is only at — 0-4 V, and in between them lies about 1-2 V, which is just about what one quantum could do by itself.
It appears that the products of the two quanta can cross-react. Fig. 27 shows one current view of how they cross-react, with the plasto- quinone pool in between, and most of the high energy phosphate is created in the flow of the electrons from one act into the product or vacancies created by a second act. It looks as though, at the moment, most of the schemes which you will find in the literature involve two acts of this kind, with plastoquinone, cytochrome-/, cytochrome-è6 and plastocyanin, all in the intermediate region, coupling the two different quantum converting acts.
wavelengths, with two or more different molecular changes mani- festing themselves at single wavelength.
The general tone of some current ideas is contained in Fig. 27 which shows one way in which to set up the two different quantum converting acts [25]. The first one, called here hvt is suggested, in the case of the bacteria, as taking place with light in the 879-890 nm region, and in the green plant the changes are at 700 nm. This is presumed to be the first quantum converting act. A chlorophyll transfers an electron to
INTRODUCTORY LECTURE 257 However, the nature of the two-quantum converting acts would be the same in principle : exciton migration followed by charge migration in the final separation procedure. Both quantum converting acts as they now appear are shown in Fig. 20: the absorption of light by chlorophyll to give an excited chlorophyll ; the exciton migration from absorbed chlorophyll to particular sites in the quantasome or chrom- atophore ; the charge-transfer operation at that particular site, giving a hole and an electron ; and one or the other of these (perhaps both of them in the two separate pigment systems as indicated on the left and on the right of Fig. 20, can move by derealization amongst the chlorophyll array so that the oxidant and reductant are separated. In one pigment system the oxidant (hole) moves by derealization, and in the other pigment system, in the green plant, the reductant (elec- tron) moves by derealization. This, then, is what we are now using as our current hypothesis for the primary quantum conversion act as earlier defined. From this point on the process is biochemistry, involving ordinary enzymological reactions of the standard type, and the recombination can take place in a manner very similar to that which is occurring in oxidative phosphorylation to give high energy phosphate.
REFERENCES
The first three references given below are recent reviews of the problem of photosynthesis and quantum conversion.
ι. GEST H., SAN PIETRO A. and VERNON L. P . (eds.) (1963) Bacterial Photo- synthesis, Antioch Press, Yellow Springs, Ohio.
2. Photosynthetic Mechanisms of Green Plants, Publication No. 1145, National Academy of Sciences, Washington, D.C. (1963).
3. KAMEN M . D . (1963) Primary Processes in Photosynthesis, Academic Press, Inc., New York.
4. BASSHAM J.A. and CALVIN MELVIN (1957) The Path of Carbon in Photo- synthesis, Prentice-Hall, Inc., Englewood Cliffs, New Jersey; BASSHAM
J.A. and CALVIN MELVIN (1962) The Photosynthetic Carbon Cycle, W.A.Benjamin and Co., New York.
5. RABIN B . R . and TROWN P.W. (1964) Proc. nat. Acad. Sei., Wash. 5 1 , 497 ; TROWN P.W. and RABIN B.R. Proc. nat. Acad. Sei., Wash, (in press) ;
RABIN B.R. and TROWN P.W. Nature, Lond. (in press).
6. BASSHAM J.A. (1963). Advanc. Enzymol. 2 5 , 39.
7. MANNING W. M . , STAUFFER J.F., DUGGAR B. M . and DANIELS F . (1938)
J. Amer. chem. Soc. 60, 266 (1938).
8. EMERSON R. and LEWIS C M . (1941) Amer. J. Bot. 2 8 , 789.
9. WARBURG O., BURK D . and SCHADE L . (1951) Symp. Soc. exp. Biol.
5, 306.
17
258 ENERGY CONVERSION
10a. PARK R.B. and PON N . G . (1961)^. Mol. Biol. 3 , 1 ; (1963)7. Mol. Biol.
6, 105.
10b. LICHTENTHALER H . K . and PARK R.P. (1963) Nature, Lond. 1 9 8 , 1070;
LICHTENTHALER H . K . and CALVIN M . (1964) Biochim. Biophys. Acta 7 9 , 30.
ioc. PARK R.B. and BIGGINS J. (1964) Science 1 4 4 , 1009; PARK R.B. and
BIGGINS J. Nature, Lond. (in press).
11. SAUER Κ. and CALVIN M . (1962) J. Mol. Biol. 4 , 451.
11 a. SAUER Κ. Biophys. J. (in press).
12. BUTLER W . M . (1961) Arch. Biochem. Biophys. 9 3 , 413.
13. SOGO P . B . , PON N . G . and CALVIN M . (1957) Proc. nat. Acad. Sei., Wash.
43, 387.
14. COMMONER B., HEISE J.J. and TOWNSEND J. (1956) Proc. nat. Acad. Sei., Wash. 4 2 , 710.
15. RUBY R.H., KUNTZ I . D . Jr. and CALVIN M . (1964) Proc. nat. Acad. Sei., Wash. 5 1 , 515.
16. KUNTZ I . D . Jr., LOACH P . A . and CALVIN M . (1964) Biophys. J. 4 , 227.
17. ARNOLD W . and CLAYTON R. K . (i960) Proc. nat. Acad. Sei., Wash. 4 6 , 769.
18. Κοκ Β. (i957) Acta Bot. Neerl. 6, 316.
19. SHIBATA K . , BENSON A . A . and CALVIN M . (1954) Biochim. Biophys. Acta 1 5 , 461.
20. Reference 18, p. 324.
22. EMERSON R., CHALMERS R. and CEDERSTAND C . (1957) Proc. nat. Acad.
Sei., Wash. 4 3 , 135.
23. Reference 2, p. 18 (RUMBERG B., SCHMIDT-MENDE P., WEIKARD J. and
WITT H . T . ) .
24. DUYSENS L . N . M . , Reference 2, p. 1.
25. CALVIN M . and ANDROES G . M . (1962) Science 1 3 8 , 867.


![FIG. 14. Absorption changes at 4200 A induced by illumination (λ > 6400 Â) [i7].](https://thumb-eu.123doks.com/thumbv2/9dokorg/1174519.86002/21.621.145.445.180.402/fig-absorption-changes-induced-illumination-λ-gt-â.webp)