I N T R O D U C T O R Y L E C T U R E
The constraints that hem in visual theorizing, particularly if we are to insist upon quantitative theory, are astonishingly numerous. First and foremost among these constraints are the psychophysical data of the laboratory that result from systematic exploration of the visual phenomena which, in the last analysis, provide the incentive for any theorizing at all about the mechanisms of vision. The varieties of data to be encompassed in some coherent and (if possible) fairly simple fashion, include discrimination measures for light stimuli that vary in energy, spectral composition, spatial distribution and time, and for a variety of organism variables, such as retinal locus, pupil size, state of adaptation, 'normality', 'abnormality', etc. T o the discrimination measures we must add all the available matching data : monocular data, again for the same variations in stimulus and organismic conditions, and also binocular or haploscopic matching data which involve different stimulus parameters and organismic states in the two eyes.
And finally, although of primary importance, there are all the qualita- tive, simple and complex, perceptual phenomena that greet anyone with vision. The colours of the sunset are, after all, something rather more than wavelength predictors of tomorrow's weather, and the psychologists have developed techniques in the laboratory for des- cribing them (and other qualitative aspects of our experience) and in systematic relation to their stimulus conditions and organismic states.
On the basis of the psychophysical data the psychologist or psycho- physicist can develop a formal comprehensive quantitative model of vision which need make no reference to the data of the biochemist, and the neurophysiologist. What are the biological data ? These data may come from a single cone lying on a slip of cover-glass, a centrifuged, homogenized, purified and buffered retinal extract, a portion of the retina detached from an eyeball and placed under a microelectrode, a
L E O M . H U R V I C H
and
D O R O T H E A J A M E S O N
University of Pennsylvania
91
92 V I S U A L P R O C E S S E S I N M A N A N D A N I M A L S
wick electrode placed on the outside of the eyeball of an intact system, a single fibre of the optic nerve that has been teased away from its neighbours, a single cell in the lateral geniculate or cortex of an animal that has either been anesthetized or is a cerveau isolé preparation, the computer analysed evoked potentials measured either under or on top of the skull, the light reflected from the back of an eye before and after exposure to a dazzling light source, or an organic preparation presumed to simulate visual cell activity.
If the psychologist wants to make his formal comprehensive quantitative model of vision be not only a psychological model of vision but a psychophysiological model as well, he faces the additional constraints of all of the data obtained by the varieties of techniques just outlined. In developing and extending his formal theory of vision into a psychophysiological one, he must indulge in a good deal of specula- tion and interpretation. In order to bring some degree of coherence to this complex of material—which is being added to, modified, and in some cases even disclaimed with the arrival of each new issue of the journals—the visual theorist must postulate plausible interrelations.
Only then can he proceed to see how the visual mechanism can behave physiologically to fulfill the lawful relations that are required by the perceptual data—discrimination, matching and qualitative ones. The task is a formidable one.
In the light of this perspective, what has been done in the way of theorizing? Without attempting to be exhaustive, what kinds of examples can we point to ?
SELIG HECHT'S theorizing was formal, quantitative and encompassed a wide variety of psychophysical data relating to bright and dark adaptation, visual acuity, intensity discrimination, flicker and colour vision (HECHT, 1934). His analysis placed too heavy a burden on photo- chemical events and some of his photochemical postulates have turned out to be wrong. His model building remains, nevertheless, a model in itself.
CROZIER was equally quantitative but more insistent than HECHT that the parameters of the functional relationships should have 'biological meaning'. As for mechanism specificity, he was at the polar extreme from HECHT. Populations of neural elements and their statistical behaviour, rather than receptor photochemistry, were the physiological items of significance to him. Unlike HECHT, CROZIER concentrated his theoretical analysis on intensity discrimination and its variability—a knowledge of which would, according to him, account
I N T R O D U C T O R Y L E C T U R E 93 for the visual acuity and especially the flicker data of a large variety of organisms (CROZIER, 1935; HURVICH, JAMESON and KRANTZ, 1964).
Quite unlike both of these systematic and analytical approaches which were based on a continuing programme of research, there have been hundreds of other single and unsustained efforts of various sorts.
Some idea of their number and variety can be gained from MÜLLER- LIMMROTH'S (1956) summary paper on colour theories.
An example of one such theoretical effort is found in TALBOT'S two papers (1951a, 1951b). With considerable knowledge and awareness of the psychological and psychophysical data, TALBOT has taken the complex histological picture of the retina and assigned specific modes of functioning and linkages to individual types of cells and networks of cells. His theorizing lacks formality and there is no mathematical development. T o the best of our knowledge there has been no follow- up work and the theory might better be characterized as a psycho- anatomical theory rather than a psychophysiological one.
In contrast to TALBOT'S effort which rests on assigning functions to known anatomical structures, there are occasional efforts which take an existing formal theory, say, of the opponent-colours type, and seek to provide it with material underpinning by using engineering ana- logues for scanning systems suggested by, say, the block diagrams of television or the circuitry of radar electronics. This is a useful exercise for the engineer but offers little advance to the visual scientist.
Nor is the picture clarified or our understanding advanced by the kind of approach that rests on sweeping generalizations that are neither precise nor comprehensive. A n example here is the kind of generalization that sensationally reduces the stimulus domain to combinations of short- and long-wave records (LAND, 1959) or, in close analogy to conventional three-layer colour film, postulates three spatial records of relative luminance in three qualitatively different systems (LAND, 1964).
Investigators who are exploring the biochemical and neuro- physiological details of the complex visual mechanism need not, of course, be concerned with theories of vision as such, although they may be deeply involved with the development of theories of the physiological mechanism per se. T o find ourselves immersed in some of the theoretical issues and developments here, we need only ask, for example, what is the source of the E R G ? What is the nature and source of the generator potential ? What role do the glia cells play in SVAETI- CHIN'S * S ' potentials ? How are lateral geniculate and cortical activities
94 V I S U A L P R O C E S S E S I N M A N A N D A N I M A L S
related ? Or at the biochemical level, what are the details of the rhodop- sin, vitamin A, retinene cycle, the roles of the isomeric configurations at various stages, or the functional significance of nucleic acid deriva- tives ? (MORTON and PITT, 1957; BRINDLEY, i960; SVAETICHIN et al, 1961; DARTNALL, 1962; GRANIT, 1962; HUBEL, 1963; N O E L L , 1963;
RATCLIFF et al, 1963 ; T O M I T A , 1963 ; W A L D et al, 1963 ; M C C O N N E L L ,
1964.)
The hypotheses involved here are speculations about biochemical and physicochemical processes at the tissue, cellular or molecular levels. The constraints upon the theories are accordingly those imposed by the data of biochemistry and physics. Such physiological, bio- chemical theorizing need not be constrained by the data of vision, human or animal. And, properly speaking, they are not theories of vision.
Only when the mechanisms explored are interpreted in relation to their functional significance for the phenomena of vision, that is, the discrimination data, the matching data and the qualitative perceptual data, do the physiologists find themselves faced with the same body of constraints that guide and limit the psychologist or psychophysicist.
It is not surprising that each specialist sees his own molecule, cell or tissue complex as the major functional variable in the total mechanism.
Nor is it too surprising that his field of view tends to be focused on the one or two visual phenomena that he or his experimental animal is best able to cope with. Alternatively, his findings may be related to a wide range of phenomena but in this case in a very general, correlative fashion at the expense of rigorous, testable statements of relations (JUNG, 1961).
We are not assuming the role of philosophers of science to discourse on what is explanation, issues of levels of explanation, or the merits of field theory vs. reductionistic hypotheses. Nor are we prepared to lay down canons for the integration of formal theories with physiological data. It is easy to say what a theory should be if it is left in someone else's hands to develop.
What we should like to do rather is to survey a specific visual problem, to look at some of the complexities of the psychophysical data, the difficulties of formal statement and the information that can be brought to bear on it from the work of the biologists. The problem we have selected is that of colour adaptation. This is a problem on which considerable work has been done and since we cannot, in our allotted space, do justice to all of those investigators who have been
I N T R O D U C T O R Y L E C T U R E 95 concerned with it, we shall illustrate the points we wish to make primarily by reference to our own research.
Adaptation is essentially an organismic variable that pertains to a change in bodily state. We are all familiar with the way a very large change in illumination from dim to very bright makes it momentarily impossible to see effectively in the presence of the dazzling light until the organism adapts or adjusts to the new situation. Or if we are reading a printed page and the room light is suddenly dimmed, we are effec- tively plunged into darkness for a moment and are unable to continue our reading until we have adapted once again to the prevailing low illumination. The complete process is relatively slow and detailed laboratory studies of these phenomena are innumerable.
Colour adaptation is probably most effectively appreciated in the everyday situation by comparing the appearance of objects both before, and after putting on a pair of coloured sunglasses. Immediately upon placing the coloured glasses in front of our eyes the appearances of many objects change. This initial change is determined by the overall illumination, the spectral reflectances of the individual objects and the nature of the coloured lenses. As the glasses continue to be worn, the large initial changes are attenuated and in time things tend by and large to look as they did before the glasses were put on. With the selective filters before the eyes, the spectral distributions of the retinal images have been changed, and the recovery of something like the original object colours obviously comes about because of modifications in the visual system.
Less dramatic but more common are the colour adaptive changes we are subject to as the outdoor sky and sunlight illumination varies or as we move from a bluish outdoor illumination to, say, an indoor incandescent illumination. In the latter instance, a sudden change produces detectable object colour changes, but soon adaptive processes set in and things again tend to take on their original colour appearance : a white shirt is recognized as white indoors or outdoors.
What are the stimulus conditions for the perception of whiteness ? We explored this question in the laboratory a number of years ago (HURVICH and JAMESON, 1951a; JAMESON and HURVICH, 1951a). What we did was to illuminate a magnesium oxide surface successively with a number of different illuminants. When the colour temperature of the light was high (io,ooo°K) the surface looked bluish. When it was low (2,80ο0 K ) it looked yellowish. The surface looked white at some intermediate colour temperature of approximately 5,50ο0Κ
φ V I S U A L P R O C E S S E S I N M A N A N D A N I M A L S
pi I I I I L _ 10,000 7500 5000 2500
Colour temperature in degrees Kelvin
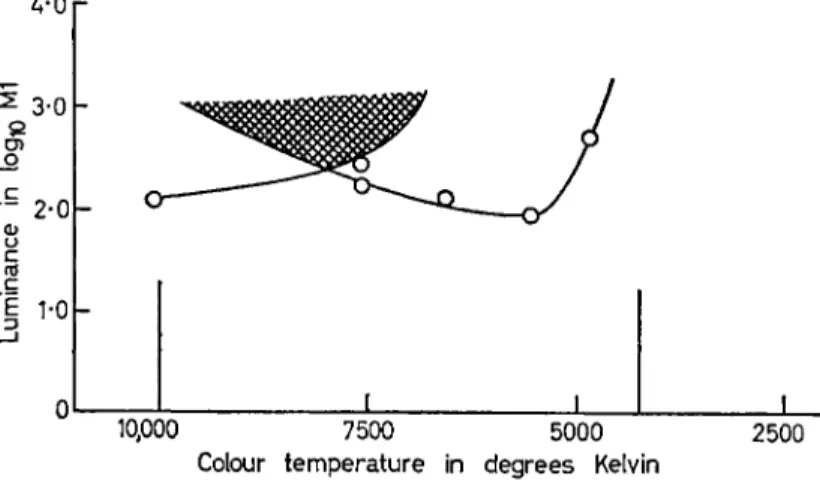
FIG. Ι . White threshold contours for two adapting and surround fields, 43θθ°Κ and io,ooo°K, as indicated by vertical bars on abscissa.
Angular size of adapting fields = 47° and luminance level = 1 5 mL.
Colour temperature of 11*7° test field is shown on the abscissa, and the minimal log luminance required for a 4white* response is shown on the ordinate. Test stimuli that plot above each threshold contour all appear white for that adapting condition, and stimuli that plot within the cross-hatched area appear white for both adapting con- ditions.
by saying that the visual system becomes less sensitive to those wavelengths of light to which it is most strongly exposed and the mechanism is a compensatory one. The illumination changes, the retinal stimulus changes and the visual mechanism makes a compensa- tory adjustment to produce a constant perceptual effect.
But this is only part of the picture. When we varied the energy level as well as the spectral distributions of our stimuli we found that what did or did not appear white for any given adaptation depended very strongly on the test stimulus luminance. As a matter of fact, if the luminance was sufficiently high, we found a range of colour tempera-
This occurred when the surface was seen in a dark surround. If the eye was first adapted to various colour temperature distributions, not surprisingly, the colour temperature that appeared white changed. If we adapted to a high colour temperature, the stimulus that now looked white was close to the adapting colour temperature. If we adapted to a low colour temperature, then a low colour temperature stimulus looked white (HURVICH and JAMESON, 1951b). This is easily explained
A - O r
I N T R O D U C T O R Y L E C T U R E 97 tures that evoked the same white response whatever the state of adaptation. The effectiveness of the adapting light clearly decreases as the intensity of the test stimulus increases (see Fig. i).
Let us now go to the other extreme of spectral distributions and consider what happens with monochromatic spectral lights. In the dark, with the visual system in a neutral condition of adaptation, we can find three wavelengths in the spectrum that evoke unitary hue perceptions, that is, a yellow that is neither reddish nor greenish, a green that is neither bluish nor yellowish and a blue that is neither reddish nor greenish. For this same neutral state of adaptation, these same wavelengths are the only spectral lights that maintain the same hues as the luminance level is changed (HURVICH and JAMESON, 195 ic).
All other wavelengths become either more yellowish or more bluish as the luminance level is increased. If we pre-expose the eye to a coloured adapting light two things happen: first, the wavelengths that evoke the unitary or unique hues are shifted and now, for example, with a reddish adapting light, a longer wavelength will be necessary to produce unitary yellow than for the neutral state. And second, if we change the intensity level of the wavelength that looks yellow, it is no longer true that it will remain uniquely yellow (JAMESON and HURVICH, 1951b). The converse of this is that if we now seek a wavelength that has the same hue at two different luminance levels the hue that it evokes is no longer a unitary one. Instead of yellow, for example, the wavelength that has the same hue at the two different luminances may appear reddish-yellow or greenish-yellow.
The changes that we see under these conditions are not small.
Something that looks unitary yellow in one state of adaptation may look startlingly greenish or strongly orange when the colour tempera- ture of the surround is changed. Moreover, if the surround is, say, reddish, a decrease in the intensity only of the wavelength that looks yellow, will cause it to appear greenish. We have measured changes of this sort in the spectrum in hue scaling experiments (JAMESON and
HURVICH, 1959) (see Fig. 2).
Although the hue changes are very striking, we did not perceive any very marked brightness changes in either the whiteness experiment or those with monochromatic light stimuli when the colour of the adapting light was changed. The obvious interference from these observations is that the brightness and hue mechanisms work more or less independently of one another. We tested this experimentally by measuring the threshold spectral luminosity function for a series of
7
98 V I S U A L P R O C E S S E S I N M A N A N D A N I M A L S
0-5
c φ ΰ 0 £ 1 Ό φ ο ο
0-5
450 500 550 600 650 Wavelength (mu)
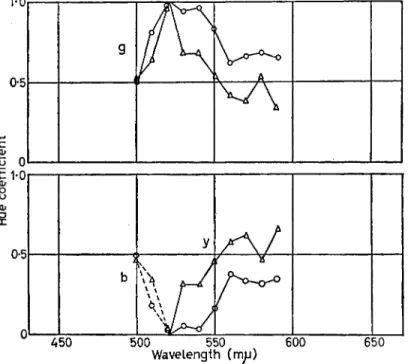
FIG. 2. Spectral hue scales. The ordinates in the lower graph represent the percentage (or coefficient) of blueness or yellowness and in the upper graph the percentage (or coefficient) of greenness reported by the observer at the specified wavelengths. For the fixed red surround (chromaticity co-ordinates, χ = o-yi, y = 0-29, and luminance level = 30 mL) the observer reports that the test stimuli appear blue-green from 500 nm through 520 nm and yellow-green from 530 nm through 590 nm. At 3 mL (open circles) all stimuli are relatively more green than when the same test stimuli are exposed at a higher luminance level of 30 mL (open triangles).
luminosity function on chromatic adaptation. The effects are system- atic and unquestionably reproducible. They show decreases in brightness sensitivity to the wavelength regions to which the eye has been exposed, but these sensitivity changes are rather small compared with the hue and saturation changes that are observed for the same adapting stimuli (see Fig. 3).
9
adapting fields all at the same luminance level but of different wave- lengths (JAMESON and HURVICH, 1953).
The data are unambiguous. There is some dependence of the
1-0 — — —
I N T R O D U C T O R Y L E C T U R E 99
Wavelength -mp
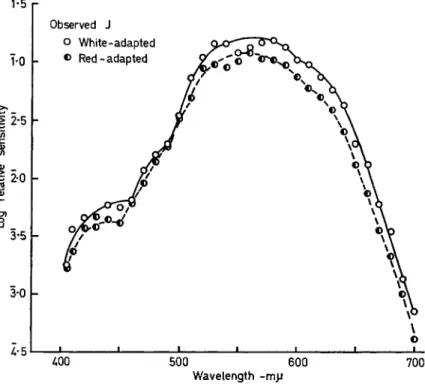
FIG. 3. Foveal sensitivity for two adapting and surround conditions.
Elliptical test field i°xo-8°. Adapting field circular 370. White and red adapting fields both = 1 0 m l .
matched to each other in luminance, and we used a series of intensity levels both for the surrounds and the test fields. The brightness matches were influenced by the colour of the adapting lights in much the same way as the threshold measures and the magnitude of the effect is again small. Moreover, although there is considerable variability in making heterochromatic brightness matches, the data definitely suggest that the differential adapting effects in different In order to explore the effect of colour adaptation on spectral brightness for different brightness levels, we extended these experi- ments by making brightness matches between different spectral lights rather than using the threshold technique (HURVICH and JAMESON, 1954). Again, the adapting stimuli of different wavelengths were
ΙΟΟ V I S U A L P R O C E S S E S I N M A N A N D A N I M A L S
spectral regions are more marked the lower the intensity level of the test stimuli in relation to that of the adapting fields. Thus, instead of the standardized photopic luminosity function, we have as many slightly different photopic luminosity functions as there are different chromatic adaptive states and stimulus luminance levels.
In contrast to the brightness match situation, on the other hand, complete metameric colour matches are invariant with these same changes in colour adaptation. We, like many others, have confirmed this experimentally. Although the fact is stated repeatedly in the literature, the experiments are worth doing to observe the large and dramatic perceptual changes that the stimulus fields undergo while the match between them remains a match.
This invariance of metameric colour matches places a very strong restriction on the way the relative sensitivities of the different mechan- isms can be varying. It provides the strongest support for the VON KRIES' coefficient law which assumes that each of the underlying spectral distribution functions maintains an invariant form even though the overall amplitudes of the different functions may vary relative to one another (VON KRIES, 1905).
But how, we may ask, does the coefficient law gibe with the intensity dependence we have been talking about ? In fact, it leaves no room for such intensity dependent effects as a simple exercise in arithmetic shows. If we have three mixture stimuli that give rise to three excita- tions of amounts 1, 2 and 3, a proportional increase in all three mixture stimuli will yield, say, excitations of 2, 4 and 6 and the ratios are unchanged. If the balance of sensitivities is now altered by colour adaptation so that the same stimuli produce excitations of 1, 1 and 1 at the lower stimulus level, the coefficient analysis says they will be 2, 2 and 2 at the higher level. Thus, in spite of the demonstrable dependence of the adaptive effects on perceived hue and brightness, the coefficient law predicts that complete colour matches across different adaptive states should show the same mixture proportions at all levels of stimulus luminance.
In view of the data already at hand, this seemed unlikely indeed.
However, to explore the matching situation specifically, we turned to a haploscopic set-up, where the test and comparison stimuli are viewed separately by the two eyes, and where the adaptive state is separately controlled in the two eyes. In this experiment, the three-variable mixture stimuli of the comparison field were presented to the left eye that was maintained in a constant, neutral state of adaptation. A near-
I N T R O D U C T O R Y L E C T U R E ΙΟΙ
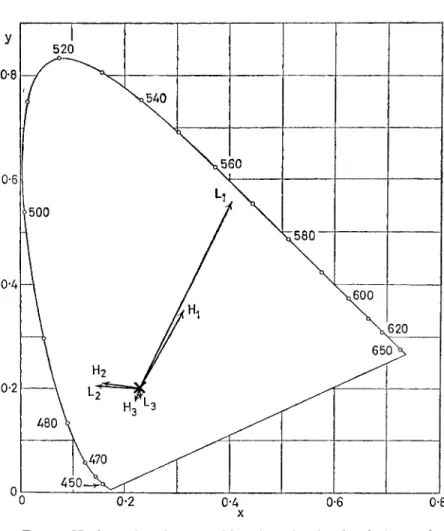
white test stimulus was seen by the right eye, and matches were made to this stimulus at two levels of stimulus luminance. At first the matches were made with both eyes in the same neutral adaptive state, and then they were repeated after the right eye had been exposed to a coloured adapting field. For the different adaptation conditions in the two eyes, the mixture proportions required for the match changed, of course. But they did not change in the same proportions for the two luminance levels of the same test stimulus (HURVICH and JAMESON, 1958) (see Fig. 4).
The results of such experiments make it clear that we cannot simply apply the coefficients analysis across different states of colour adapta- tion. The sensitivity distributions, the adaptation coefficients, and the test stimulus distributions are the same for the two luminance levels.
But a combination of sensitivity distributions and adaptation co- efficients that will predict the matching stimuli for the two states at one level of luminance is of no predictive value for matches made at another level of luminance.
This fact of the intensity dependence of such matches for different adaptive states clarifies a variety of problems encountered by those who have tried to apply a simple coefficient analysis to account for the different stimulus distributions that they have found to be percep- tually equivalent for different adaptive states. Analyses of this sort have yielded either too many sensitivity distributions and too many coefficients (STILES, 1953; M A C A D A M , 1956), too few sensitivity distributions and too many complex roots (BREWER, 1954), or empirical generalizations that describe the data but that are not simple relations involving three sensitivity distributions and three adaptations coefficients (BURNHAM et al, 1957). We believe also that it is the implicit acceptance by STILES of the inadequate coefficient principle that is responsible for his having to postulate an increasing number of different sensitivity distributions to account for his increment threshold data for different adapting fields.
If a change in the balance of sensitivities is inadequate to account for the data of colour adaptation, then something different or something more must be happening. Suppose that the activity brought about by the response to the adapting stimulus itself engenders a fixed increment or decrement in the response to the test stimulus. In most general terms, the subtraction of a certain amount of, say, redness activity would alter colour appearance in much the same way as would a reduction in long wave sensitivity. The quantitative law that such a
102 V I S U A L P R O C E S S E S I N M A N A N D A N I M A L S
0 0-2 0-4 0-6 0-8 x
FIG. 4. Haploscopic colour-matching data showing break-down of von Kries coefficient law. Test field chromaticity is shown at point X for two luminance levels (approximately 1 mL and 10 m l ) when test field and a comparison field made up of variable mixture of 460 nm, 530 nm and 650 nm are both seen in dark surround. With left eye adapted to heterogeneous near neutral distribution (10 mL), and the right eye adapted to a 450 nm stimulus of same luminance, the match for the high luminance test stimulus was the chromaticity indicated by the arrow head at and for the low luminance test stimulus at the point labelled L j . For right eye adapted to 610 nm, comparable matches for the two test-field levels are at points H2 and L2, res- pectively, and H3 and L3 indicate the matching chromaticities for the right eye adapted to 550 nm.
I N T R O D U C T O R Y L E C T U R E IO3
Wavelength in(mu)
FIG. 5. Spectral Saturation Scales. Percentage (or coefficient) estimates of the relative amount of the chromatic component in the perceived colour is plotted on the ordinate. The blue-green surround (chroma- ticity co-ordinates χ = 0-21, ^ = 0-37, luminance = 30 mL) is the same in both upper and lower graphs. The test stimuli scaled in upper graph were at a 30 mL level, those shown in the lower graph were at a luminance level of 15 mL. Note relative loss in spectral saturation for region 490 nm through 550 nm with decrease in test stimulus luminance level.
With this kind of process in mind, we have carried out experiments in which we scaled perceptually the hue, saturation, and brightness of spectral colours for different conditions of colour adaptation and for different levels of test stimulation (JAMESON and HURVICH, 1959) (see Figs. 5 and 6). We have measured wavelength discrimination using process follows is, however, quite different. Here we have an algebra- ically additive rather than a multiplicative law. An additive law, moreover, makes all the effects dependent on the test stimulus luminance, and this is just what we have been looking for.
1-0 1 1 1 1 1 1 1 I
104 V I S U A L P R O C E S S E S I N M A N A N D A N I M A L S
3-0-1
Log luminance
FIG. 6. Brightness scales for test stimuli of two different wavelengths (500 nm—circles ; 650 nm—triangles) seen in red surround. (Surround chromaticity : χ = 0-71 ; y = 0*29; 30 mL.) Note that differences in apparent brightness for test stimuli of same luminance are much greater at low than at high luminance levels.
complex fields building up from simple pairs to variegated stimulus patterns (JAMESON and HURVICH, 1961) (see Fig. 8). We have, more- over, measured colour changes that occur with stimulus exposures that last only for a few milliseconds both when the stimuli are exposed different adapting and surround fields for different levels of uniform spectral brightness (HURVICH and JAMESON, 1961) (see Fig. 7). We have also explored the multiple interactions among elements of
I N T R O D U C T O R Y L E C T U R E I O 5
FIG. 7. Wavelength discrimination for two adapting/surround condi- tions. Open circles are experimental points for a yellowish-red (Wratten No. 30) surround and filled circles are experimental points for a bluish- green (Wratten No. 38A) surround. Surround luminance is 10 mL in all instances. L2 : test luminance = 20 mL ; Li : test luminance = 10 mL ; and L0.5: test luminance = 5 mL. Note that differences in discrimin- ability are greater at lower test luminances.
In general, all these experiments show that not only do the effects of exposure to a background or adapting light depend on all the characteristics of that light, but also that, for test lights of any given simultaneously on different parts of the retina and when they fall successively on the same part of the retina (JAMESON and HURVICH, 1962).
Ιθ6 V I S U A L P R O C E S S E S I N M A N A N D A N I M A L S
wavelength composition, the changes are greater as the test stimulus luminance is decreased.
T o account systematically for the variety of data, our model of the opponent-colours theory makes provision for two types of process governing changes in perceived colour (HURVICH and JAMESON, i 9 6 0 ; JAMESON and HURVICH, 1 9 6 1 , 1 9 6 4 ) . One type of process controls sensitivity changes and follows a three-valued multiplicative co- efficient law, the other deals with the induced activity changes and
k+0-10
Mean weighted y of inducing areas
0 +0-1 +0-2 + 0-3
Mean weighted +0-1 +0-2 of inducing areas
FIG. 8. Graph shows the manner in which perceived colour in a com- plex test pattern is affected by the mutual interactions among the components of the total field. The Ar' values of the left ordinate represent increases in redness ( + ) or greenness (—), and the Ay' values of the right ordinate the increases in yellowness ( + ) or blue- ness (—) of the individual areas of the complex pattern. They are shown as a function of the mean redness or greenness (lowermost abscissa) and mean yellowness or blueness (uppermost abscissa axis) of the inducing areas. For these complex patterns a weighting factor has been introduced for different spatial separations of focal and inducing areas. The data summarize the results of experiments based on ten groups of observers and are a comprehensive representation of all the induced colour changes measured for all test pattern chroma- ticities and for all degrees of stimulus pattern complexity used. The numerical computations are in terms of opponent response values transformed from stimulus matches.
I N T R O D U C T O R Y L E C T U R E IO7
follows an algebraically additive law. We should like to say paren- thetically that, although the phenomena of adaptation are generally thought to reflect sensitivity changes as distinct from so-called contrast effects, we do not believe it is possible to design a visual experiment or point to a visual phenomenon for which we can say decisively that one of these kinds of processes is involved to the exclusion of the other.
Our formal definition of perceived colour states that in the total visual field, the perceived colour of a stimulus element, considered as a discrete element in time and space, is determined by a three variable complex of responses in the visual system.
C = 2> 3p(kt exXx), I(k2 e\ Ψλ), I(k3 exQx)] + IU2>3 Note that the definition incorporates the stimulus distribution βχ, the triplex of sensitivity functions Χχ, Ψ χ and Ωχ, the multiplicative adaptive coefficients ku k2 and k3, and the term Ilt 2, 3 for the triplex of incremental response magnitudes, f 1,2,3 represents the non-linear functions of the integrated products in parentheses.
Where in the physiology of the system do we look for either or both of these kinds of processes involved in the phenomena of colour- adaptation ?
In our search for a triplex mechanism of variable sensitivity changes, we naturally turn first to the cone photopigments. Our first problem is to identify them. But, as DARTNALL (i960) has pointed out, the cone photopigments are elusive. In solutions of retinal extracts only chicken iodopsin ( AM A X = 562) has been identified as a cone pigment, and there is no evidence from such solutions of three different pigments that are usually thought to be necessary for the initial wavelength selectivity that is basic to normal human colour vision.
The development of reflection densitometry was looked upon by many (including ourselves) as holding great promise for identifying the human cone pigments. In this area, however, there is much room for alternative interpretations of the different spectra measured. There are questions about photoproducts, selectivity of bleaches, varying percentages of stray light, degree of agreement with action spectra, etc. Thus, for example, early measures interpreted by RUSHTON (1958) to mean two distinct photopigments are now interpreted to mean one photopigment and its photoproducts (RUSHTON, 1962); and RIPPS and WEALE (1964) have still a different interpretation. They believe that RUSHTON'S difference spectra show peaks at different wavelengths in different experiments because his selective bleaching lights involve
Ιθ8 V I S U A L P R O C E S S E S I N M A N A N D A N I M A L S
more than one pigment in every case. Thus different intensities of the same bleaching light will yield different combinations in the resulting difference spectra.
Work on in situ suspensions also points up the photoproduct difficulties (DARTNALL, 1962). But obviously none of these problems are ultimately insoluble, and we are now beginning to get additional information from direct measures of light absorption in individual
receptor elements (HANAOKA and FUJIMOTO, 1957; SVAETICHIN et al, i960; W O L K E N , 1962; MARKS et al, 1964; BROWN and W A L D , 1964).
Apart from the precise spectral absorptions of the cone photo- pigments, there remains one item that we should like to mention about the relation between bleaching and colour adaptation. In the early days of photochemistry, it was thought that HECHT'S photochemical equations for bleaching and regeneration in dilute solutions of rhodop- sin would account cleanly and simply for the time course of the sensitivity changes during bright and dark adaptation, and also for the magnitudes of the sensitivity changes. Rather surprisingly when HECHT came to treat the problem of colour vision, his model said nothing at all about the mechanism or data of colour adaptation. Even in simple bright and dark adaptation, however, a major discrepancy between the magnitudes of photochemical change and magnitudes of sensitivity change recorded electrophysiologically was first pointed out by GRANIT, MUNSTERHELM and ZEWI (1939) and later studies have confirmed this discrepancy without any doubt (BAUMGARDT, 1950;
DODT, 1961). RUSHTON'S most recent work (1963) suggests that bleaching in the cone photochemicals is like that in the rods. In the cones, as well as the rods, there appears to be no simple proportionality between concentration and sensitivity. T h e transformation is non- linear and approximately logarithmic so that a unit change in con- centration is related to a log step in sensitivity throughout much of the range. In colour adaptation, where three different spectral distribu- tions are concerned, a non-linear transformation between pigment bleaching and sensitivity change must be localized so as to permit the linear integrations that are still required by the laws of colour mixture and colour arithmetic. This linear requirement is something that must be kept in mind by psychologists and physiologists alike in evaluating alternative hypotheses to account for the non-linear relations to sensitivity.
Should we assume that sensitivity changes per se are controlled entirely by bleaching and regeneration in the photoreceptors ? That
I N T R O D U C T O R Y L E C T U R E IOC neural tissue also changes its responsiveness to stimulation we all learned when we first heard of the nerve impulse and its refractory period.
To cite a few instances of the findings relevant to this issue, general- ized inhibition effects have been reported by D O D T (1956) for the rabbit and BROWN and WIESEL'S data (1958) show that with the onset of a one second stimulus maintained discharges are first completely inhibited and this is followed by a decrease in the inhibition while the light is still on. This pattern of inhibition and recovery is repeated when the light is turned off. GRANIT'S work (1962) abounds with evidence of complex patterns of excitation and inhibition that vary with the adaptive state. He has shown that with changes from dark to light adaptation there are different rates of spontaneous activity and that there are different functions relating on- and off-discharges to light intensity. Studies of receptive fields—a concept first put forth on the basis of psychophysical data, by the way (HERING, 1964)—have revealed changes in organization as adaptation is changed. Whereas concentric increases in area show spatial summation in ganglion cells of the dark adapted cat, an increase in area in the light adapted con- dition adds zones of opposite polarity and the central spatial summation is neutralized by the effects from adjacent areas (BARLOW et al> 1957).
The consequences for changes in sensitivity or responsiveness in such an area are obvious.
What about the incremental (and décrémentai) activity component of the dual process ? We know of no evidence at the photochemical level that pertains to interactive, algebraically additive, incremental effects. At the level of the neural impulse, however, spatial and tem- poral interactions have been produced and analysed in the simple eye of the Limulus by HARTLINE and RATCLIFF (1958) and the inhibitory effects are treated quantitatively as decrements of frequencies of impulses. Firing rates in one receptor unit can be decreased by amounts proportional to rates of firing in neighbouring units and the interaction is reciprocal and recurrent. Disinhibition of inhibition is also elegantly demonstrated.
Of particular interest are the incremental and décrémentai mag- nitude shifts in the graded ' S * potentials produced by adapting the eyes of fish to background illuminations of different colours. T h e adaptation light produces a fixed upward or downward shift in the resting potential which, of course, affects the response amplitude to the test stimuli ( M A C N I C H O L and SVAETICHIN, 1958; TOMITA, 1963).
H O V I S U A L P R O C E S S E S I N M A N A N D A N I M A L S
If we take a so-called R - G type of ' S ' potential, for example, where the long wavelength response is positive (R component) and the response to short wavelength is negative (G component), adaptation to short wavelength light makes the baseline level more negative and the G component smaller, the R component larger. A long wavelength adapting light on the same unit produces exactly the opposite effect.
The baseline level becomes more positive and the G component increases by an amount by which the base level has shifted while the R component is decreased to the same extent.
Wavelength specific on- and off-discharges and their organization in receptive fields have been studied by WAGNER, MACNICHOL and WOLBARSHT (i960; 1963) in the goldfish. In exploring the effects of coloured adapting lights they have shown that one or the other of the two opposite responses can be emphasized within such a field by exposure to chromatic backgrounds. Thus, for example, a receptive field that shows only inhibition of spontaneous activity and off- responses without any pre-exposure, may yield on-responses to short wave light after pre-exposure to a long wavelength background stimulus. They have further demonstrated that the threshold increase caused by a localized adapting light is the same for all regions of the receptive field and is not greater in the immediate vicinity of the adapting stimulus (WOLBARSHT, 1964). The sensitivity change is unlike the Limulus interaction effect and is clearly not what one would expect if the change were being controlled by bleaching activities in the individual receptor units.
Selective enhancement of wavelength dependent responses by the introduction of chromatic backgrounds or pre-exposure stimuli have also been recorded in the monkey at the level of the lateral geniculate by DEVALOIS and his co-workers (i960). They have demonstrated temporal interactions which are essentially of a successive colour contrast type by following stimulation from one part of the spectrum with light from another part. In a cell which responds differentially with on- and off-signals to 650 nm and 500 nm respectively, so that there is an increase over the spontaneous rate with 650 nm and a decrease in firing rate with 500 nm, by following 500 nm stimulation with 650 nm stimulation, the on-response to 650 nm combines with the off-discharge to 500 nm to yield a response that is effectively summed.
We should like, of course, to trace the course of excitation and the regulating mechanisms through their entire chain but we cannot
I N T R O D U C T O R Y L E C T U R E I I I
compare the magnitudes of the effects measured at different neural levels when experiments have been done on different species. JUNG (1961) and the FREIBURG group do have data for the cat at different levels, although not for wavelength specific effects. Using the same grid patterns of black and white stripes, they report antagonistic on- and off-neural responses from the ganglion cells, the lateral geniculate and visual cortex. The responses are essentially the same at the dif- ferent levels but both activation frequencies and the size of the on-field centres are smaller in the cortex than they are at lower levels. This is related by them to a progressive sharpening of the contrast effects as the information moves from the lower centres toward the higher ones.
'. . . fundamentally, the retina can do what cortex and L G N do. The difference is one of emphasis rather than of principle ' (GRANIT, 1962).
Where do we stand? We see that the multiplicative sensitivity changes incorporated in our formal treatment of colour adaptation may find their expression in photochemical bleaching although the photo- chemical picture seems to us to be both over-exposed and under- developed and the latent image is not yet clearly in focus. Sensitivity changes are also regulated by modifications in neural responsiveness.
Evidence for incremental (and décrémentai) effects that are in addition required to account for the data is clear cut but only at the neural level.
At the neural level, however, physiological interactions seem to occur redundantly and cumulatively at all stages of the visual system.
We should like to say that we are not unaware of a variety of recent developments that are attracting the interest of a number of investi- gators. The physical structures revealed by electromicroscopy and the graded potentials of reversible polarity have, for one thing, engendered considerable interest in photocurrents and their possible role in the visual process. Solid-state analysis has been applied to the action of the retinal rods (HARTE, 1961), and experiments carried out on jS-carotene as a semiconductor (NELSON, 1957; ROSENBERG, 1962) There are also researchers who are investigating retinal receptors as wave guides (ENOCH, 1964) and the cone outer segments as inter- ference filters (INGELSTAM, 1956). These developments represent radical departures from our older ideas about the mechanism of selective photoreception, nevertheless, they do not alter the require- ments placed by the measured psychophysical data of adaptation upon theories of overall behaviour of the photoreceptor-neutral system.
1 1 2 V I S U A L P R O C E S S E S I N M A N A N D A N I M A L S
We would hope that the substance of this paper will have made it clear that the photochemist, solid-state physicist or neurophysiologist can no longer expect that psychophysical colour adaptation experi- ments with an intact organism can reflect in any simple way the specific characteristics of that one aspect of the mechanism in which he is particularly interested.
R E F E R E N C E S
BARLOW H . B . , FITZHUGH R. and KUFFLER S.W. (1957) J. Physiol. 1 3 7 ,
327.
BAUMGARDT E . (1950) Rev. opt. theor. instrum. 2 8 , 661.
BREWER W.L. (1954) J . opt. Soc. Amer. 4 4 , 207.
BRINDLEY G.S. (i960) Physiology of the Retina and the Visual Pathway, Arnold.
BROWN K . T . and WIESEL T . N . (1958) Amer, y. Ophthal. 4 6 , 91.
BROWN P.K. and WALD G. (1964) Science 1 4 4 , 45.
BURNHAM R.W., EVANS R.M. and NEWHALL S.M. (1957) J. opt. Soc. Amer.
4 7 , 35·
CROZIER W J . (1935) Déterminisme et Variabilité, Hermann.
DARTNALL H.J.A. (i960) In Mechanisms of Colour Discrimination (Y.Galifret, ed.), pp. 147-61, Pergamon Press.
DARTNALL H J . A . (1962). In The Eye (H.Davson, ed.), Vol. II, pp. 323-533, Academic Press.
DEVALOIS R.L. (i960) J. gen. Physiol. 4 3 (Suppl.), 115.
DODT E . (1956) Acta, physiol. Scand. 3 6 , 219.
DODT E . (1961) In The Visual System: Neurophysiology and Psychophysics (RJung and H.Kornhuber, eds.) pp. 64-74, Springer.
ENOCH J.M. (1964) Psychol. Bull. 6 1 , 242.
GRANIT R. (1962) In The Eye (H.Davson, ed.) Vol. II, pp. 537-763, Academic Press.
GRANIT R., MUNSTERHJELM A. and ZEWI M. (1939)y. Physiol. 9 6 , 31.
HANAOKA T . and FUJIMOTO K. (1957)yap. y. Physiol. 7 , 276.
HARTE R.A. (1961)^. opt. Soc. Amer. 5 1 , 1275.
HARTLINE H.K. and RATCLIFF F . (1958)y. gen. Physiol. 4 1 , 1049.
HECHT S. (1934). In Handbook of General Experimental Psychology (C.Mur- chison, ed.), pp. 704-828, Clark University Press.
HERING E . (1964) Outlines of a Theory of the Light Sense (Trans. L.M.Hurvich and DJameson), Harvard University Press.
HUBEL D. (1963)^. opt. Soc. Amer. 5 3 , 58.
HURVICH L. M . and JAMESON D. (19513)^. opt. Soc. Amer. 4 1 , 521.
HURVICH L.M. and JAMESON D. (1951b)y. opt. Soc. Amer. 4 1 , 787.
HURVICH L.M. and JAMESON D. (1951c) Science 1 1 4 , 199.
HURVICH L.M. and JAMESON D. (1954)^. opt. Soc. Amer. 4 4 , 213.
HURVICH L.M. and JAMESON D. (1958) In Visual Problems of Colour, Vol. II, pp. 691-723, Her Majesty's Stationery Office.
HURVICH L.M. and JAMESON D. (1960)^. gen. Physiol. 4 3 (Suppl.), 63.
I N T R O D U C T O R Y L E C T U R E U S
HURVICH L . M . and JAMESON D . (1961). In The Visual System: Neurophysio- logy and Psychophysics (R.Jung and H.Kornhuber, eds.), pp. 144-52, Springer.
HURVICH L . M . , JAMESON D . and KRANTZ D. H . (1964) In Handbook of Mathematical Psychology (R.D.Luce, R.R.Bush and E.Galanter, eds.), Vol. I l l , Wiley.
INGELSTAM E. (1956) In Problems of Contemporary Optics, pp. 640-68, Istituto Nazional di Ottica.
JAMESON D . and HURVICH L.M. (195 ia)^. opt. Soc. Amer. 4 1 , 528.
JAMESON D . and HURVICH L.M. (1951b) J. exp. Psychol. 4 1 , 455.
JAMESON D . and HURVICH L.M. (1953) J. opt. Soc. Amer. 4 3 , 552.
JAMESON D . and HURVICH L.M. (1959) J. opt. Soc. Amer. 4 9 , 890.
JAMESON D . and HURVICH L.M. (1962) J. opt. Soc. Amer. 5 2 , 1326.
JAMESON D . and HURVICH L.M. (1964) Vision Res. 4 , 135.
JUNG R. (1961) In The Visual System: Neurophysiology and Psychophysics (R.Jung and H.Kornhuber, eds.) pp. 410-34, Springer.
LAND E.H. (1959) Proc. nat. Acad. Sei. Wash. 4 5 , 115.
LAND E.H. (1964) Amer. Sei. 5 2 , 247.
MACADAM D. L . (1956)^. opt. Soc. Amer. 4 6 , 500.
MCCONNELL D. G . (1964) Psychol. Bull. 6 1 , 252.
MACNICHOL E.F. and SVAETICHIN G. (1958) Amer.jf. Ophthal. 4 6 , 26.
MARKS W.B., MACNICHOL E . F . Jr. and DOBELLE W.H. (1964) Science, 1 4 3 , 1181.
MORTON R.A. and PITT G.AJ. (1957) Progr. Chem. Org. Nat. Prods. 1 4 , 244.
MÜLLER-LIMMROTH H.W. (1956) Naturwissenschaften 1 5 , 337; 1 6 , 364.
NELSON R . C . (1957) J. Chem. Phys. 2 7 , 864.
NOELL W.K. (1963)^. opt. Soc. Amer. 5 3 , 36.
RATCLIFF F . , HARTLINE H.K. and MILLER W.H. (1963)^. opt. Soc. Amer.
5 3 , n o .
RIPPS H. and WEALE R.A. (1964) J . opt. Soc. Amer. 5 4 , 272.
ROSENBERG B. (1962)^. Photochem. photobiol. 1 , 117.
RUSHTON W.A.H. (1958) In Visual Problems of Colour, Vol. I, pp. 71-101, Her Majesty's Stationery Office.
RUSHTON W.A.H. (1962) Set. Amer. 2 0 7 , 120.
RUSHTON W.A.H. (1963)^. Physiol. 1 6 8 , 360.
STILES W.S. (1953) Coloquio Sobre Problemas Opticos de la Vision, I, pp.
65-103, Conferencias Générales Madrid Union International de Physique Pure et Appliquée.
SVAETICHIN G., KRATTENMACHER W. and LAUFER M. (i960) J . gen. Physiol.
4 3 (Suppl.) 101.
SVAETICHIN G., LAUFER M., MITARAI G., FATEHCHAND R . , VALLECALLE E .
and VILLEGAS J. (1961) In The Visual System: Neurophysiology and Psychophysics (R.Jung and H.Kornhuber, eds.) pp. 445-6, Springer.
TALBOT S.A. ( i 9 5 i a) J . opt. Soc. Amer. 4 1 , 895.
TALBOT S.A. (1951b) J. opt. Soc. Amer. 4 1 , 918.
TOMITA T . (1963) J. opt. Soc. Amer. 5 3 , 49.
VON KRIES J. ( I 905). In Handbuch der Physiologie des Menschen (W.Nagel, ed.), pp. 109-282, Vieweg.
8
114 V I S U A L P R O C E S S E S I N M A N A N D A N I M A L S
WAGNER H . G , , MACNICHOL E . F . Jr. and WOLBARSHT M. L . (i960) J. gen.
Physiol. 4 3 (Suppl.), 45.
WAGNER H . G . , MACNICHOL E . F . Jr. and WOLBARSHT M. L . (1963) J . opt.
Soc. Amer. 5 3 , 66.
WALD G . , BROWN P . K . and GIBBONS LR. (1963) J. opt. Soc. Amer. 5 3 , 20.
WOLBARSHT M. (1964) May 13. Oral report. Renshaw Vision Conference Ohio State University Institute for Research in Vision.
WOLKEN J.J. (1962) Invest. Ophthal. 1 , 327.