COMPARATIVE ANALYSIS OF THE RELATIONSHIP BETWEEN PHENOLOGICAL PHENOMENA AND METEOROLOGICAL INDICATORS BASED ON INSECT AND PLANT MONITORING
FERENCZY,A.1*–EPPICH,B.–VARGA,R.D.–BÍRÓ,I.–KOVÁCS,A.–PETRÁNYI,G.1– HIRKA,A.2–SZABÓKI,CS.2–ISÉPY,I.3–PRISZTER,SZ.3–TÜREI,D.4 –GIMESI,L.5–
GARAMVÖLGYI Á.1–HOMORÓDI,R.4–HUFNAGEL,L.6
1Department of Mathematics and Informatics, Corvinus University of Budapest, Faculty of Horticulture
H-1118 Budapest, Villányi út 29-43., Hungary
2Forest Research Institute, Department of Forest Protection H-3232 Mátrafüred, Hegyalja út 18., Hungary
3Botanical Garden, Eötvös Loránd University, Faculty of Science H-1083 Budapest, Illés utca 25., Hungary
4ALÖKI Applied Ecological Research and Forensic Institute Ltd.
H-1185 Budapest, Kassa utca 118.
5Department of Informatics, University of Pécs, Faculty of Sciences H-7624 Pécs, Ifjúság út 6.
6“Adaptation to Climate Change” Research Group, Hungarian Academy of Sciences H-1118 Budapest, Villányi út 29-43., Hungary
*Corresponding author e-mail: antalferenczy@gmail.com
(Received 13rd November 2010 ; accepted 19th November 2010)
Abstract. Climate change is one of the biggest environmental problems of the 21st century. The most sensitive indicators of the effects of the climatic changes are phenological processes of the biota. The effects of climate change which were observed the earliest are the remarkable changes in the phenology (i.e. the timing of the phenophases) of the plants and animals, which have been systematically monitored later. In our research we searched for the answer: which meteorological factors show the strongest statistical relationships with phenological phenomena based on some chosen plant and insect species (in case of which large phenological databases are available). Our study was based on two large databases:
one of them is the Lepidoptera database of the Hungarian Plant Protection and Forestry Light Trap Network, the other one is the Geophytes Phenology Database of the Botanical Garden of Eötvös Loránd University. In the case of butterflies, statistically defined phenological dates were determined based on the daily collection data, while in the case of plants, observation data on blooming were available. The same meteorological indicators were applied for both groups in our study. On the basis of the data series, analyses of correlation were carried out and a new indicator, the so-called G index was introduced, summing up the number of correlations which were found to be significant on the different levels of significance. In our present study we compare the significant meteorological factors and analyse the differences based on the correlation data on plants and butterflies. Data on butterflies are much more varied regarding the effectiveness of the meteorological factors.
Keywords: climate change, phenophases, meteorology, correlation, Lepidoptera
Introduction
Range and spatial and temporal pattern of the species making up the biosphere has been continuously changing since life began on Earth. The most important pattern generating factor of this global change is weather and its seasonal changes. Earlier, the change of the biota in geological scale could be considered to be a natural process, however, in the ecological and climatological changes of the last some thousand years the effects related to human activity are more and more significant. Direct and indirect effects of the climate change on terrestrial and marine ecosystems could already be observed in the last decades – on the level of individuals, populations, species, biomes and the global biosphere as well. Climate change is one of the most important ecological problems of this century (IPCC, 2007). It is of great significance because it affects the living conditions of the whole global society (Harnos et al., 2008) so it determines its sustainability as well. The changeability of the climate, that is the lack of climatic stability (and its degree) in longer periods, is determinant for the state and change of state of all earthly ecosystems (Hufnagel and Gaál, 2005; Őszi et al., 2006;
Ladányi and Hufnagel, 2006; Szenteleki et al., 2007; Erdélyi, 2008; Gaál, 2008;
Ladányi, 2008). The different natural and human-influenced ecosystems show heterogeneity regarding their sensitivity to the effect (Sipkay et al., 2007, 2008;
Hufnagel et al., 2008). Ecosystems as systems capable of regulation do not only endure effects passively but they react to those with adaptation of different degree and type, feedback and regulation (Drégelyi-Kiss, 2008).
The effect of climate change which was observed the earliest and has been systematically monitored later as well is the remarkable changes in the phenology (i.e.
the timing of the phenophases) of the plants and animals. Despite the fact that not enough is known about which environmental factors induce the beginning of the phenophases and affect the reproduction cycles in case of individual species, it is known, that not only the changing weather (due to the higher CO2 concentration) but the CO2 level itself can significantly affect e.g. the blooming of some plants (Houghton, 1995). Several biologists have already studied the phenological changes all over Europe, and it was observed that certain species started budding 5-6 days earlier than usual, while e.g. autumn colouring started 4-8 days later (Menzel, 1999). Abu-Asab and his colleagues (2001) studied the changes in the beginning of blooming over 21 years (between 1970 and 1990) and their results show that the majority of the trees (regarding 100 species from 44 angiosperm families) started blooming 3-5 days earlier at the end of the period than at its beginning. Earlier beginning of blooming is also proven by the research results of Primack and his colleagues (2007), according to which rise in the mean temperature by 1 °C between February and May results in blooming approximately 4 days earlier in Massachusetts (USA), so plants bloom nowadays 11 days earlier on average than a century before. However, researches by Sherry et al.
(2007) show that only those species start blooming earlier which bloom before the summer heat, the blooming of the other ones is definitely delayed. In the American tall grass prairies early species bloom 7.6 days earlier on average and late species 4.7 days later, so in the middle there is a gap in the seasonality of the community’s blooming dynamics. It can be seen from the above that out of the basic ecological phenomena, climate change modifies the seasonal community dynamics and one of its important factors: the phenology of species, the most significantly (Schwartz, 2003; Vadadi et al., 2008).
In our present study, which is based on the development of our researches last year (Eppich et al., 2009), we wanted to examine the connection between weather conditions and phenology and compare our studies on geophytes with data on insect phenology.
In our research we set three main goals again:
1. To explore based on some suitably chosen years which role frequency distributions of the meteorological parameters of the given period play regarding the phenological patterns.
2. To survey with the help of correlation analyses, which meteorological parameters have what kind of influence on the phenological behaviour of the individual indicator plants and insect species.
3. To compare the effects observed in the case of plants and insects and find out whether they show similar phenomena (i.e. whether synchronicity can be assumed in their changes) or there are differences, which can show the breaking up and reorganisation of the ecological relationships on community level.
Materials and methods
For our case study we used historical weather data series from the Hungarian Meteorological Service, Szaniszló Priszter’s observations on the phenology of geophytes as well as the data on Lepidoptera from the Hungarian Plant Protection and Forestry Light Trap Network.
Meteorological data
The Hungarian Meteorological Service has published the daily data of Budapest of a 100-year period, among which you can find the daily mean temperature, the daily maximum and minimum temperature, the amount and type of daily precipitation and the daily sunshine duration. In order to complete these, radiation values were also calculated (according to Gábor Szász, 1968).
Phenological database on geophytes
Szaniszló Priszter, the former director of the Botanical Garden of the Eötvös Loránd University had been observing and recording the beginning of three characteristical phenophases of about 200 plant species, mainly geophytes for approximately 40 years during the last decades of the twentieth century (Priszter, 1960 – 2000; Priszter, 1974;
Isépy and Priszter 1972; Priszter and Isépy, 1974). Priszter’s data were substituted for day serial numbers in the individual years. These data describe on which days the observed geophytes budded, bloomed and withered. Our database was constructed from these data and it contains Latin names of the species and day serial numbers of the three phenological events for each examined year.
Hungarian Plant Protection and Forestry Light Trap Network
On the initiative of Tibor Jermy, member of the Hungarian Academy of Sciences, the organizing of the Hungarian light trap network began in 1952, on plant protection stations, in agricultural institutions and forestries. The Hungarian light trap network is equipped uniformly with Jermy-type light traps. Several light traps are operating
covering the whole country, from which samples are collected by daily emptying. This way we possess daily flight data of several decades on hundreds of insect species.
However, the data series of the light trap network are burdened by numerous errors, missing data, and the filtering, correction and homogenization of these is a serious biomathematical problem. All things considered, the database of the light trap network provides a unique opportunity for the phenological researches on Lepidoptera (Nowinszky, 2003). For the present study we prepared homogenized, interpolated daily values after error filtering, adjusted by a space-time window, from the united data series of suitably selected light traps. As phenological event we selected the day of the data series obtained this way on which the cumulated sum of the frequency data first exceeds 50% of the annual sum.
Used meteorological indicators and their evaluation
The meteorological indicators have been calculated from the end of August in the previous year (from the 240th Julianus day of the year) till the beginning of the phenological event.
The following derived meteorological parameters have been calculated:
1. average of daily global radiation (J/m2), 2. average of daily mean temperature, 3. average of daily maximum temperature, 4. average of daily minimum temperature, 5. precipitation amount,
6. sunshine duration,
7. daily average of sunshine duration,
8. number of days with precipitation (including trace of precipitation), 9. number of days with real precipitation (excluding trace of precipitation), 10. sum of mean temperature > 10 C,
11. sum of mean temperature > 9 C, 12. sum of mean temperature > 8 C, 13. sum of mean temperature > 7 C, 14. sum of mean temperature > 6 C, 15. sum of mean temperature > 5 C, 16. sum of mean temperature > 4 C, 17. sum of mean temperature > 3 C, 18. sum of mean temperature > 2 C, 19. sum of mean temperature > 1 C, 20. sum of mean temperature > 0 C,
21. average of daily temperature fluctuation (maximum-minimum), 22. relative deviation of precipitation for days with precipitation, 23. number of frost days,
24. sum of nonnegative daily mean temperature after the last frost day till the day of the phenological change.
Using these meteorological indicators, analyses of correlation have been carried out on the phenophases in our geophytes’ phenology database and the light trap data series on Lepidoptera for each year of examination. For our work the statistical software package PAST (Hammer et al., 2001) has also been used (Dede et al., 2009).
To describe the significance of each meteorological indicator the G index was introduced. In its numerator the number of the correlations which are significant at 5%
significance level is summed up with double weight, while the number of the correlations which are significant at only 10% significance level is simply summed up, and in the denominator there is twice the total number of the studied species (maximum correlation).
From the meteorological data series the yearly frequencies of each characteristical meteorological indicator were also calculated for the periods lasting from the end of August in the previous year till the end of August in the current year, and their distributions were plotted in order to find out the degree of the variability between the years.
Results and discussion
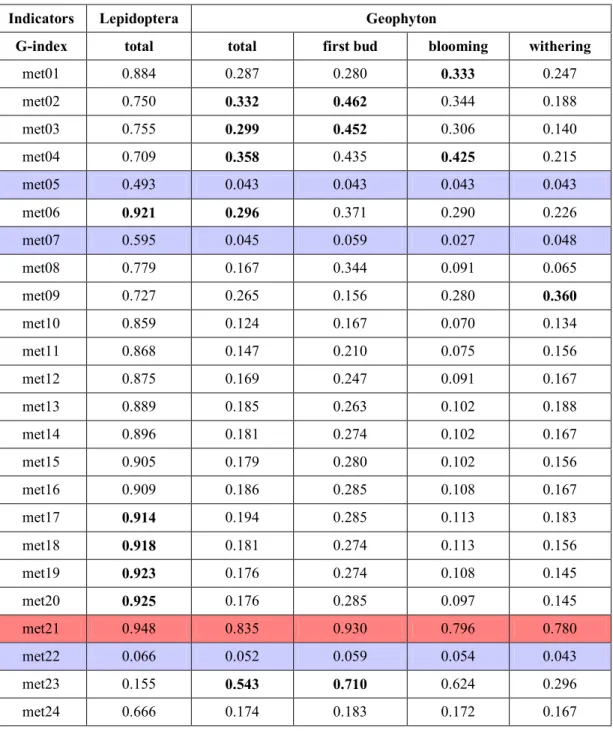
The phenological role of the various meteorological parameters we analyzed and their importance are expressed by the G index. It was calculated for both the geophyte and the Lepidoptera databases (Table 1).
Based on these data it can be stated that Lepidoptera data show significantly higher correlations on average with meteorological parameters than phenological data of the geophytes do. This is not surprising because Lepidoptera, attracted by light, are much more exposed to the effects of climate and vegetation than geophytes, which possess significant nutrient reserves and accumulated water. At the same time it is an extremely interesting and consistent result that the most important factor regarding both Lepidoptera and plants proved to be No. 21: the average of daily temperature fluctuation. This is surprising because models used in phenology generally yield good results rather with parameters related to heat summation or mean temperature.
Parameter No. 6, the sum of sunshine duration is also important for both groups. It can be also stated that parameters No. 5, 7 and 22, namely precipitation amount, daily average of sunshine duration and relative deviation of precipitation do not play an important role either in the case of Lepidoptera or in the case of plants. The ineffectiveness of the variables describing precipitation conditions is not surprising because it is a characteristic of bulbous plants that they are capable of tolerating the lack of precipitation due to their storage organs so they are not affected by precipitation conditions as much. However, the average of sunshine duration and the average of temperatures above 10 C do not seem to be effective in case of our plants. This can be surprising because sunshine and heat usually prove to be important factors when examining phenological phenomena.
A striking difference can be seen concerning indicator No. 23 (number of frost days) because it is very important in the case of geophytes but in the case of Lepidoptera it seems to play almost the least significant role. It is easy to understand that frost has a significant effect on geophytes, while in the case of flying insects it is not really important in itself.
Examining 93 geophytes in our earlier studies (Eppich et al., 2009 a, b) it was recognizable that the effect of several factors differs per phenophase. Apart from the above the appearance of the first buds can also be affected by the average daily maximum temperature (met3) and the average daily mean temperature (met2), which is reasonable since this is obviously in connection with spring warming. However, the date of blooming is rather affected by the average daily minimum temperature (met4)
and global radiation (met1). This can be caused by the fact that the blooming of already developed buds can be limited by low temperature at night or early in the morning. The withering date of flowers, however, is often influenced by a factor that almost never has an effect on the previous two phenophases. This is the number of days with real precipitation (met9), the importance of which seems to precede even that of the number of frost days (met23) in this case. This latter observation is also easy to understand because in case of withering, temperature conditions are less dominant than precipitation conditions.
Table 1. G indices of meteorological indicators in the correlation analyses of Lepidoptera and geophytes. G indices above 50% are highlighted in bold, the 6 largest G indices per group are underlined
Indicators Lepidoptera Geophyton
G-index total total first bud blooming withering
met01 0.884 0.287 0.280 0.333 0.247
met02 0.750 0.332 0.462 0.344 0.188
met03 0.755 0.299 0.452 0.306 0.140
met04 0.709 0.358 0.435 0.425 0.215
met05 0.493 0.043 0.043 0.043 0.043
met06 0.921 0.296 0.371 0.290 0.226
met07 0.595 0.045 0.059 0.027 0.048
met08 0.779 0.167 0.344 0.091 0.065
met09 0.727 0.265 0.156 0.280 0.360
met10 0.859 0.124 0.167 0.070 0.134
met11 0.868 0.147 0.210 0.075 0.156
met12 0.875 0.169 0.247 0.091 0.167
met13 0.889 0.185 0.263 0.102 0.188
met14 0.896 0.181 0.274 0.102 0.167
met15 0.905 0.179 0.280 0.102 0.156
met16 0.909 0.186 0.285 0.108 0.167
met17 0.914 0.194 0.285 0.113 0.183
met18 0.918 0.181 0.274 0.113 0.156
met19 0.923 0.176 0.274 0.108 0.145
met20 0.925 0.176 0.285 0.097 0.145
met21 0.948 0.835 0.930 0.796 0.780
met22 0.066 0.052 0.059 0.054 0.043
met23 0.155 0.543 0.710 0.624 0.296
met24 0.666 0.174 0.183 0.172 0.167
Thus the six most important factors in case of our plants are indicators No. 2, 3, 4, 6, 21 and 23, while in case of Lepidoptera these are indicators No. 6, 17, 18, 19, 20 and 21. Accordingly, apart from the daily temperature fluctuation and sunshine duration the average daily mean, maximum and minimum temperatures are dominant in case of plants, while in case of Lepidoptera instead of these latter ones rather the sum of mean temperatures above 1, 2 and 3 °C are significant. In case of our plants 3 °C proved to be the most adequate threshold value for heat summation, in case of Lepidoptera it was 0°C. However, it can be seen that daily temperature fluctuation is more important in all cases than the approaches to heat summation.
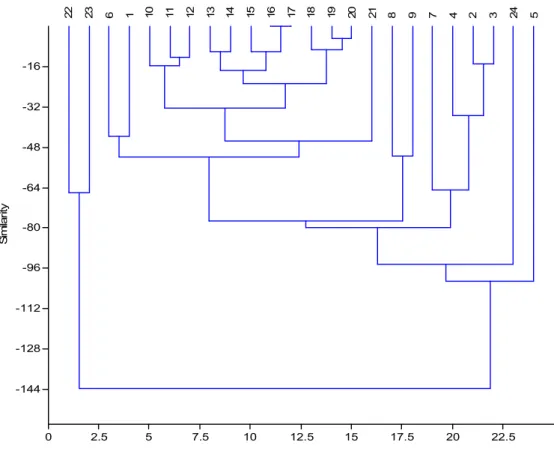
In case of Lepidoptera we classified the meteorological parameters according to their correlations with the species. The result can be seen on Figure 1.
0 2.5 5 7.5 10 12.5 15 17.5 20 22.5
-144 -128 -112 -96 -80 -64 -48 -32 -16
Similarity 22 23 6 1 10 11 12 13 14 15 16 17 18 19 20 21 8 9 7 4 2 3 24 5
Figure 1. The classification of meteorological parameters according to their correlations with Lepidoptera species (HC, paired group algorithm, Euclidean distance)
It can be observed that there are numerous Lepidoptera species that correlate well with almost all parameters and a smaller group with nearly none of them. At the same time there is a well definable group of Lepidoptera for which rather parameters No. 1, 2, 3, 4, 6, 8, 9, 21, 23 are important, while for another circle instead of these parameters No. 13, 14, 15, 16, 17, 18, 19, 20, 21 are important. These correlation patterns require further analyses.
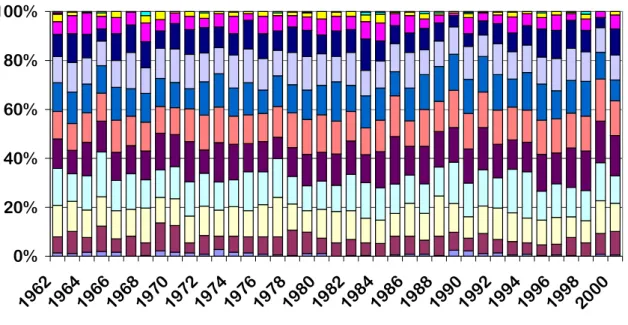
Since daily temperature fluctuations seemed to be the most important parameters, we considered it worthwhile examining their annual frequency distribution more thoroughly (Figure 2).
0%
20%
40%
60%
80%
100%
196 2
1964
196619681970
1972197 4
1976
197819801982
198419861988
199019921994 1996
19982000
1.5 3.0 4.5 6.0 7.5 9.0 10.5 12.0 13.5 15.0 16.5 18.0 19.5
Figure 2. Frequency distributions of values of daily temperature fluctuation in the years of examination
Based on Figure 2 it can be stated that no obvious tendencies can be observed regarding this factor during the examination period, however, it is noticeable that in the second half of the examination period there are several years with greater fluctuations.
Examining other factors this phenomenon was not remarkable, which draws attention to the fact that greater attention should be paid to the question of daily temperature fluctuation in climate change researches.
Acknowledgements. Our research was supported by the research proposal OTKA TS 049875 (Hungarian Scientific Research Fund); the VAHAVA project; the KLIMA-KKT project (National Office for Research and Technology, Ányos Jedlik Programme); the Adaptation to Climate Change Research Group (Hungarian Academy of Sciences, Office for Subsidised Research Units); the Research Assistant Fellowship Support (Corvinus University of Budapest); the “Bolyai János” Research Fellowship (Hungarian Academy of Sciences, Council of Doctors) and the TÁMOP project 4.2.1/B-09/1/KMR/- 2010-0005 (Social Renewal Operational Programme).
REFERENCES
[1] Abu-Asab, M., Peterson, S., Stanwyn, P.M., Shelter, G. and Sylvia, S. (2001):
Biodiversity Conservation, 597-612.
[2] Dede, L., Eppich, B., Ferenczy, A., Horváth, L., Hufnagel, L., Isépy, I. (2009): Történeti időjárási adatbázis alkalmazási lehetőségei. – In: Summer University on Information Technology in Agriculture and Rural Development, Debrecen, Hungary, 26-27 August 2009 Proceedings (CD).
[3] Drégelyi-Kiss, Á., Drégelyi-Kiss, G., Hufnagel, L. (2008): Ecosystems as climate controllers – biotic feedbacks (a review). – Applied Ecology and Environmental Research 6(2): 111-135.
[4] Eppich, B., Dede, L., Ferenczy, A., Garamvölgyi, Á., Horváth, L., Isépy, I., Priszter Sz., Hufnagel, L. (2009): Climatic effects on the phenology of geophytes. – Applied Ecology and Environmental Research 7(3): 253-266.
[5] Eppich, B., Dede, L., Ferenczy, A., Horváth, L., Isépy, I., Hufnagel, L. (2009): Időjárás hatása hagymás és gumós növények fenológiájára. – LI. Georgikon Napok 197-206.
[6] Erdélyi, É. (2008): Az őszi búza termeszthetőségi feltételei az éghajlatváltozás függvényében. Doktori (PhD) értekezés. – Budapesti Corvinus Egyetem, Kertészetttudományi Kar, Matematika és Informatika Tanszék, Budapest.
[7] Gaál, M. (2008): Expected changes in climatic conditions of main crops. – Klíma-21 55:
28-35.
[8] Hammer, Ř., Harper, D.A.T., Ryan, P.D. (2001): PAST: Paleontological Statistics Software Package for Education and Data Analysis. – Palaeontologia Electronica 4(1): 9.
http://palaeo-electronica.org/2001_1/past/issue1_01.htm.
[9] Harnos, Zs., Gaál, M., Hufnagel, L. (szerk.) (2008): Klímaváltozásról mindenkinek. – Budapesti Corvinus Egyetem, Budapest.
[10] Houghton, J., Meria, T., Fitho, L., Callender, G.B., Harris, N. (1995): The Science of Climate Change. – Cambridge University Press, Cambridge, UK.
[11] Hufnagel, L., Gaál, M. (2005): Seasonal dynamic pattern analysis in service of climate change research. – Applied Ecology and Environmental Research 3(1): 79-132.
[12] Hufnagel, L., Sipkay, Cs., Drégelyi-Kiss, Á., Farkas, E., Türei, D., Gergócs, V., Petrányi, G., Baksa, A., Gimesi, L., Eppich, B., Dede, L., Horváth, L. (2008): Klímaváltozás, biodiverzitás és közösségökológiai folyamatok kölcsönhatásai. – In: Harnos, Zs., Csete, L. (szerk): Klímaváltozás: Környezet – Kockázat – Társadalom, Szaktudás Kiadó Ház, Budapest.
[13] IPCC (2007): Climate Change 2007: Synthesis Report. Contribution of Working Group I, II and II to the Fourth Assessment Report of the Intergovernmental Panel of Climate Change. – IPCC, Geneva, Switzerland.
[14] Isépy, I., Priszter, Sz. (1972): Chorologische und phänologische Untersuchungen an mediterranen Geophyten. I. Narcissus. – Annal. Univ. Sci. Budapest, Sect. Biol. 14: 105- 117.
[15] Ladányi, M. (2008): Viticulture challenges under changing climate in Hungary. – Klíma- 21 55: 36-52.
[16] Ladányi, M., Hufnagel, L. (2006): The effect of climate change on the population of sycamore lace bug (Corythuca ciliata, SAY, Tingidae Heteroptera) based on a simulation model with phenological response. – Applied Ecology and Environmental Research 4(2):
85-112.
[17] Menzel, A., Fabian, P. (1999): Nature.
[18] Nowinszky, L. (2003): A fénycsapdázás kézikönyve. – Savaria University Press, Szombathely.
[19] Őszi, B., Ladányi, M., Hufnagel, L. (2006): Population dynamics of the Sycamore Lace Bug, Corythuca ciliata (Say) (Heteroptera: Tingidae) in Hungary. – Applied Ecology and Environmental Research 4(1): 135-150.
[20] Primack, R.B., Miller-Rushing, A.J., Primack, D., Mukunda, S. (2007): Using Photographs to Show the Effects of Climate Change on Flowering Times. – Arnoldia 65:
3-9.
[21] Priszter, Sz. (1960-2000): Fenológiai adatbázis (manuscript).
[22] Priszter, Sz. (1974): Hagymás kerti virágok. – Mezőgazdasági Kiadó, Budapest.
[23] Priszter, Sz., Isépy, I. (1974): Chorologische und phänologische Untersuchungen an mediterranen Geophyten. II. Galanthus. – Annal. Univ. Sci. Budapest, Sect. Biol. 16: 87- 101.
[24] Schwartz, M.D. (ed.) (2003): Phenology: An Integrative Environmental Science. – Kluwer Academic Publishers, Dordrecht/Boston/London.
[25] Sherry, R.A., Zhou, X., Gu, S. (2007): Divergence of reproductive phenology under climate warming. – PNAS 104(1): 198-202.
[26] Sipkay, Cs., Drégelyi-Kiss, Á., Horváth, L., Garamvölgyi, Á., Kiss, K.T., Hufnagel, L.
(2010): Community ecological effects of climate change. – In: Climate Change and Variability, SCIYO.
[27] Sipkay, Cs., Horváth, L., Nosek, J., Oertel, N., Vadadi-Fülöp, Cs., Farkas, E., Drégelyi- Kiss, Á., Hufnagel, L. (2008): Analysis of climate change scenarios based on modelling of the seasonal dynamics of a Danubian copepod species. – Applied Ecology and Environmental Research 6(4): 101-108.
[28] Sipkay, Cs., Hufnagel, L., Révész, A., Petrányi, G. (2007): Seasonal dynamics of an aquatic macroinvertebrate assembly (Hydrobiological case study of Lake Balaton No. 2).
– Applied Ecology and Environmental Research 5(2):63-78.
[29] Szász, G. (1968): A globálsugárzás összegeinek meghatározása számítás útján. – Debreceni Agrártudományi Főiskola Tudományos Közleményei XIV: 239-253.
[30] Szenteleki, K., Ladányi, M., Szabó, É., Horváth, L., Hufnagel, L., Révész, A. (2007): A climate research database management software EFITA/WCCA, 2–5 July 2007, Glasgow, Scotland, Paper CD ROM.
[31] Vadadi-Fülöp, Cs., Hufnagel, L., Sipkay, Cs., Verasztó, Cs. (2008): Evaluation of climate change scenarios based on aquatic food web modelling. – Applied Ecology and Environmental Research 6(1): 1-28.
Electronic information source
Hungarian Meteorological Service: daily meteorological data of Budapest in the 20th century on the home page of the Hungarian Meteorological Service
http://met.hu/pages/climate/bp/Navig/Index2.htm