https://doi.org/10.14232/acta.clim.2020.54.1
ADAPTATION OF UFORE-HYDRO MODEL FOR SZEGED AND THE SOUTHERN REGION OF THE GREAT HUNGARIAN PLAIN BASED ON LOCAL
METEOROLOGICAL DATABASE
Á K CSETE and Á GULYÁS
Department of Climatology and Landscape Ecology, University of Szeged, Egyetem u. 2., 6720 Szeged, Hungary E-mail: cseteakos@geo.u-szeged.hu
Summary: Urban environments are very different from natural ones in many cases. The geometry of the buildings and the various artificial surface elements can significantly influence the microclimatic and hydrological processes.
In urban areas, the surface is mostly artificial and it is hard to find natural, undisturbed surfaces, in addition, the vast majority of soil surfaces are generally under strong anthropogenic influence. Models can provide a comprehensive view of the hydrological processes in the city and can help to investigate the different impacts of them. In this study, our aim is to introduce the preparation of a widely applicable model (UFORE-Hydro) for Hungarian pilot areas.
Thus, we intend to introduce the procedure of preparing the weather and evaporation files and their local databases which we used for the model.
Key words: urban hydrology, i-Tree Hydro, sustainable urban water management, green infrastructure, nature-based solutions
1. INTRODUCTION
Growing urban areas and the increasing number of urban citizens are the results of urbanization which is one of the greatest challenges of the 21st century. Nowadays, the worldwide proportion of urban population is over 54%, which is gradually increasing and could reach 66% by 2050 (UN DESA 2019). The territorial and population growth is accompanied by changes in the natural environment and the spread of townscape. The problems of urban areas cannot be separated from the future effects of climate change.
Among the negative effects of climate change, urban water volume and its time distribution is a major problem, which is even more relevant in connection with the growing urban population.
Urban environment shows a fundamentally different picture compared to natural areas. The geometry of the buildings as well as the various artificial surface cover elements can significantly influence the microclimatic and hydrological processes. The most significant change in land cover is the increase of built-up areas, including the use of artificial, mostly impervious pavements (e.g. concrete, asphalt, bricks, various stone pavers, etc.).
Furthermore, the major part of soils is usually under strong anthropogenic effects (e.g. soil sealing, compacting). These factors can significantly affect the hydrological sub-processes.
The most important side effect of impervious surfaces is that they significantly increase surface drainage ability, thus surface runoff (Department of Water 2007, Gayer and Ligetvári 2007).
Fig. 1 The route of water in urban and natural areas (based on [2])
In urban watersheds, the route of precipitation that actually reaches the surface differs significantly from natural areas. The afore-mentioned impervious surfaces do not allow water to infiltrate into the deeper layers. The primary reason for this is the presence of impervious pavements; the other is the drainage system, of which primary purpose is to drain the excess water as quickly as possible. Compared to natural areas, temporary or long-term storage does not occur in urban areas. Due to the rapid drain ability of the impervious surfaces, watercourses flowing through urban areas are exposed to the significant impact of erosion (Fig. 1). Nevertheless, the real problem is the increase in surface runoff volumes. In case large amount of precipitation furthermore, if there is an undersized sewer network, there is a high chance of an urban flashflood (Fig. 2). In a short-term, heavy rainfall event, surface runoff may also reach 80-90% for pervious surfaces, which may be even higher in the case of paved surfaces (Buzás 2012).
Fig. 2 Hydrological processes of different built-up areas (based on US EPA 2003)
In the sustainable urban water management, green infrastructure ‒ as a nature-based solutions (NBS) ‒ plays a key role, within which woody vegetation (trees) has a particular importance for urban ecology (Romnée at al. 2015, Raymond et al. 2017). Trees, among others, participate in the more efficient utilization of precipitation (e.g. runoff reduction, increase in infiltration), influence the microclimate of a city in a positive direction, and play
based on local meteorological database
a significant role in pollution sequestration (Xiao and McPherson 2002, Berland et al. 2017).
Due to their size and physiological properties, their importance in water management is significant compared to other vegetation types, because they are able to interact with precipitation on a larger surface. As a result, they significantly reduce surface runoff, which is a key issue for urban areas with predominantly impervious surfaces. The large amount of rainwater, which is stored in the trunk, branches, and in the tree canopy, also significantly influences the micro-climatic characteristics (e.g. humidity) (Fletcher et al. 2015, Berland et al. 2017).
For these reasons, examining the role of urban vegetation in water management is a very actual issue. Considering growing urban population and the increasing frequency of intense rainfall events, there is an increasing need to change the traditional urban water management approach (which did not focus on vegetation in the past), as global trends are increasingly showing the potential how urban vegetation can and should be used in water management. It is evidenced by the increasingly widespread use of modern water management systems (e.g. WSUD in Australia) and design projects focusing on water retention (e.g. the “Sponge City” project in Berlin, China, and Taiwan) (Liu et al. 2015).
Researches in this scientific area are still relatively rare in Hungary, so we find it particularly important to support the claims with more accurate data and model calculations, which are valid for Hungarian conditions and can help to consider green infrastructure as an opportunity for local decision-making processes (Buzás 2012). Therefore, the central element of our study helps the adaptation of a widely applicable model (UFORE-Hydro) to Hungarian study sites.
The model is available as part of the i-Tree model family developed in the US, and it is outstanding in many respects, as it focuses on the impact of vegetation on urban hydrology (Kirnbauer et al. 2013, Jayasooriya and Ng 2014, Nowak et al. 2018).
The purpose of this work is to present the methodological steps that help the adaptation of the model to the Hungarian circumstances. Furthermore, we intend to present the procedure of the complex input data preparation (weather and evaporation data files) used in the model, based on the Hungarian databases. We would also like to draw the attention of Hungarian decision-makers to the diverse opportunities in the application of urban green infrastructure combined with urban water management. Our data processing steps and results can support the work of professional and scientific experts who can contribute to the decision- making processes.
2. APPLICATION OF THE UFORE-HYDRO MODEL
The UFORE-Hydro model accessible as a part of i-Tree model family (the model can be run through the computer interface of the i-Tree Hydro program, hence referred to as Hydro). The model was developed in the US by various institutes (SUNY College of Environmental Science and Forestry, USDA Forest Service, Syracuse University and the Davey Institute) (Yang et al. 2011, Kirnbauer et al. 2013, Jayasooriya and Ng 2014, Nowak et al. 2018). The Hydro is an ideal tool for analysis different areas and land cover scenarios as well as their hydrological impacts. It can be use at various scales, from a part of urban watershed to a whole city. The advantage of the UFORE-Hydro model (in comparison with other stormwater models), that it can simulate the effect of changes in urban vegetation and its impact on the urban hydrological system more detailed. Most of the urban hydrological
model cannot handle the different types of vegetation and other features (LAI, leaf-off day, etc.).
Among the outputs of the model, information can be obtained about the total runoff, including the base flow, and the two components of the surface runoff: the flow of impervious surfaces and the flow of pervious surfaces. The effect of vegetation on the runoff can be concluded from the data of interception, evaporation, canopy storage, and infiltration.
The model consists of two main input data sources: meteorological and spatial data.
When providing meteorological data, we need to create a weather file and an evaporation file, which will be detailed in the next chapter.
When specifying spatial data, we need a terrain model that allows the model to calculate the direction of the surface flow and its accumulation locations. However, the most important spatial data relate to the land cover of the sites. The percentage of land cover data should include the following: tree canopy cover, herbaceous vegetation cover, shrub vegetation cover, open soil surfaces, water surfaces, and impervious surfaces (buildings and pavements). Additional data are also required for tree canopy and shrub vegetation, as the surface cover beneath their canopy of these types may vary by area. Therefore, it is necessary to define the proportion of impervious and pervious surfaces beneath them. Within both types, we also need to define the spatial distribution of evergreen species.
To define the land cover categories, we used eCognition 9.1 Developer (Baatz and Schape 2000, Manakos et al. 2000, Hay et al. 2005). For this, we used a leafage orthophoto from 2015 and a leafless orthophoto from 2016, in both cases with a geometric resolution of 0.4 meters. We used a digital surface model and a normalized digital surface model (2015) to define the height classes within the vegetation and impervious surfaces. To define these categories, eCognition was used, which requires proper consideration of the spectral and formal characteristics of the data. With Hydro, in addition to real land cover ratio, we have the opportunity to work with alternative land cover ratio, which can be an important tool for urban planning. The real land cover data based on the values of the orthophotos, in contrast with the alternative land cover, where we can define hypothetical land cover rate. In this case, we can run model scenarios and these can be used to estimate the effect of a future square renovation or greening.
For the international use of the Hydro model, in the previous studies it is necessary to designate a reference city with similar climatic conditions in the US, where the most important temporal and spatial distribution of climatic parameters are similar to Szeged or other Hungarian cities ([1]). This step was necessary for the model matching. However, with the steps described below, running the model, which is exclusively based on Hungarian databases, now is available, and it will significantly reduce the number of errors. In this work, our aim is to simplify the international use of the model, especially for Hungarian cities.
2.1. Selection of the study areas
Our study sites are in the city of Szeged, which is the center of the southern region of the Great Hungarian Plain with its special climatic conditions. The area is characterized by low annual precipitation (497 mm), high sunshine duration and consequently frequent drought (Balázs et al. 2009). However, while precipitation is relatively low, the intensity of rainfalls varies greatly. Besides, in the summer long drought periods there are frequent flashfloods, which are a major overload for the outdated sewer network and can cause flooding and damage in large areas. Both factors are major challenges for urban water management (Unger and Gál 2017). Four different urban districts were selected in Szeged as
based on local meteorological database
study sites in order to represent the impact of different land cover characteristics on the hydrological character of the areas. When designating the areas, we took into consideration the local climate zones (LCZ) system (complex climatological category system based on surface structure and geometry moreover the thermal and energy features of the surface) applied to Szeged (Unger et al. 2014a, 2014b). In order to achieve better comparability, the area of the study sites are nearly the same.
The description of areas shown below are only needed to present our future examination which based on these methodologies. These areas will be used in other studies, but it is necessary to show them for better understanding the model.
Study site I. is located in LCZ 2, which is characterized by a dense mix of midrise buildings. This area is the most built-up part of Szeged, which can be described as an absolute downtown location. The study site II. is located directly northeast from study site I. Compact installation is also typical in this area, but with low-rise buildings, so this site can be classified as LCZ 3. As a housing estate district, study site III. shows a fundamentally different picture compared to the previous areas. It is located in LCZ 5, which is characterized by open spaces and midrise buildings. Study site IV. is in the southwestern residential part of Szeged. The characteristics of LCZ 6 can be observed here, such as open spaces and low-rise buildings.
As it is a relatively newly built part of the city, the arrangement of the buildings follows a very regular, square layout (Fig. 3) (Mucsi et al. 2007, Unger et al. 2014b).
Fig. 3 Study sites within Szeged
2.2. Preparation of the input data
The accurate production of the data in the files is essential to run the model correctly (Wang et al. 2008, [1]). The two files have been produced in the United States so far, which raises accuracy issues (such as the availability of certain national data), on the other hand, it also requires a long waiting time. In order to overcome these problems, we needed to produce the necessary data by ourselves. We used several national databases for the process: the
databases of the Department of Climatology and Landscape Ecology (Szeged) (Unger et al.
2017), the Synoptic Station’s database of Hungarian Meteorology Service (HMS Szeged), the SYNOP (Surface Synoptic Observations) database, the i-Tree Eco LAI (Leaf area index) database (run in Szeged) (Kiss et al. 2015), and the ECMWF ERA Interim database (Berrisford et al. 2011).
2.3. Weather file
The weather file forms the basis for the evaporation file, so its accurate production is a top priority (Wang et al. 2008, Hirabayashi and Endreny 2016, [1]). Hydro works with 1- hour resolution data, so the diverse measurement intervals within different databases (10 minutes, 15 minutes) need to be aggregated uniformly. This file contains basic meteorological data that characterize the weather in a given area and time.
The file requires two types of temperature data: air temperature TairF and dew point TdewF in °F. These two types of temperature data needed to the weather file base data, but for the equations temperature data are needed in other units. These data, as well as wind speed were obtained from the HMS synoptic station (Szeged) data.
Wsadj is the windspeed data adjusted by the measurement height and the surface roughness (if the wind gauge is at 2 meters, this step is not necessary). The wind gauge of Szeged synoptic station is positioned at a height of 10 meters, but the model calculates with wind speed at 2 meters during the run. To solve this problem, we used a formula in Eq. 1:
Wsadj[m s−1] = wsm⋅ (hr⋅ hm−1)α (1) α = 0.12 ⋅ z0+ 0.18
where wsm is the measured wind speed, hm is the height of wind measurement, hr is the desired wind speed measurement height, α is an empirical exponent in which z0 is the roughness height in meter (Davenport et al. 2000).
The liquid precipitation (Precip) and the snow quantity (Snow) are need to be given in m h-1. The model handles separately the two type of precipitation, which gives more accurate results (Yang et al. 2011).
The most complex task within generating the weather file is the calculation of net radiation (Eq. 2):
Rn[W m−2] = Sn+ Ln (2)
where Rn is the net radiation, Sn is the net shortwave, and Ln is the net longwave radiation.
For net shortwave radiation (Eq. 3) the surface albedo is required, which obtained is from the ECMWF ERA Interim database (Berrisford et al. 2011). After the conversion of the available NetCDF files, we made its export in ArcGIS software for 12 and 18 hours within 8-9 days in a month for the area of Szeged. The resulting averages reflect the monthly albedo of the area, which was used to help filter out the outliers.
Sn[W m−2] = (1 − ALB) ⋅ Rg (3) In Eq. 3, the ALB is the average monthly albedo in decimal format, and Rg is the global radiation measured at the given time. The net longwave radiation equation contains the following elements:
Ln[W m−2] = ES ⋅ (Lsky+ Lcld− Lsfc) (4)
based on local meteorological database
where ES is the surface emissivity for longwave radiation (constant: 0.97), Lsky is the downwelling longwave radiation from the sky, Lcld is the downwelling longwave radiation from clouds, and Lsfc is the upwelling longwave radiation from the surface (Eq. 4).
Lsfc[W m−2] = σTairK4
(5)
In the Lsfc σ is the Stefan-Bolzmann constant (5.67⋅10-8 W m-2 K-4), TairK is the air temperature in K (Eq. 5). The Lsky and the Lcld consist of the following elements (Eq. 6 and 7):
Lsky[W m−2] = E ⋅ (1 −TOTAL
10 ) ⋅ σTairK4 (6)
Lcld[W m−2] =TOTAL
10 ⋅ σTairK4 (7)
where E is the emissivity of the clear sky, TOTAL is the total current cloud cover in decimal format. In the above equation, the emissivity of the clear sky is an important parameter, if there is no or minimal cloud coverage.
E = 0.741 + 0.0062 ⋅ TdewC (8) In Eq. 8 TdewC is the dew point in °C (Eq. 8). It can be seen that the temperature data used in the weather file are in English units, while in the equations they are given in SI units, which must be taken into account during processing. However, the key element of the file is the net radiation, which is one of the basic data of the evaporation file.
2.4. Evaporation file
The evaporation file in the model could actually be called potential evaporation and evapotranspiration file. The file is designed to allow Hydro to calculate the actual evaporation rate from actual rate of land cover, depending on potential evaporation data (Wang et al.
2008, Hirabayashi and Endreny 2016, [1]). For this, five different data types need to be created: (potential evapotranspiration from trees), PE (potential evaporation from the ground), PETree (potential evaporation from trees), PESnow (potential evaporation from snow on the ground), and PETreesnow (potential evaporation from snow on tree canopy). It can be clearly seen that, in addition to the evaporation from the liquid precipitate, the model can also take into account the evaporation from the solid precipitate, depending on whether it originates from the canopy or from the surface. As an additional data, the evapotranspiration of the trees is also needed. For calculating the potential evaporation values, a modified Penman-Monteith equation is used (Shuttleworth 1992). The basic data needed for the processing were obtained from the department database (Unger et al. 2017) and from the data of the HMS Synoptic Station.
Basic relations
In order to fill the potential evaporation equations with data, it is necessary to define a few basic relationships and constants. To produce the data of latent heat caused by vaporization (λ) the air temperature (TairC) is required in °C (Eq. 9).
λ[MJ kg−1] = 2.501 − 0.002361 ⋅ TairC (9) The density of water in the air (ρw) is necessary to calculate the available water quantity (Eq. 10).
ρw[kg m−3 ] = −0.0051 ⋅ TairC2+ 0.018 ⋅ TairC+ 999.88 (10)
∆ is the slope of the vapor pressure temperature curve (Eq. 11):
∆[kPa °C−1] = 4398es
(237.3+TairC)2 (11)
where es is the saturated vapor pressure. The es can be calculated from Eq. 12. In addition to the saturated vapor pressure, the vapor pressure is also calculated (e) (Eq. 13).
es[kPa] = 0.6108 exp (17.27⋅TairC
237.3+TairC) (12)
e[kPa] = 0.6108 exp (17.27⋅TdewC
237.3+TdewC) (13)
The vapor pressure and the saturated vapor pressure can also be used to calculate the vapor pressure deficit (D) (Eq. 14).
D[kPa] = es− e (14)
We also need the psychometric constant (γ) (Eq. 15):
γ[kPa °C−1] =Cp⋅P
λ (15)
where Cp (=1013 J kg-1 °C-1) is the specific heat of moist air, P (in kPa) is the measured surface pressure.
Wind equations
The potential evaporation and evapotranspiration also strongly depend on the wind conditions, therefore wind speed values, which are projected on the average height of different vegetation types represent a significant factor in the equations. There are several constants in the equations, out of which roughness factors are important. Wind speed varies on the different roughness of the different surfaces, so it is important to define a separate roughness height for each vegetation type:
The roughness height for water rdw [m]=0.00137
The roughness height for trees rdt [m]=0.95
The mass transfer coefficient Zov [m]=0.0123
Since wind measurement at measurement stations is at a given altitude, therefore it is important to assign a height to the different vegetation types, which represents a hypothetical measurement at the height of the vegetation:
The wind measurement height constant Zu [m]=2
The estimated wind measurement height constant for trees Zut [m]=7
The estimated wind measurement height constant for the ground Zug [m]=0.1+rdw
After generating the different heights and roughness, the wind speed values for the canopy and the ground can be set. The Ut is the wind speed projected for the tree canopy (Eq.
16), and Ug is the wind speed projected for the ground (Eq. 17):
Ut[m s−1] = U ⋅ln(
Zut rdw) ln(Zu
rdw) (16)
based on local meteorological database Ug[m s−1] = U ⋅ln(
Zug rdw) ln(Zu
rdw) (17)
where U is the adjusted wind speed for evaporation, which is calculated in the precipitation file (Wsadj). (In equation (1) and (16,17) we used different notation for the wind speed (Wsadj/U according to the corresponding references because of the easier traceability).
Evaporation equations
The model calculates the potential evapotranspiration of trees (Eq. 18):
PET [m h−1] = 1
λ⋅ρw[(∆⋅Rn)+
ρa⋅Cp⋅D ra1
∆+γ⋅(1+rs
ra1) ] ⋅ 10−3 (18) where ra1 is the aerodynamic resistance as described above (Eq. 19), and since transpiration is also investigated, rs is the stomal resistance (Eq. 20).
ra1[s m−1] =208
Ut (19)
rs[s m−1] =200
L (20)
For ra this simplified formula refers to general vegetation surfaces (such as urban areas), where we do not know the exact composition of vegetation. There is also a plant- specific formula, but for this, it is necessary to have sufficient data on the vegetation of the area. For rs L denotes the leaf area index (LAI).
It is also necessary to make two aerodynamic resistance values for the calculation of PETree and PE, which are different from those used in the previous equation, as in this case there is no transpiration through the vegetation. The aerodynamic resistance for trees rat (Eq.
21) and the aerodynamic resistance for ground rag (Eq. 22) are the following:
rat[s m−1] =4.72⋅(ln
Zut Zov⋅rdt)
2
1+0.536⋅Ut (21)
rag[s m−1] =4.72⋅(ln
Zug Zov⋅rdw)
2
1+0.536⋅Ug (22)
The PETree is used to calculate evaporation from the surface of the trees (leaf, bark).
Thus, this equation does not include the amount of transpiration processes of trees (Eq. 23).
PETree [m h−1] = 1
λ⋅ρw[(∆⋅Rn)+
ρa⋅Cp⋅D rat
∆+γ ] ⋅ 10−3 (23)
The equation of PE is needed to calculate the amount of water evaporated from the ground of the study site (pervious and impervious surfaces) (Eq. 24).
PE [m h−1] = 1
λ⋅ρw[
(∆⋅Rn)+ρa⋅Cp⋅D rag
∆+γ ] ⋅ 10−3 (24)
Since Hydro also handles snow precipitation (Yang et al. 2011), the calculation of evaporation from snow surfaces is also solved. It also consists of two components of the evaporation: evaporation from the canopy and from the ground. In the case of PETreesnow we can calculate the evaporation of snow falling on the canopy (Eq. 25).
PETreesnow [m h−1] =0.1
P ⋅ { Ut
[ln(Zut rdw)]2
⋅ (611.2 − e)} ⋅ 10−3 (25) For PESnow the potential evaporation of the snow falling on the ground is calculated (Eq. 26).
PESnow [m h−1] =0.1P ⋅ { Ug
[ln(Zu rdw)]2
⋅ (611.2 − e)} ⋅ 10−3 (26) After the exact substitution of the equations, we obtain the desired data that Hydro can handle properly. The model works with a comma-delimited file format, so preformatting is necessary.
3. FEASIBLE RESULTS
The Hydro model gives many results, which can help the planners to evaluate the hydrological potential of the vegetation and can be used to draw the attention of decision- makers to the importance of vegetation in urban water management. The model output contains the results in hourly resolution with the help of which, can be analyzed the process and quantity on a given time. The results can be summarized, and these data can show monthly and yearly quantity of processes. The summarized result can be shown the study area hydrological state, and with the help of which can be used to draw the attention of decision-makers the potential water management problem of the study area. If we use the opportunity of modeling different hydrology scenarios, they can be show the consequence of planned greening or square renovation.
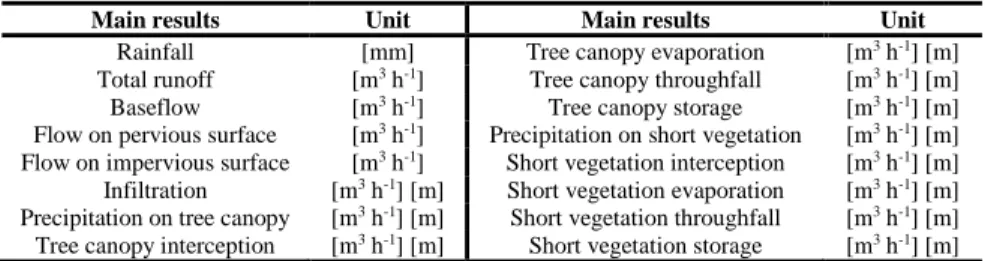
The model result can be arrange two main groups. The first main group is the flow results, which can show the quantity of the different flow type. The other main group contains the vegetation processes, and within this, can be distinguish the short vegetation and the tree vegetation type (Table 1).
Table 1 The main result types of the model
Main results Unit Main results Unit
Rainfall [mm] Tree canopy evaporation [m3 h-1] [m]
Total runoff [m3 h-1] Tree canopy throughfall [m3 h-1] [m]
Baseflow [m3 h-1] Tree canopy storage [m3 h-1] [m]
Flow on pervious surface [m3 h-1] Precipitation on short vegetation [m3 h-1] [m]
Flow on impervious surface [m3 h-1] Short vegetation interception [m3 h-1] [m]
Infiltration [m3 h-1] [m] Short vegetation evaporation [m3 h-1] [m]
Precipitation on tree canopy [m3 h-1] [m] Short vegetation throughfall [m3 h-1] [m]
Tree canopy interception [m3 h-1] [m] Short vegetation storage [m3 h-1] [m]
As the Fig. 4 shows, the model gives comprehensive picture about the flow and the processes of the vegetation on the study site. Based on these results, we can provide
based on local meteorological database
information about a whole year hydrological state and the vegetation contribution to the runoff reduction. The quantitative data can provide a good basis for the urban planning documents.
Fig. 4 Sample flow and interception results of Hydro
4. CONCLUSION
The advantage of the UFORE-Hydro model compared to other available hydrology and stormwater management models is the high consideration of vegetation surfaces (Kirnbauer et al. 2013, Jayasooriya and Ng 2014, Nowak et al. 2018). However, in the study of meteorological and hydrological processes, due to their complexity, there is a great chance for error. Complexity is further enhanced by the consideration of different vegetation surfaces, thereby the chance of error also increases. Therefore, it is important that the input files of the model are based on accurate databases. The required files have been created in the US so far (with some basic data), but the additional data came from databases with low geometric resolution. For the regular and high-precision use of the model in Hungary, it is necessary that the files are based on entirely Hungarian databases and files built by individual users. In this paper, we made a step-by-step introduction guide of the structure of the input files from the basics and the available databases for their production. We listed the databases that can be used to generate the files. At national level, few cities have a measuring network density such as Szeged (Unger et al. 2017); in their case, the HMS and SYNOP databases can serve as appropriate bases. For the albedo we used the free database of ECMWF ERA Interim (Berrisford et al. 2011), which available for everyone. The leaf surface index can be obtained either by field measurements or from literature and modeled data. After obtaining the data, it is important to load the equations accurately, as several other equations (e.g. Rn) are based on each basic equation.
With these steps, the UFORE-Hydro's adaptation in Hungary is feasible from the point of view of meteorological data. The refinement of the databases is naturally desirable, but the requirements of the model input parameter can be done with these solutions. By using Hydro, we can obtain a picture of the current hydrology processes in the study sites, but as we have the ability to run scenarios, it can also be used in urban planning. Research on a small study site can contribute to a whole city level research. As a result of our adaptation,
the input data comes from a reliable, accurate source, and can be extended to a significant part of Hungarian cities.
REFERENCES
Balázs B, Unger J, Gál T, Sümeghy Z, Geiger J, Szegedi S (2009) Simulation of the mean urban heat island using 2D surface parameters: empirical modeling, verification and extension. Meteorol Appl 16:275-287 Baatz M, Schape A (2000) Multiresolution Segmentation: an optimization approach for high quality multi-scale
image segmentation. In: Strobl J, Blaschke T, Griesbner G (eds) Angewandte Geographische Informationsverarbeitung, Vol. 12. Wichmann-Verlag, Heidelberg, 12-23
Berrisford P, Dee DP, Poli P, Brugge R, Fielding M, Fuentes M, Kållberg PW, Kobayashi S, Uppala S, Simmons A (2011) The ERA-Interim archive Version 2.0. ERA Report, 23 p.
Berland A, Shiflett SA, Shuster WD, Garmestani AS, Goddard HC, Herrmann DL, Hoptonc ME (2017) The role of trees in urban stormwater management. Landscape Urban Plan 162:167-177
Buzás K (ed) (2012) Települési csapadékvíz-gazdálkodás. [Urban stormwater management. (in Hungarian)] TERC Kereskedelmi és Szolgáltató Kft, Budapest
Davenport AG, Grimmond CSB, Oke TR, Wieringa J (2000) Estimating the roughness of cities and sheltered country. Proc. 12th Conf. Applied Climatology, Am. Meteorol. Soc., Boston, 96-99
Department of Water (2007) Stormwater Management Manual for Western Australia. Department of Water 2004- 2007
Fletcher TD, Shuster W, Hunt WF, Ashley R, Butler D, Arthur S, Trowsdale S, Barraud S, Semadeni-Davies A, Bertrand-Krajewski JL, Mikkelsen PS, Rivard G, Uhl M, Dagenais D, Viklander M (2015) SUDS, LID, BMPs, WSUD and more – The evolution and application of terminology surrounding urban drainage.
Urban Water J 12:525-542
Gayer J, Ligetvári F (2007) Települési vízgazdálkodás, csapadékvíz elhelyezés. [Urban stormwater management, stormwater disposal. (in Hungarian)] Környezetvédelmi és Vízügyi Minisztérium, Budapest Hay GJ, Castilla G, Wulder MA, Ruiz JR (2005) An automated object-based approach for the multiscale image
segmentation of forests scenes. Int J Appl Earth Obs 7(4):339-359
Hirabayashi S, Endreny TA (2016) Surface and upper weather pre-processor for i-Tree Eco and Hydro. i-Tree Eco and UFORE Resources, Version 1.2, 19 p.
Jayasooriya VM, Ng AWM (2014) Tools for modeling of stormwater management and economics of green infrastructure practices: A review. Water Air Soil Pollut 225:2055-2075
Kirnbauer MC, Baetz BW, Kenney WA (2013) Estimating the stormwater attenuation benefits derived from planting four monoculture species of deciduous trees on vacant and underutilized urban land parcels.
Urban For Urban Gree 12(3):401-407
Kiss M, Takács Á, Pogácsás R, Gulyás Á (2015) The role of ecosystem services in climate and air quality in urban areas: Evaluating carbon sequestration and air pollution removal by street and park trees in Szeged (Hungary). Morav Geogr Rep 23(3):36-46
Liu CM, Chen JW, Hsieh YS, Liou ML, Chen TH (2015) Build Sponge Eco-cities to Adapt Hydroclimatic Hazards. In: Leal Filho W (eds) Handbook of Climate Change Adaptation. Springer, Berlin, Heidelberg Manakos I, Schneider T, Ammer U (2000) A comparison between the isodata and the eCognition classification
methods on basis of field data. ISPRS 2000, Vol. XXXIII, Supplement CD, Amsterdam
Mucsi L, Kovács F, Henits L, Tobak Z, van Leeuwen B, Szatmári J, Mészáros M (2007) Városi területhasználat és felszínborítás vizsgálata távérzékeléses módszerekkel. In: Mezősi G (szerk) Városökológia
[Examination of urban land use and land cover by remote sensing. In: Mezősi G (eds) Urban ecology (in Hungarian)] Földrajzi Tanulmányok 1:43-65
Nowak DJ, Maco S, Binkley M (2018) i-Tree: Global tools to assess tree benefits and risks to improve forest management. ASCA Arbor Consult 51(4):10-13
Raymond CM, Berry P, Breil M, Nita MR, Kabisch N, de Bel M, Enzi V, Frantzeskaki N, Geneletti D, Cardinaletti M, Lovinger L Basnou C, Monteiro A, Robrecht H, Sgrigna G, Munari L, Calfapietra C (2017) An impact evaluation framework to support planning and evaluation of Nature-based solutions projects. Report prepared by the EKLIPSE Expert Working Group on Nature-based Solutions to Promote Climate Resilience in Urban Areas. Centre for Ecology & Hydrology
Romnée A, Evrard A, Trachte S (2015) Methodology for a stormwater sensitive urban watershed design. J Hydrol 530:87-102
based on local meteorological database
Shuttleworth WJ (1992) Evaporation. In: Maidment D (ed) Handbook of hydrology. McGRaw Hill: New York, NY, USA.
Unger J, Lelovics E, Gál T (2014a) Local Climate Zone mapping using GIS methods in Szeged. Hun Geo Bull 63(1):29-41
Unger J, Lelovics E, Gál T, Mucsi L (2014b) A városi hősziget fogalom finomítása a lokális klímazónák koncepciójának felhasználásával – példák Szegedről. [Refining the concept of urban heat island using the concept of local climate zones – examples from Szeged. (in Hungarian)] Földrajzi Közlemények 138(1):50-63
Unger J, Gál T (2017) Városklíma. [Urban Climate (in Hungarian)] Szeged, GeoLitera, 256 p.
Unger J, Skarbit N, Gál T (2017) Szegedi városklíma mérőállomás-hálózat és információs rendszer. [Urban climate measurement station network and information system of Szeged. (in Hungarian)] Légkör 62(3):114-118
UN DESA [United Nations, Department of Economic and Social Affairs, Population Division] (2019) World Urbanization Prospects: The 2018 Revision (ST/ESA/SER.A/420). New York, United Nations US EPA [US Environmental Protection Agency] (2003) Protecting Water Quality from Urban Runoff. EPA 841-
F-03-003
Wang J, Endreny TA, Nowak DJ (2008) Mechanistic simulation of tree effects in an urban water balance model. J Am Water Resour Assoc 44(1):75-84
Xiao Q, McPherson EG (2002) Rainfall interception by Santa Monica’s municipal urban forest. Urban Ecosyst 6:291-302
Yang Y, Endreny TA, Nowak DJ (2011) iTree‐Hydro: Snow hydrology update for the Urban Forest Hydrology Model. J Am Water Resour Assoc 47(6):1211-1218
[1] i-Tree Hydro User's Manual v5.1. (2016) (https://www.itreetools.org/documents/241/Hydro_Manual_v5.1.pdf) [2] Melbourne Water Introduction to WSUD (https://www.melbournewater.com.au/planning-and-
building/stormwater-management/introduction-wsud)
![Fig. 1 The route of water in urban and natural areas (based on [2])](https://thumb-eu.123doks.com/thumbv2/9dokorg/968553.57661/2.774.224.553.118.323/fig-route-water-urban-natural-areas-based.webp)