Comparison of different urban areas with respect to thermal comfort conditions in Budapest (Hungary)
Attila Kovács1 and Ákos Németh2
1Department of Climatology and Landscape Ecology, University of Szeged, Egyetem u. 2, H-6701 Szeged, Hungary,
E-mail: kovacsattila@geo.u-szeged.hu
2Climatology Division, Hungarian Meteorological Service, Kitaibel Pál u. 1, H-1525 Budapest, Hungary,
E-mail: nemeth.a@met.hu
Abstract – In spite of the fact that the evaluation of the thermal conditions in the urban areas is extremely important and timely, in Budapest (capital of Hungary) very few studies were performed in this direction until now. The aim of this paper is to analyze the differences and changes of the thermal comfort conditions in the last half century (1961–2010) by comparing measurements of two meteorological stations located in different environments of Budapest: one in the central urban area (Local Climate Zone 2 – „compact midrise‟) and the other in the suburbs (between Local Climate Zones 6 – „open lowrise‟ and A – „dense trees‟). The thermal comfort was characterized by a widely used human bioclimatological comfort index, the Physiologically Equivalent Temperature (PET) for four characteristic times of the day in the examined period. Then the thermal comfort differences between the stations according to two climatic normal periods (1961–1990 and 1981–2010), and the tendencies detected among the periods were also under investigation. For the last decade, 2001–2010, hourly-resolution investigations were carried out. The results indicate that the central area is affected by a higher degree of hot stress and less cold stress. Additionally, the warm stress has become more frequent, however, the cold heat load decreased in both examined area at each time.
Key-words: thermal comfort in urban area, LCZ classification system, long- term data series, Physiologically Equivalent Temperature (PET)
1. Introduction
In urban environments the thermal conditions can be stressful for humans due to the modification of the climatological and bioclimatological
parameters. In addition, due to the growing global population and urbanization more and more people are exposed to the large variety of thermal conditions. Therefore, the assessment of the thermal comfort in our cities is an extremely timely research direction today. It provides help for the the urban planners, the public health authorities, or the tourism operators in their work. The urban planning or decision-making processes often do not consider the human biometeorological aspects in Hungary despite the fact that the thermal comfort is one of the key factors of human health, and therefore it is necessary to maintain its optimum level.
There are extensive human bioclimatological studies in progress in Szeged, South Hungary (e.g. Unger 1999; Gulyás et al., 2006; Kántor and Unger, 2010). As an example, research in terms of the subjective evaluation of thermal environment in recreational urban spaces have been conducted for several years (Kántor and Gulyás, 2010; Kántor et al., 2012). In the capital of Hungary, Budapest, no detailed human thermal comfort examinations have been implemented yet (e.g. Németh, 2011).
The aim of this research is to characterize and quantify the thermal comfort differences between two meteorological stations situated in the central area and the suburbs of Budapest. Additionally, tendencies in human comfort conditions in the last half-century (1961–2010) were also analyzed.
2. Study areas and applied methods
2.1. Description of the study areas
Budapest is situated in central Hungary (47°N, 19°E). It has nearly 2 million inhabitants and additionally, the urban thermal environment affects the quality of life of at least 200.000 commuters each day, too. In this paper the measured data of two meteorological stations of the Hungarian Meteorological Service (HMS) were used (Fig. 1).
One station (Budapest-Kitaibel Pál utca) is located in a densely populated central urban area of the city. According to the „Local Climate Zone‟ classification system developed by Stewart and Oke (2012) this area belongs to the „compact midrise‟ (LCZ 2). However, the location of this station is not really ideal because the effects of the Buda Hills are already detected in its data. Additionally, the measurement conditions have changed significantly since April 1985 as the previous regular, street-level measurements moved to the roof terrace of the central building of the HMS.
The other measuring point (Budapest-Pestszentlőrinc) is located in the suburban region between the zones classified as „open lowrise‟ (LCZ 6) and
„dense trees‟ (LCZ A) (Stewart and Oke, 2012). The measurements take
place in a large observing garden, in regular conditions. During the examined period there was no change in its location, so the data series can be regarded as homogeneous.
Fig. 1. Geographical location of Hungary and Budapest (a, b); locations of the examined meteorological stations (c) and areal photographs of their surroundings
The urban-rural temperature difference, or UHI (urban heat island) magnitude, is the most widely cited measure of climate modification of the cities, but the most poorly represented. Therefore, UHI magnitude can be determined as a Local Climate Zone (LCZ) temperature difference (e.g. TLCZ
1 – TLCZ D), not an urban-rural temperature difference (Tu – Tr) (Stewart and Oke, 2012).
Our study follows this new framework and compares the human thermal conditions of the above mentioned two urban areas of Budapest. We assumed that the central station can represent the climate modification effects of the city centre relative to the other urban areas of Budapest.
2.2. Measure of the thermal comfort conditions
In order to characterize the human comfort conditions in the study areas one of the most widely used bioclimatological comfort indices, the Physiologically Equivalent Temperature (PET) was applied (Matzarakis et al., 1999). PET is defined as the air temperature at which the heat budget of the human body in a typical indoor setting is balanced with the same core and skin temperature as under the actual, complex outdoor conditions to be assessed (Höppe, 1999). The PET ranges for temperate climate were defined according to different thermal perceptions (Table 1).
The calculations of PET were referred to a standard European 35-year- old sedentary man with a height of 1.75 m and a bodyweight of 75 kg. The insulation factor of clothing has been standardized to 0.9. The meteorological parameters necessary for the calculation of the PET (air temperature, relative humidity, wind velocity and degree of cloud cover) were available at the
mentioned stations. There were some corrections in air temperature data derived from the roof level at the central station. The measured wind speed data of both stations were transformed to the reference height of 1.1 m using a formula from Kuttler (1998).
Table 1. Categories of the physiologically equivalent temperature values for different grades of thermal perception and physiological stress (Matzarakis and Mayer, 1996). *The original
ranges do not include these two categories, they are used in practice only in Hungary!
There were observations every six hours (6, 12, 18 and 24 UTC) in the examined period. Additionally, in the period of 2001–2010 the measurements are more detailed, which means that hourly data were available. The applied bioclimate index was determined at these times by means of the model RayMan. (Matzarakis et al., 1999, 2007). Then hourly, daily, 10-day, monthly, seasonal, annual and 30-year averages of PET were calculated from the PET values. Based on these values frequency and distribution charts of both stations were constructed where PET ranges are represented according to Table 1.
3. Results and discussion
3.1. Bioclimate charts for the periods of 1961–1990 and 1981–2010
The first part of the analysis concerns the normal periods of 1961–1990 and 1981–2010 when the differences detected between the stations as well as among the periods were observed. The bioclimate charts showing the frequencies of the PET categories have 10-day intervals (Figs. 2 and 3).
As the results show, the number of cold stress days at 0 UTC in the period of 1961–1990 is less by 2.5% in the centre than in the suburban area.
This difference increases to 5% in the period of 1981–2010. Thus, at night the inhabitants in the city centre are affected by less cold stress in winter than those in the suburbs. However, the heat load increased in the city centre in summer and therefore the people are generally less able to regenerate during the night. In mid-summer already the slightly warm heat stress category appears there in the second period. The tendency of differences between the
stations is similar also at 6 UTC. In the two periods, the frequency of the warm stress is higher in the centre by 4.4% and 5.8%, respectively.
In the early afternoon period (12 UTC) the city centre shows also a high heat load during the summer months, which means 8.8% and 10.3%
higher frequencies in the two 30-year periods, respectively. Therefore, the everyday outdoor work can be adversely affected during the summer months in the city centre. Nevertheless, it is favourable to city dwellers that the cold stress is lower by 7.6% than in the suburbs, which further declines by 1% in the later period.
Fig. 2. The 10-day relative frequencies of PET categories (°C) in the suburban (left) and the central urban (right) areas for the period of 1961–1990, at 0, 6, 12 and 18 UTC (top down)
At 18 UTC a similar tendency can be observed but the difference is much smaller than in the mid-day period. At this time, the warm stress is higher by 3.3% and 4.4% in the centre, but the cold stress is lower by 5.1% and 6.3%.
In summer, the evening relaxation or ventilation opportunity may be limited in the centre which can have extremely negative effects.
In summary, at every time people in the centre perceive higher warm and less cold stress with the largest differences found in early afternoon, even when the strongest heat stress prevails in summer and outdoor activities are really significant. The smallest differences appear in the evening and at night.
Fig. 3. The 10-day relative frequencies of PET categories (°C) in the suburban (left) and the central urban (right) areas for the period of 1981–2010, at 0, 6, 12 and 18 UTC (top down)
Furthermore, according to the relative frequencies of PET categories an increasing tendency of warm stress can be observed in all cases during the investigated 20-year shift (Figs. 2 and 3).
3.2. Daily and hourly distribution of mean PET values in the period of 2001–
2010
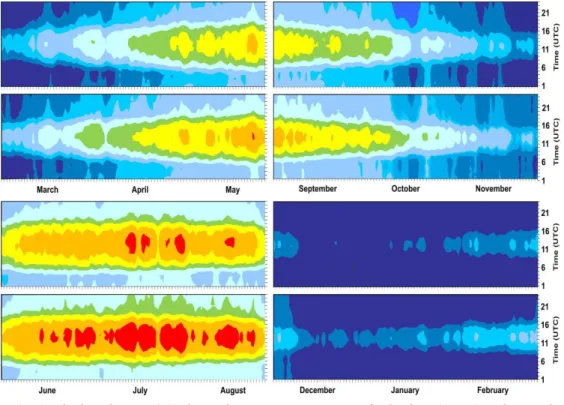
In the 2001–2010 period, the characteristics of the intra-day changes of thermal comfort by seasons are analyzed in detail based on the hourly PET values. We considered the distribution of PET averages by days and hours (Fig. 4). Generally, at a given time a greater degree of hot stress and less cold stress can be detected in the centre by a PET category.
Fig. 4. The hourly PET (°C) thermal sensation categories of suburban (upper) and central urban (lower) areas by seasons for the period of 2001–2010
In late spring, the city centre already has a significant ratio of warm sensation category and also the hot category appears, while in the suburbs the ratio of warm load is low. In summer, the hot stress becomes dominant at noon in the centre. It should be noted that in summer evenings the warm stress decreases remarkably slowly in the centre keeping nights warmer than in the suburbs.
In early autumn, the warm category is already missing in the daytime and by the end of autumn the frosty (extreme cold stress) category becomes
prevalent in the suburbs (except at noon). According to the ten-year average, the extreme cold stress is dominant in both areas in winter, but during daytime the people in the city are affected by smaller cold stress. This may have a positive impact on the thermal comfort here.
4. Conclusion
In this study the differences and changes of the bioclimatological conditions were examined in the last half century based on the measurements of two meteorological stations located in different environments of Budapest.
The analysis of the features, differences and tendencies of human comfort conditions leads to following conclusions:
– As the bioclimate diagrams in the periods of 1961–1990 and 1981–2010 show, the main features of the differences of measuring points are the same in all four characteristic observation times: the city centre is affected by higher heat load and less cold stress. The largest differences appear in the daytime period, while the smallest in the evening and at night.
Furthermore, the detected trends between the normal periods indicate that warm stress has become more common while cold heat load decreased in both stations at each examined time. Their effect on human comfort depending on the season can be either advantageous (winter) or disadvantageous (summer).
– According to the daily and hourly distribution of mean PET values in the period of 2001–2010, in general at a given time the central area is influenced by a higher degree of hot stress and less cold stress by a category of PET. The warmer nights detected in the centre in summer can affect the thermal comfort conditions particularly adversely.
The presumed reason for the received bioclimatic differences and tendencies is the fact that the intensifying built-up ratio and the detected global warming in the last decades together strengthened the urban heat island effect in the central areas, while in the suburbs, rather only the climate change may play a role in the detected increasing trend.
It should not be ignored that the location of the central station is not really ideal for urban climatological research. Therefore, in the near future, it is necessary to establish a few meteorological stations at street-level in the urban area, which would represent the different Local Climate Zones, which occur in Budapest better.
Acknowledgements – The publication is supported by the European Union and co-funded by the European Social Fund. Project title: “Broadening the knowledge base and supporting the long term professional sustainability of
the Research University Centre of Excellence at the University of Szeged by ensuring the rising generation of excellent scientists.” Project number:
TÁMOP-4.2.2/B-10/1-2010-0012.
References
Gulyás Á., Unger J. and Matzarakis A., 2006: Assessment of the microclimatic and thermal comfort conditions in a complex urban environment: modelling and measurements. Build. Environ. 41, 1713–
1722.
Höppe P., 1999: The physiological equivalent temperature – a universal index for the biometeorological assessment of the thermal environment.
Int. J. Biometeorol. 43, 71–75.
Kántor N. and Gulyás Á., 2010: Area usage and thermal sensation vs. thermal comfort conditions – open air thermal comfort project in Szeged, Hungary. Berichte des Meteorologischen Instituts der Albert-Ludwigs- Universität Freiburg 20, 504–509.
Kántor N. and Unger J., 2010: Benefits and opportunities of adapting GIS in thermal comfort studies in resting places: An urban park as an example.
Landscape Urban Plan. 98, 36–46.
Kántor N., Égerházi L. and Unger J., 2012: Subjective estimation of thermal environment in recreational urban spacesdpart 1: investigations in Szeged, Hungary. Int. J. Biometeorol. 56, 1075–1088.
Kuttler W., 1998: Stadtklima. (Urban climate). In Stadtökologie (eds.: Sukopp H. and Wittig R.). Gustav Fischer, Stuttgart-Jena-Lübeck-Ulm, 125–167.
Matzarakis A. and Mayer H., 1996: Another kind of environmental stress:
Thermal stress. WHO Newsletter 18, 7–10.
Matzarakis A., Mayer H. and Iziomon M.G., 1999: Applications of a universal thermal index: physiological equivalent temperature. Int. J.
Biometeorol. 43, 76–84.
Matzarakis A., Rutz F. and Mayer H., 2007: Modelling radiation fluxes in simple and complex environments – application of the RayMan model.
Int. J. Biometeorol. 51, 323–334.
Németh Á., 2011: Changing thermal bioclimate in some Hungarian cities.
Acta Climatol. Univ. Szegediensis 44–45, 93–101.
Stewart I.D. and Oke T.R., 2012: „Local Climate Zones‟ for urban temperature studies. Bull. American Meteorol. Soc. (doi:
10.1175/BAMS-D-11-00019.1).
Unger J., 1999: Comparisons of urban and rural bioclimatological conditions in the case of Central-European city. Int. J. Biometeorol. 43, 139–144.
megjelenés
A TÁMOP-4.2.2/B-10/1-2010-0012 azonosítószámú projekthez kapcsolódóan küldöm mellékelve egy novemberi egri nemzetközi konferencia CD-kiadványára most elkészült cikket.
(A konferencián bemutatott posztert november végén már elküldtem, lásd.
alább).
Kellemes Ünnepeket kívánok.
Üdv,
Kovács Attila PhD hallgató
SZTE TTIK Éghajlattani és Tájföldrajzi Tanszék Földtudományok Doktori Iskola