Universitatis Szegediensis, Tomus 46, 2012, 115-124
TENDENCIES AND DIFFERENCES IN HUMAN THERMAL COMFORT IN DISTINCT URBAN AREAS IN BUDAPEST, HUNGARY
A KOVÁCS1 and Á NÉMETH2
1Department of Climatology and Landscape Ecology, University of Szeged, P.O.Box 653, 6701 Szeged, Hungary E-mail: kovacsattila@geo.u-szeged.hu
2Climatology Division, Hungarian Meteorological Service, P.O.Box 38, 1525 Budapest, Hungary
Summary: In the Hungarian capital city, Budapest, no detailed human thermal comfort examinations have been performed until now despite the fact that the analysis of urban climate from a human comfort point of view is extremely timely. The objective of the present study is to evaluate the differences and changes of the thermal comfort conditions in the last half century based on the measurements of two meteorological stations located in different environments: one in the central urban area (Local Climate Zone 2 – ‘compact midrise’) and the other in the suburbs (between Local Climate Zones 6 – ‘open lowrise’ and A – ‘dense trees’). The thermal comfort was quantified using a popular bioclimate index, the Physiologically Equivalent Temperature (PET) for four characteristic times of the day: 6, 12, 18 and 24 UTC in the period of 1961–2010. Then the thermal comfort differences between the stations according to three climatic normal periods (1961–1990, 1971–2000 and 1981–
2010), and the tendencies detected among the periods were also analyzed. For the last decade, 2001–2010, more detailed hourly-resolution investigations were carried out. According to the results, the annual and seasonal averages of PET are higher in the central area in each climate normal period and at all dates; furthermore the PET averages increase during the consecutive 30-year periods. The results proved that warm stress has become more frequent; however, the cold heat load decreased in both examined area. Investigating the hourly data, in terms of the whole ten-year period,a higher ratio of hot stress and less cold stress can be observed in the central area.
Key words: urban area, local climate zones, 50-year data series, thermal comfort, Physiologically Equivalent Temperature (PET)
1. INTRODUCTION
Due to the rapid urbanization more and more people are exposed to the modified climate of urban areas where the thermal conditions (in addition to air pollution and noise) can be stressful for humans. This tendency increases the importance of the investigations related to the thermal comfort conditions in our cities and their changes, hereby providing help for the urban planners, the public health authorities, or the tourism operators in their work. The urban planning or decision-making processes often do not consider the human biometeorological aspects in Hungary. A complete change of attitude is needed in this field because thermal comfort is one of the determining factors of human health and the quality of life, and therefore it is crucial to maintain its optimum level.
In Hungary there are extensive urban climatological studies in progress in Szeged, South Hungary. These studies include detailed examinations of human thermal comfort too (e.g. Unger 1999, Gulyás et al. 2006, 2010). As an example, research in terms of the relationship between the attendance and comfort conditions of public areas have been
conducted for several years (Kántor and Gulyás 2010, Kántor and Unger 2010, Égerházi and Kántor 2011).
Budapest (capital of Hungary) has nearly 2 million inhabitants and additionally, the urban thermal environment affects the quality of life of at least 200.000 commuters each day, too. Even so, very few studies were implemented in this direction in Budapest until now (e.g. Németh 2011). The aim of this research is therefore to establish a detailed human comfort investigation in this large urban environment based on the currently available data.
To achieve this, we characterize and quantify the bioclimatological differences between two meteorological stations situated in the central area and the suburbs. In addition, tendencies in human comfort conditions in the last half-century are also under investigation.
2. STUDY AREAS AND METHODS
2.1. Study areas
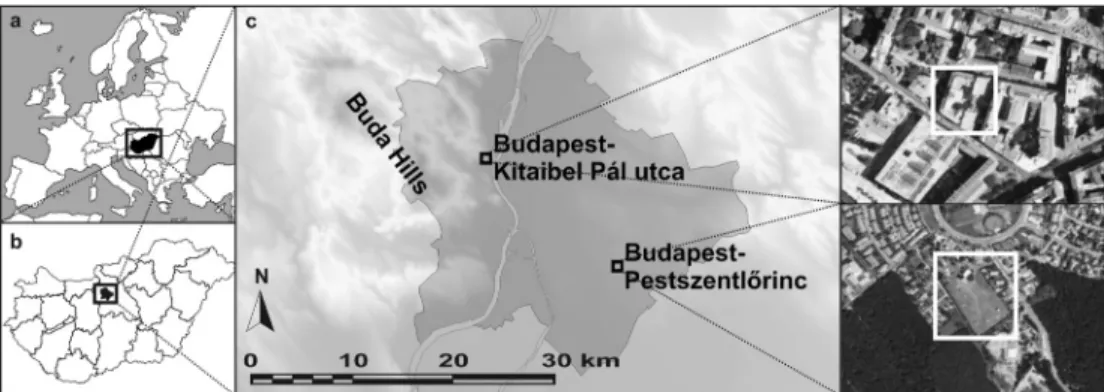
Budapest is situated in central Hungary (47°N, 19°E). In this study the measured data of two meteorological stations of the Hungarian Meteorological Service were used (Fig. 1). One station (Budapest-Kitaibel Pál utca) is located in a densely populated central urban area of the city. According to the ‘Local Climate Zone’ classification system developed by Stewart and Oke (2012) this area belongs to the ‘compact midrise’ (LCZ 2).
However, the location of this station is not ideal because the effects of the Buda Hills are already detected in its data. In addition, the measurement conditions have changed significantly since April 1985 as the previous regular, street-level measurements moved to the roof terrace of the central building of the Hungarian Meteorological Service. (Ambrózy et al. 2006). Nevertheless, we assumed that this station, due to its relatively central location, can represent the climate modification effects of the city centre relative to the other urban areas of Budapest.
Fig. 1 Geographical location of Hungary and Budapest (a, b); locations of the examined meteorological stations (c) and areal photographs of their surroundings
The other station (Budapest-Pestszentlőrinc) is located in the suburban region between the areas classified as ‘open lowrise’ (LCZ 6) and ‘dense trees’ (LCZ A) (Stewart and Oke 2012). The measurements take place in a large observing garden, in regular
conditions. During the examined period (1961–2010) there was no change in its location, so the data series can be regarded as homogeneous.
As Stewart and Oke (2012) state ‘the urban-rural temperature difference, or UHI magnitude, is the most widely cited measure of city climate modification in the environmental sciences. It is also the most poorly represented.’ Therefore, they proposed a new framework, where UHI magnitude is an LCZ temperature difference (e.g. TLCZ 1 – TLCZ D), not an urban-rural temperature difference (ΔTu–r). Our study follows this framework in the comparison of human thermal conditions in the above mentioned two urban areas of Budapest.
2.2. Methods
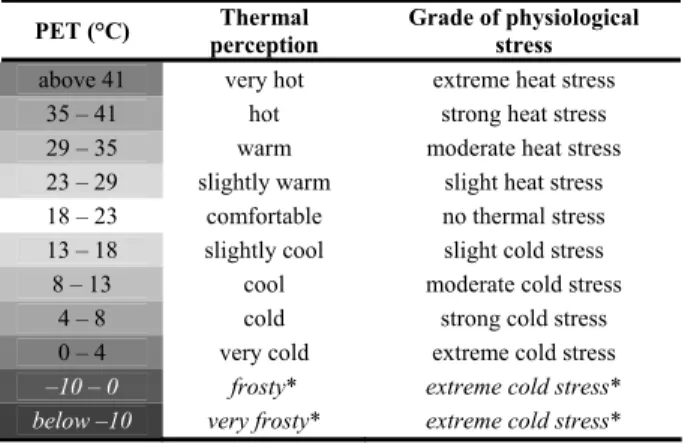
In order to characterize the human comfort conditions in the study areas one of the best known and most widely used bioclimate indices, the Physiologically Equivalent Temperature (PET) was applied (Matzarakis et al. 1999). PET is defined as the air temperature at which the heat budget of the human body in a typical indoor setting is balanced with the same core and skin temperature as under the actual, complex outdoor conditions to be assessed (Höppe 1999). The PET value ranges were defined according to different thermal perceptions for temperate climate (Table 1) (Matzarakis and Mayer 1996).
Table 1 Categories of the physiologically equivalent temperature values for different grades of thermal perception and physiological stress (Matzarakis and Mayer 1996). *The original ranges do
not include these two categories, they are used in practice only in Hungary!
PET (°C) Thermal perception
Grade of physiological stress above 41 very hot extreme heat stress
35 – 41 hot strong heat stress
29 – 35 warm moderate heat stress
23 – 29 slightly warm slight heat stress 18 – 23 comfortable no thermal stress 13 – 18 slightly cool slight cold stress
8 – 13 cool moderate cold stress
4 – 8 cold strong cold stress
0 – 4 very cold extreme cold stress –10 – 0 frosty* extreme cold stress*
below –10 very frosty* extreme cold stress*
The meteorological parameters necessary for the calculation of the PET (air, temperature, relative humidity, wind velocity and degree of cloud cover) were available at the mentioned stations. (As no visual observations are at 24 UTC in the case of the central urban (LCZ 2) station, the cloudiness data are missing here. These data are replaced by those of the other station.) There were some corrections in air temperature data derived from the roof level at this station. The measured wind speed data of both stations were transformed to the reference height of 1.1 m (the average height of an adult’s gravitation centre) using a formula from Kuttler (1998). The calculations of PET were referred to a standard European 35-year-old, 1.75 m high, 75 kg weight, sedentary man, wearing clothing with a heat resistance of 0.9 clo.
In the examined period there were observations every six hours (6, 12, 18 and 24 UTC). Additionally, in the period of 2001–2010 the measurements are more detailed, which means that hourly data were available. The applied bioclimate index was determined at these times by means of the model RayMan. (Matzarakis et al. 1999, 2007). Then hourly, daily, 10-day, monthly, seasonal, annual and 30-year averages of PET were calculated from the PET values. Based on these values bioclimate diagrams of both stations were constructed where PET ranges are depicted according to Table 1.
3. RESULTS AND DISCUSSION
3.1. Diurnal and annual variations in the periods of 1961–1990 and 1981–2010
The first part of the analysis concerns the normal periods of 1961–1990 and 1981–
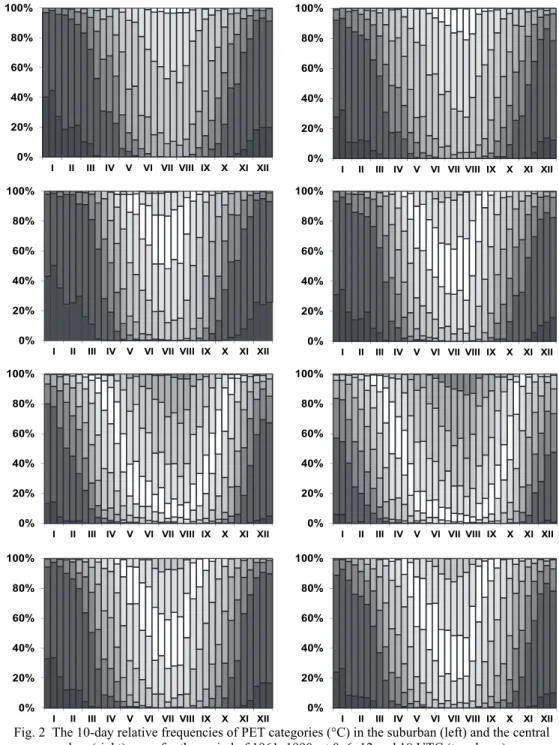
2010 when the differences detected between the measuring points as well as among the periods were investigated. The bioclimate diagrams showing the frequencies of the PET categories have 10-day intervals.
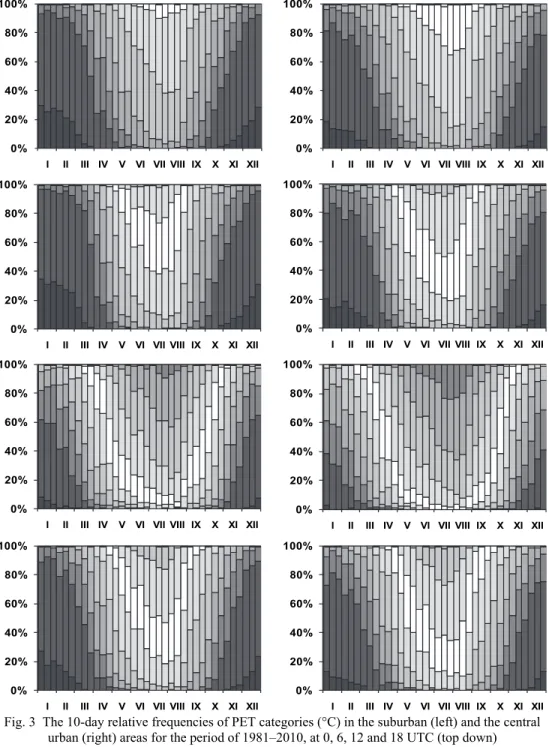
According to Figs. 2 and 3, the number of cold stress days at 0 UTC in the period of 1961–1990 is less by 2.5% in the centre than in the suburban area. This difference increases to 5% in the period of 1981–2010. Thus, at night the inhabitants in the central area perceive less cold stress in winter than those in the suburbs. However, the heat load increased in the city centre in summer and therefore the people are generally less able to regenerate during the night. In mid-summer already the slightly warm heat stress category appears there in the second period (1981–2010). Presumably, the difference between the bioclimatic conditions of the measuring points is a consequence of the well developed urban heat island.
The tendency of differences between the stations is similar also at 6 UTC. In the two periods, the frequency of the warm stress is higher in the centre by 4.4% and 5.8%, respectively. For example in the summer mornings the relative frequency of moderate heat stress is around 10% in the city, while it is minimal in the suburbs.
In the early afternoon period (12 UTC) the city centre shows also a high heat load during the summer months, which means 8.8% and 10.3% higher frequencies in the two 30- year periods, respectively. The combined frequencies of the two most extreme thermal sensation categories (very hot and hot) are also higher here by 5.4% and 7.5%, respectively.
Therefore, the everyday outdoor work can be adversely affected during the summer months in the city centre. Nevertheless, it is favourable to city dwellers that the cold stress is lower by 7.6% than in the suburbs, which further declines by 1% in the later period.
At 18 UTC a similar tendency can be observed but the difference is much smaller than in the mid-day period. At this time, the warm stress in the examined periods is higher by 3.3% and 4.4% in the centre, but the cold stress is lower by 5.1% and 6.3%. In summer, the evening relaxation or ventilation opportunity may be limited in the city which can have extremely negative effects on the human body. It should not be ignored that the relaxation may be even less effective in the high heat capacity, poorly ventilated homes (e.g. block of flats). Here much more unfavourable conditions can develop than outdoors.
In summary, at every time the city centre is affected by higher heat load and less cold stress with the largest differences found in early afternoon, even when the strongest heat stress prevails in summer and outdoor activities are really significant. The smallest differences appear in the evening and at night. Furthermore, according to the relative
frequencies of PET categories an increasing tendency of warm stress can be observed in all cases during the investigated 20-year shift (Figs. 2 and 3).
0%
20%
40%
60%
80%
100%
I II III IV V VI VII VIII IX X XI XII 0%
20%
40%
60%
80%
100%
I II III IV V VI VII VIII IX X XI XII
0%
20%
40%
60%
80%
100%
I II III IV V VI VII VIII IX X XI XII 0%
20%
40%
60%
80%
100%
I II III IV V VI VII VIII IX X XI XII 0%
20%
40%
60%
80%
100%
I II III IV V VI VII VIII IX X XI XII 0%
20%
40%
60%
80%
100%
I II III IV V VI VII VIII IX X XI XII
0%
20%
40%
60%
80%
100%
I II III IV V VI VII VIII IX X XI XII 0%
20%
40%
60%
80%
100%
I II III IV V VI VII VIII IX X XI XII
Fig. 2 The 10-day relative frequencies of PET categories (°C) in the suburban (left) and the central urban (right) areas for the period of 1961–1990, at 0, 6, 12 and 18 UTC (top down)
0%
20%
40%
60%
80%
100%
I II III IV V VI VII VIII IX X XI XII
0%
20%
40%
60%
80%
100%
I II III IV V VI VII VIII IX X XI XII 0%
20%
40%
60%
80%
100%
I II III IV V VI VII VIII IX X XI XII
0%
20%
40%
60%
80%
100%
I II III IV V VI VII VIII IX X XI XII 0%
20%
40%
60%
80%
100%
I II III IV V VI VII VIII IX X XI XII
0%
20%
40%
60%
80%
100%
I II III IV V VI VII VIII IX X XI XII 0%
20%
40%
60%
80%
100%
I II III IV V VI VII VIII IX X XI XII
0%
20%
40%
60%
80%
100%
I II III IV V VI VII VIII IX X XI XII
Fig. 3 The 10-day relative frequencies of PET categories (°C) in the suburban (left) and the central urban (right) areas for the period of 1981–2010, at 0, 6, 12 and 18 UTC (top down)
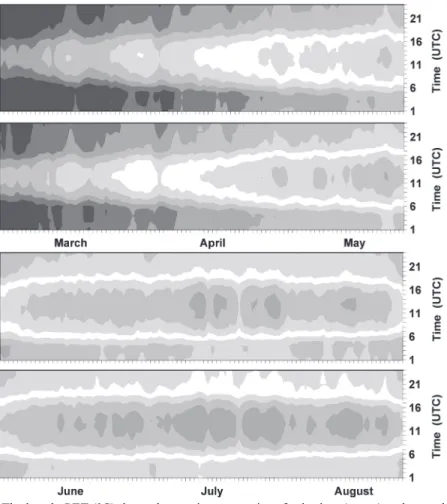
3.2. Hourly and seasonal variations in the period of 2001–2010
The characteristics of the intra-day changes of thermal comfort by seasons in the 2001–2010 period are analyzed in detail based on the hourly PET values. We considered the distribution of PET averages by days and hours (Figs. 4 and 5).
During the whole ten-year period, the average PET values are higher by 3°C in the city centre. The maximum PET is only slightly higher (0.9°C) here but the difference in the minimum value is much higher, about 5°C. Generally, at a given time a greater degree of hot stress and less cold stress can be observed in the centre by a PET category.
In late spring (Fig. 4), the city centre already has a significant ratio of warm sensation category and also the hot category appears, while in the suburbs the ratio of warm load is low. In summer, the hot stress becomes dominant at noon in the centre (Fig. 4).
(Short decreases of the PET values observable in a few days’ time can be related to weather fronts.) It should be noted that in summer evenings the warm stress decreases remarkably slowly in the centre keeping nights warmer than in the suburbs.
Fig. 4 The hourly PET (°C) thermal sensation categories of suburban (upper) and central urban (lower) areas by seasons (spring and summer) for the period of 2001–2010
Fig. 5 The hourly PET (°C) thermal sensation categories of suburban area (upper) and central urban (lower) areas by seasons (autumn and winter) for the period of 2001–2010
In early autumn (Fig. 5), the warm category is already missing in the daytime and by the end of autumn the frosty (extreme cold stress) category becomes prevalent in the suburbs (except at noon). According to the ten-year average, the extreme cold stress is dominant in both areas in winter (Fig. 5), but during daytime the people in the city are affected by smaller cold stress. This may have a positive impact on the thermal comfort here.
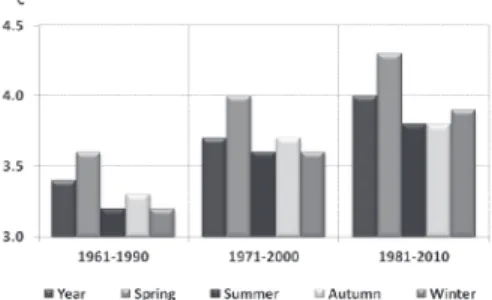
3.3. Tendencies in the 30-year periods shifted by 10 years
We examined the annual and seasonal PET averages of the three climate normal periods (1961–1990, 1971–2000 and 1981–2010) by observation times in order to detect any changes in the differences between the two stations.
According to the obtained values, higher PET values occur in the centre in each period and all seasons, which is consistent with the previous results. The highest difference (~ 4°C) can be seen at noon in spring (Fig. 6), while the lowest (~ 2°C) can be observed at
18 UTC, in the same season. During the sequence of the shifted 30-year periods an increase in the centre-suburban difference can be detected in all observation times and seasons.
An additional characteristic is also noticeable (not shown): for the last 30-year period the average of PET increased slightly in both stations and each time in winter, or even decreased at 0 UTC in the suburbs. In order to find an explanation for this, we analyzed the 30-year averages of some input variables of PET (air temperature, relative humidity and wind speed). We found that the air temperature may cause this trend, because the mean temperatures are smaller at both station in the third 30-year period than in the earlier ones.
Fig. 6 Differences between city centre and suburban values of annual and seasonal averages of PET at 12 UTC
4. CONCLUSION
This study investigated the differences and changes of the human thermal comfort conditions in the last half century by comparing measurements of two meteorological stations located in different environments of Budapest. In the capital of Hungary only a limited number of bioclimatological investigations have been performed until now.
The following main conclusions can be drawn concerning the features, differences and tendencies of human comfort conditions characterized by the frequently used bioclimate index PET.
− According to the diurnal and annual PET variations in the periods of 1961–1990 and 1981–2010, the main features of the bioclimatic differences of measuring points are the same in all four characteristic observation times: the heat load is stronger and the cold stress level is less in the city centre than in the suburbs. The largest differences appear in the daytime period, while the smallest in the evening and at night. The detected trends between the two presented normal periods indicate that warm stress has become more common while cold heat load decreased in both stations at each examined time.
Their effect on human comfort can be either advantageous or disadvantageous, depending on the season.
− As the hourly and seasonal variations in the period of 2001–2010 show, in general the central area is influenced by a higher degree of hot stress and less cold stress by a category of PET. The warmer nights detected in the centre in summer can affect the thermal comfort conditions particularly adversely.
− In terms of the annual and seasonal averages of PET in the three normal periods shifted by 10 years, there are higher values unambiguously in the centre and an increase in the centre-suburban difference can be detected at all observation times in all seasons.
The presumed reason for the received bioclimatic differences and tendencies is the fact that the intensifying built-up ratio and the detected global warming in the last decades together strengthened the urban heat island effect in the central areas, while in the suburbs, rather only the climate change may play a role in the detected increasing trend.
In relation to the obtained results it should not be ignored that the location of the central station in Budapest is not really ideal for urban climatological research. However, sufficiently long data series, which are necessary for analysing the urban climate and bioclimate, are not available. Therefore, in the near future, it is necessary to establish a few meteorological stations at street-level in the urban area, which would represent the different Local Climate Zones, which occur in Budapest better.
Acknowledgements: The publication is supported by the European Union and co-funded by the European Social Fund. Project title: “Broadening the knowledge base and supporting the long term professional sustainability of the Research University Centre of Excellence at the University of Szeged by ensuring the rising generation of excellent scientists.” Project number: TÁMOP-4.2.2/B-10/1-2010-0012. The authors’ thank to János Unger for his comments and suggestions at the preparation stage of the manuscript.
REFERENCES
Ambrózy P, Bihari Z, Kövér Z, Lakatos M, Nagy-Kovács E, Németh Á (eds) (2006) Climate data series 1901- 2000 (Budapest). Hungarian Meteorological Service, Budapest; CD-publication
Égerházi L, Kántor N (2011) Area usage of two outdoor public places with regard to the thermal conditions − observation-based human thermal comfort study in the centre of Szeged. Acta Climatol Univ Szegediensis 44-45:73-81
Gulyás Á, Unger J, Matzarakis A (2006) Assessment of the microclimatic and thermal comfort conditions in a complex urban environment: modelling and measurements. Build Environ 41:1713-1722 Gulyás Á, Matzarakis A, Unger J (2010) Comparison of the urban-rural comfort sensation in a city with warm
continental climate. Berichte des Meteorologischen Instituts der Albert-Ludwigs-Universität Freiburg 20:473-478
Höppe P (1999) The physiological equivalent temperature – a universal index for the biometeorological assessment of the thermal environment. Int J Biometeorol 43:71-75
Kántor N, Gulyás Á (2010) Area usage and thermal sensation vs. thermal comfort conditions – open air thermal comfort project in Szeged, Hungary. Berichte des Meteorologischen Instituts der Albert-Ludwigs- Universität Freiburg 20:504-509
Kántor N, Unger J (2010) Benefits and opportunities of adapting GIS in thermal comfort studies in resting places:
An urban park as an example. Landscape Urban Plan 98:36-46
Kuttler W (1998) Stadtklima. In: Sukopp H, Wittig R (eds) Stadtökologie. Gustav Fischer, Stuttgart–Jena–
Lübeck–Ulm. 125-167
Matzarakis A, Mayer H (1996) Another kind of environmental stress: Thermal stress. WHO Newsletter 18:7-10 Matzarakis A, Mayer H, Iziomon MG (1999) Applications of a universal thermal index: physiological equivalent
temperature. Int J Biometeorol 43:76-84
Matzarakis A, Rutz F, Mayer H (2007) Modelling radiation fluxes in simple and complex environments – application of the RayMan model. Int J Biometeorol 51:323-334
Németh Á (2011) Changing thermal bioclimate in some Hungarian cities. Acta Climatol Univ Szegediensis 44-45:93-101
Stewart ID, Oke TR (2012) ‘Local Climate Zones’ for urban temperature studies. Bull American Meteorol Soc 93:1879-1900
Unger J (1999) Comparisons of urban and rural bioclimatological conditions in the case of Central-European city.
Int J Biometeorol 43:139-144