Chapter I
EMISSION FROM GASEOUS DISCHARGES
1. EXCITATION OF SPECTRA
The spectra of monoatomic gases consist of separate spectral lines. These appear when the atom p a s s e s from a higher to a lower energy level.
In spectroscopy the atomic energy levels are frequently plotted as horizontal straight lines, each line representing a different level, with the energy of the atom in its ground state taken as the zero reading. The energy levels are usually given in electron volts and the frequencies in reciprocal centimeters. The simplest energy level diagram, that for the hydrogen atom, is shown in Fig. 1. The diagrams for other elements are far m o r e complex.
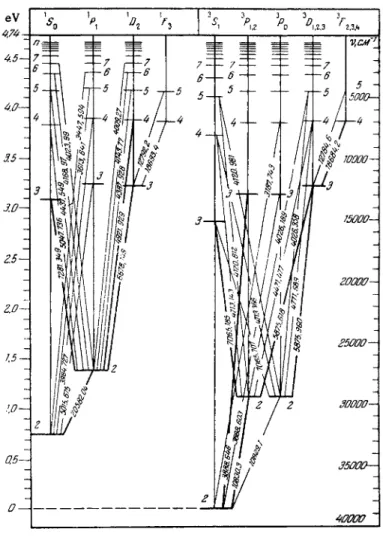
Thus, Fig. 2 shows the singlet and triplet energy levels of the helium atom.
Wavelength tables and special atlases [ 5 - 9 ] have been compiled to facilitate spectra identification. Energy level graphs for various elements, or data from which such charts can be plotted, may be found in multiplet tables [ 1 0 - 1 4 ] .
In the conventional classification adopted in spectroscopy, an energy level is identified by the quantum numbers that specify
1
2 EMISSION FROM GASEOUS DISCHARGES
it [ 1 5 - 1 9 ] . A spectral line, corresponding to a transition between levels, is denoted by two groups of symbols, the first relating to the lower and the second to the upper energy level. Thus, the helium line with λ = 3888.6 A is identified as ls2s3Sl — Is3p3P2*
eV 13.53 -
13 72 77 70 9 δ 7 6 5
3 2 7 σ
oo , η 4 · 5-
ai
νΛ cm-
II!
ao3 «
CQ
Balmer Series &Λ
2
3ÜODO-
^ ^ ^ ^ ^
FIG. 1. Energy level diagram for the hydrogen atom.
Not every transition between levels is possible since the allowed transitions are limited by selection rules. Thus the
EXCITATION OF S P E C T R A 3
FIG. 2. Energy level diagram for the helium atom.
than other states. While the average life of a radiating level is 10"8 seconds, those of metastable levels may be of the order of 10"1 seconds.
helium atom (see Fig. 2) cannot exhibit transitions from the l 5 2 s,S0 and ls2s3Si states to a lower level. States from which a transition to a lower energy state is forbidden by selection rules are called metastable. A metastable state has a longer lifetime
4 EMISSION FROM GASEOUS DISCHARGES
Under ordinary conditions, the return of an atom from a meta- stable to a ground (normal) level may occur in one of two ways:
1) an atom, colliding with an electron, is raised to an excited state, from which it can pass to the ground state, the transition being accompanied by radiation; or 2) the excited atom transfers its energy to another atom (collisions of the second kind) and is reduced to the ground state without emission of radiation.
The spectra of other inert g a s e s (neon, argon, krypton, xenon) are structually more complex than that of helium. This is due to the greater number of electrons in the outer shells of these atoms;
thus, each outer shell contains two 5 electrons and six ρ electrons.
An energy level diagram for the neon atom is shown in Fig. 3 . Its ground level— I s2 2s2p6S0—is very low. Lying considerably higher (by 1 6 . 5 - 1 6 . 8 e V ) are the closely spaced 3/)2 , 3Ρ ι , 3P0 and lP\
levels which correspond to the electron configuration ls22s22p53s.
Two of these states, 3P0 and 3^ 2 , are metastable. A s the neon atom returns from levels 3Λ and lP\ to the ground state lS0 it emits two resonance lines in the far UV region with λ = 744 and 736 Â, respectively. Above these 2p33s levels is located a group of ten states in the energy range of 1 8 . 3 - 1 8 . 9 e V . In the Russell- Saunders chart these levels are designated as 3S]9 3D3, 3D2, 3Dl9
lD2, lPi, 3P2, 3P0. 3Pi and 'S0 (electron configuration I s2 2s2 2p53p).
The transition from these levels to lower ones produces a group of high-intensity lines observed in both emission and absorption spectra of neon excited in a gaseous discharge. On the other hand, the transition of the neon atom from higher states to the levels associated with this l s22 s22 pb3 p configuration produces lines in the infrared, red and orange regions of the spectrum. The neon ionization potential is 21.6 V . The other inert gases (argon, krypton and xenon) exhibit similar spectra. The greater the molecular weight of the inert gas, the c l o s e r the various energy
EXCITATION OF S P E C T R A 5 levels and the m o r e marked the displacement of the entire spectrum toward long wavelengths (see, for example, Fig. 4 ) .
Molecular spectra may also used in analyzing gas mixtures [16, 1 9 ] . Thus, diatomic and polyatomic molecules produce band spectra and gas analysis is usually based on the intensities of band edges, whose wavelengths are known for most g a s e s and can be looked up in reference books [ 2 0 ] . Photographs of spectra of the inert g a s e s and some molecular gases are given in Appendix VI.
The analysis of gas mixtures may employ both emission and absorption spectra.
The excitation of an atom [21-25] requires an energy greater than or equal to the excitation energy of a given level. This energy can be supplied to the atom by 1) conversion of the kinetic energy of electrons, ions or atoms impinging on the atom to excitation energy; 2) absorption of light quanta; 3) collisions of the second kind, that is, radiationless transfer of excitation energy from other atoms. In the last c a s e , the efficiency of transfer is highest if the energy given up by the donor atom approaches the excitation energy of the given state of the recipient atom.
Let us now consider the first of the above methods of excitation, assuming an electron to be the impinging particle. Such collisions may be either 1) elastic, with the electron recoiling and almost no transfer of electron energy to the atom (the energy is distributed between the colliding particles in proportion to their m a s s e s ) ; or 2) inelastic, with the electron transferring some or all of its energy to the atom, as a result of which the atom b e c o m e s excited.
An electron—atom collision can become inelastic only if the e l e c - tron p o s s e s s e s sufficient energy to raise the atom to an excited state at least one level higher than the ground state. Not all collisions will produce excitation, however—not even all those that involve
6 EMISSION FROM GASEOUS DISCHARGES
electrons with sufficient excitation energy. This is because there is a definite probability of energy transfer on collision. The probability of excitation is expressed as the ratio of the number of inelastic collisions to the total number of collisions with elec- trons of a given velocity. It should be noted at this point that an electron—atom collision should not be regarded as a mechanical collision of two bodies; consequently, the number of collisions between the electron and the atom will be determined not by the dimensions of the latter (as given by the kinetic theory of gases) but by the effective cross section of the atom Q = TZR2 , where R9
the range of action of the atom, is the maximum distance (from the center) at which the electron is still able to transfer its kinetic energy to the atom.
The dependence of the effective c r o s s section of the atom on the velocity of the impinging electrons may be expressed by the excitation function. W e distinguish between the level excitation function^ which describes the dependence of the effective c r o s s
section on the electron velocity relative to the excitation of a given level, and the spectral line excitation function (the optical excitation function), which expresses the dependence of the effec- tive c r o s s section on the electron velocity relative to the excitation of a given line. The spectral line excitation function differs from the level excitation function in c a s e s where successive transitions are of importance, i.e., in c a s e s when the atom undergoes transi- tions from all the higher states to a given level.
An exhaustive discussion of the phenomena associated with electronic and ionic phenomena will be found in the book by Massey and Bur hop [ 2 6 ] .
Because of the experimental difficulties involved, excitation functions have been determined only for a few elements. They were most extensively investigated for helium [ 2 7 - 3 1 ] , mercury
EXCITATION OF S P E C T R A 7
024 26 30 40 60 !60 720 Voltage, V a)
Ο24 26 40 60 80 WO I20 Voltage, V b)
FIG. 5. Excitation functions of singlet (a) and triplet (b) helium lines. 1-λ4921 Â , 2-Λ4388 Â , 3-Λ4143 Â , 4-Λ4713 Â , 5—
X4121Â
Figure 5 shows excitation functions of five helium lines [ 2 7 ] . The shape of the function is determined by specific characteristics of a given energy level such as its multiplicity. If the electron velocities are lower than those corresponding to the level excita- tion potential, the effective c r o s s section is z e r o , since electronic impacts will be limited to elastic collisions. An increase in these velocities is reflected in a rapidly increasing excitation function, whose maximum lies at an electron velocity somewhat greater than that corresponding to the excitation potential of a given level.
[32, 33] and neon [34, 3 5 ] . Most of the existing measurements are relative, with few absolute values available.
Schaffernicht [32], F r i s c h and Zapesochniy [33], and Smit and Jongerius [36] obtained excitation functions with two or more peak values. It was shown that in most c a s e s additional maxima e m e r g e as a result of successive transitions [ 3 3 ] . In s o m e instances secondary maxima also appear in the excitation functions of individual levels [ 2 7 ] .
Excitation function maxima, as demonstrated by many inves- tigators, are sharper for triplet than for singlet lines, and are located near the excitation potential. Single line maxima are shifted toward high velocities.
8 EMISSION FROM GASEOUS DISCHARGES
The difference in behavior of the singlet and triplet excitation functions accounts for variations in the intensity ratio of two spectral lines of different multiplicity when the pressure is changed. The gas pressure determines the energy of the electrons.
The energy level is high at low pressure, and therefore singlet lines predominate. High pressures mean relatively low electron velocities; hence triplet lines predominate since their maxima lie at lower electron velocities.
A number of approximations for description of the behavior of the excitation function are available. Thus, Fabrikant suggested the following empirical expression [ 3 7 , 3 8 ] :
Q, = Q ( V J - ^ e 1 - ^ (Li)
m A
where Q(VM) is the peak value of the excitation function, QV is its value corresponding to a given energy level of the electron, VA is the excitation potential, and VM is the value of the potential c o r - responding to the peak value of the function. All the quantities appearing on the right side of Eq. (1.1) can be determined experi- mentally. Equation (1.1) correctly describes the behavior of an excitation function near the maximum for both singlet and triplet levels. Significant deviations appear only beyond the peak of the excitation curve.
A closer agreement with experimental values is given by the equation
v-v
, A__
V—V. V-V _ / I o\
Qv = Q(Vm) ν _ κ e m A+Q°°> ) ( 1 , 2
m A
where the term Q«, is a constant [ 3 9 ] .
If the values of the excitation function are known, then the absolute intensity of a spectral line can be calculated from
EXCITATION OF SPECTRA 9 Eqs. (1.1) and (1.2). These expressions can then also be used
to identify the specific factors affecting line intensity [37, 39, 4 0 ] .
The shape of an excitation function often explains the variation of individual line intensities when the conditions prevailing in the discharge are changed. Thus in studies of pulse discharges by the method of time-resolved spectra the variation of intensity of a spectral line with time r e s e m b l e s its excitation function [41];
this is because the electron temperature (and hence the average electron velocity) varies during the pulse interval. For that reason the time resolution of a spectrum shows the intensity variation of a spectral line as a function of the electron velocity. In effect, we shall obtain an excitation function provided the electron beam is not monochromatic.
For analytical purposes the single lines, with their character- istic broad peak excitation functions, are most useful [42].
While it is now possible to calculate the effective cross sections of excitation for the simpler atoms [ 4 4 - 4 6 ] , a satisfactory agree- ment between theory and experiment is not always attained.
The excitation function of an atom is not only affected by colli- sions with electrons, but also by collisions with ions [47]. While ionization and excitation brought about by collisions of the atom with ions are observed only at high velocities (most often at energies exceeding 1000 e V ) , partial ionization of atoms may occur at relatively low velocities [48]. Several papers report on spectra obtained by excitation with α-particles [49, 5 0 ] .
It is also necessary to know the ionization function, i.e., the dependence of the ionization c r o s s section on the electron velocity.
The probabilities of ionization of various inert gases were r e - ported in [43]. Ionization functions increase with electron velocities over the energy range of 100 to 150 e V , and then gradually decline.
10 EMISSION FROM GASEOUS S P E C T R A
The excitation functions for ionic energy levels are similar to those representing energy states of the atom. Ionic lines form the so-called spark spectrum, while atomic lines constitute the arc spectrum of an element.*
Spectral lines are produced not only by singly ionized atoms, but also by those which are multiply ionized. The energies r e - quired to obtain spectra of the latter [51, 52] are high and the spectra usually appear in pulse discharges.
Spectral lines are associated not only with direct excitation of atoms, but also with secondary p r o c e s s e s such as stepwise excita- tion and collisions of the second kind. An excited atom may revert to its ground state (or undergo transition to a lower level) without emitting light provided it can transfer its excitation energy to an electron or another particle present during the discharge. Step- wise excitation, on the other hand, r a i s e s the excited atom to a still higher energy state. This is possible because the atom r e - mains in an excited state for a finite time and thus may eventually undergo an inelastic collision with an electron, as a result of which it is raised to a state of higher excitation. Thus, the atom may store energy via several successive collisions with electrons.
Stepwise excitation is sometimes quite important even though the probability of a collision between an excited atom and an electron is low. This is because stepwise excitation is favored by the presence of metastable atoms and diffusion of resonance radia- tion.** The theory of diffusion of resonance radiation was developed by Compton [53, 54] and refined by Biberman[55] and Holstein [ 5 6 ] .
An excited atom will emit, on the average, one photon over its lifetime τ (prior to reverting to its ground state). This photon
* These names reflect the fact that ionic lines are excited primarily in a spark discharge and atomic lines in an arc.
**Resonance radiation is that accompanying transitions from the first excited level to the ground state.
EXCITATION OF S P E C T R A 11 may be absorbed by another atom in the discharge and will raise
that atom to an excited state. The second atom will reradiate the photon upon reversion to ground state and may in turn excite a third atom, etc. The photon (or quantum of light) will thus be transferred from one atom to another. A s a result, even though each individual atom remains in an excited state for only a short t i m e , the probability that s o m e excited atom will collide with an electron increases as if the life of the excited state of an individual atom were extended.
It was shown in theory and confirmed by experiment that in many instances a stepwise transition is m o r e likely than a direct one [ 5 7 - 6 0 ] . *
Stepwise excitation is a major factor in generation of spark spectra. Direct excitation of spark lines is possible only at high electron velocities (e.g., at low p r e s s u r e s ) [62], since the kinetic energy of the impinging electron must be greater than the c o m - bined ionization and excitation energies of a givel level. Stepwise excitation of spark lines, on the other hand, is possible at low electron velocities. The energy of the electrons need only be sufficient to excite an atom. Then, on its second collision, the e x - cited atom becomes ionized, while the third collision results in the appearance of an excited ion. However, stepwise excitation r e - quires a high concentration of electrons [ 6 3 ] .
Emission p r o c e s s e s , as seen from the above discussion, are closely related to the life of excited atoms: the probability of s e c - ondary p r o c e s s e s increases with the lifetime of an excited atom.
Hence the importance of metastable atoms, for which the p r o b - ability of stepwise ionization or collisions of the second kind is higher than for transitions accompanied by emission of light.
* Absolute values of effective cross sections for the stepwise excitation of neon are given by Frisch and Rewald [61],
12 EMISSION FROM GASEOUS S P E C T R A
The life of a metastable state depends strongly on the electron concentration and the presence of impurities whose excitation potentials are close to the excitation energy of the metastable level [ 6 4 ] . The metastable atoms can transfer their energy by collision with the atoms of the impurity, the overall result being a shorter lifetime of the metastable level.
The presence and the number of metastable atoms determine the conditions under which a self-sustaining discharge can occur.
Thus, when the discharge gap is illuminated by an outside source, or specific (and effective) admixtures are added to the gas, the number of metastable atoms decreases drastically and the dis- charge firing potential increases [ 6 5 - 6 8 ] .
The various processes occurring in the light source (excitation as well as annihilation of the excited atoms) finally result in a fixed concentration of excited atoms and ions within that source.
This, in addition to other factors, determines the intensities of the spectral lines.
Another essential factor influencing the line intensity is re- absorption. The term refers to the fact that the radiation emitted by one volume element of the light source is reabsorbed to some extent in the other regions of the source prior to being radiated to the outside.
2. BASIC CHARACTERISTICS OF GASEOUS DISCHARGE The occurrence of processes in a discharge arc is determined by the concentrations of electrons, ground-state and excited atoms, and the particle velocity distribution. The mixture of electrons, ions and atoms present in the gas discharge gap f o r m s the s o - called plasma. Plasma may be isothermal and nonisothermal.
An isothermal plasma exists in a state approaching thermo- dynamic equilibrium. It has a characteristic temperature Τ which
BASIC C H A R A C T E R I S T I C S OF GASEOUS DISCHARGE 13 determines the degree of ionization of the plasma material (the
ion and electron concentration), the particle velocity distribution, and the distribution of particles over energy levels. These dis- tributions are found from the familiar statistical equations of Saha, Maxwell and Boltzmann, and the temperature Τ appears in each of these expressions.
The average kinetic energy of electrons, ions and atoms is the s a m e , and consequently the electron gas temperature is the same as that of gas itself. Such equilibrium can be attained at relatively high p r e s s u r e s , i.e., under conditions associated with a large number of collisions per unit time and an intensive energy exchange.
One example of an isothermal plasma is an arc and spark gen- erated at atmospheric p r e s s u r e . Thermodynamic equilibrium, however, will not always establish itself even at this pressure level. For instance, it is not reached in arcs struck in inert gases [69, 7 0 ] .
In a nonisothermal plasma, atoms, electrons and ions are all at different energy levels.
Electron temperature and electron concentration
The average kinetic energy of plasma electrons can be related to a specific temperature, generally referred to as the electron temperature (Te). The term is merely a convention since thermo- dynamic equilibrium does not exist in a nonisothermal plasma and therefore the concept of temperature, in the accepted sense, b e - c o m e s meaningless.
Electrons, as a rule, have greater energies than the average energy of the heavier particles. The reason for this is that elec- trons involved in elastic collisions with the heavy particles (atoms or ions) are able to transfer to the latter only an insignificant fraction of their energy, the difference in m a s s between the
14 EMISSION FROM GASEOUS DISCHARGES
colliding particles being very large. Substantial energy transfers are possible only in the case of inelastic collisions, which account for only a minor fraction of the total number of collisions.
The electron temperature in the positive column (see p. 33) may be as high as a few hundred thousand degrees; the ion tem- perature does not exceed 1 5 0 0 - 2 0 0 0 ° K ; and the average gas tem- perature is of the order of 5 0 0 - 1 0 0 0 ° K .
The electron velocity distribution patterns obtained in numerous experiments tend to follow closely the Maxwellian distribution curve [71, 7 2 ] . At the same time, marked departures from this law were noted even at low pressures and weak currents [73, 74, 74a]. Such deviations are of particular importance in studying spectral line intensities, since excitation is largely associated with the tail portion of the Maxwellian curve (inelastic collisions).
In the case where the distribution of electron velocities follows Maxwell's law the electron temperature is the basic parameter of the discharge, controlling the conditions for the excitation of the spectrum, i.e., the spectral line intensities.
The other characteristic of the discharge which is of great importance is the electron concentration (ne). It determines the number of exciting collisions, along with the probability of step- wise ionization and excitation p r o c e s s e s .
Both electron temperature and electron concentration can be determined using the classic probe method developed by Langmuir [21, 22, 7 1 ] . The conditions necessary for the application of this method are discussed at length by KlyarfePd [75],
At the present time, there exist various modifications of the probe method. Thus, a two-probe procedure has been developed [ 7 6 - 7 8 ] . Another recent technique exploits the ionic portion of the discharge characteristic [79]. In still another modification the probe data are recorded oscillographically [74, 8 0 ] .
BASIC C H A R A C T E R I S T I C S OF GASEOUS DISCHARGE 15 By means of probes, ignited with the aid of a high-power sweep
oscillator, correct characteristics can be obtained within a short time [81, 8 2 ] . A procedure using a high-frequency resonance probe [83] is employed to obtain instantaneous values of electron concentration in unstable discharges. The probe method has found further application in studies of high-frequency discharges [ 8 4 - 8 7 ] . The electron temperature can also be measured by the noise method. Temperature measurements based on the probe and noise methods show good agreement.
Interferometric procedures [88, 89] are also effective in de- termining electron concentrations. These techniques, based on the fact that the refractive index of a plasma depends on the degree of ionization, are used in studies of pulse discharges to follow changes in electron concentration with time, as well as changes in the con- centration gradient along the c r o s s section of the tube.
Effect of discharge parameters on electron temperature
The electron temperature is a function of the current in the discharge gap [75, 9 0 - 9 5 ] , the pressure [75, 9 2 , 9 6 - 9 9 ] , the dis- charge tube diameter [ 9 1 , 9 2 ] , and the composition of the lumines- cent mixture [75, 1 0 0 - 1 0 4 ] . Most of the references describe studies of discharges in pure g a s e s .
The electron temperature drops with an increase in pressure because this produces a shorter mean free path. In consequence, an electron loses larger quantities of energy on collision and is unable to store much energy before such collisions. Electrons move slowly at high p r e s s u r e s . A s the pressure increases, the electron temperature approaches the (kinetic) temperature of the gas and may be identical to it (isothermal plasma).
In molecular gases the electron temperature decreases with increasing pressure not only because the mean free path is
16 EMISSION FROM GASEOUS DISCHARGES
Argon concentration, % 0 0.005 0.01 0.05 0.1 1
Te, eV 3.2 3.16 3.11 3.07 2.95 2.43
Thus the discharge conditions in a gas mixture vary when the concentration of the easily excitable component is altered. How- ever, addition of argon to neon will not necessarily decrease the electron temperature. Thus Penkin [106] reported that the addition reduced, but also because of changes in the degree of molecular dissociation. For dissociated molecules the ionization probability can be higher or lower than that for undissociated molecules.
Dissociation may therefore cause an increase or a decrease in the value of Te [ 9 8 ] ,
The electron temperature, as a rule, gradually decreases with an increase in the strength of the current. The effect is particularly marked at high p r e s s u r e s , i.e., under conditions where stepwise ionization b e c o m e s a major factor.
The electron temperature also depends on the diameter of the discharge tube, because an increase in the diameter causes a decrease in the potential gradient, and at constant pressures the electron temperature may be assumed roughly proportional to the potential gradient [105]. In s m a l l - b o r e capillaries the electron temperature may increase with the current due to rarefaction of the gas [94, 9 5 ] .
The electron temperature depends on the type of gas that fills the discharge tube, and, other things being equal, it is greater for gases with higher ionization potentials [ 7 5 ] . Zaytsev, Dorgelo and others have shown that the electron temperature of a gas mixture decreases with an increase in the concentration of a readily ex- citable constituent. Zaytsev [101] analyzed a mixture of neon and argon at ρ = 3 m m Hg and / = 7.5 m A and obtained the following results:
BASIC C H A R A C T E R I S T I C S OF GASEOUS DISCHARGE 17 of 0.5% argon to neon did not materially alter the electron tem-
perature of a discharge proceeding at a pressure of 0.9 m m Hg and a current of 60 m A.
The data of Zaytsev and Penkin can be made to agree if we consider that the significance of additional ionization introduced by the atoms of the admixture increases as the — ratio de-
J ρ
c r e a s e s (E is electric field strength; ρ is p r e s s u r e ) . This is
£
because at large — the degree of ionization of a pure gas is already sufficiently high without additives [107], W e see that in Penkin's experiments the — was more than an order of magnitude higher than in those of Zaytsev.
The electron temperature was markedly lowered when small amounts of krypton and xenon were added to neon [106]. The addition of a readily ionizable admixture reduced the number of ions of the species that is difficult to ionize [108], but the total number of ions increased due to collisions of the second kind and ionization of the admixed atoms by electron impact. Because of this additional ionization, the discharge could be sustained at a lower electron temperature.
A small amount of an admixture with an ionization potential higher than that of the basic component of the mixture does not materially alter the ionization conditions so that the electron temperature remains approximately constant. In gas mixtures exhibiting separation of the components (see Section 4 ) , the e l e c - tron temperature decreases along the positive column from the anode to the cathode. The component which is difficult to ionize glows primarily near the anode [103, 1 0 4 ] .
Effect of discharge parameters on electron concentration
The electron concentration depends on the current density and electron temperature:
18 EMISSION FROM GASEOUS DISCHARGES
η€ = Α ψ = (1.3)
where A is a constant, / is the current density, and Β is the bypass factor.
The validity of this equation was tested by Klyarfel'd [ 7 5 ] . The bypass factor is the ratio of the electron path length to the dis - placement of this path in the direction of the field. The value of this factor is determined by the ratio of the densities of the random and directed electron currents. Klyarfel'd demonstrated experi- mentally that Β increases with pressure at constant current and that the electron concentration also increases with pressure due, first, to the increase of Β and, second, to decreased electron temperature. It further follows from Eq. (1.3) that the electron concentration increases more rapidly than does the current density, since the bypass factor increases, and the electron temperature decreases, with increasing current density. The linear relation- ship between current and electron concentration thus holds only to a first approximation, whereby the bypass factor and electron temperature variations are not taken into consideration.
Concentration of excited atoms and methods of determining it
The spectral line intensity depends on the concentration of excited atoms in the discharge. If no secondary processes are involved, the spectral line intensity is directly proportional to the concentration of atoms in the upper excitation level. The concen- tration of excited atoms in the lower level determines the value of reabsorption. The concentration of excited atoms determines the probability of collisions of the second kind and of stepwise transitions on excitation and ionization. Hence, the knowledge of concentration of excited atoms in the discharge is absolutely
BASIC C H A R A C T E R I S T I C S OF GASEOUS DISCHARGE 19 necessary for understanding of the emission mechanism. Various
methods are available for determing this concentration.
1. The "hook" method of Rozhdestvenskiy [109, 1 1 0 ] . This procedure determines interferometrically the dependence of the refractive index on the wavelength in the neighborhood of the ab- sorption line. This is the most accurate and reliable technique for determining the concentration of excited atoms, and has been repeatedly used for determining the concentration of excited atoms in vapors of metals and in inert gases [ 1 1 1 - 1 1 5 ] .
2. The absorption method [24, 1 1 6 - 1 1 9 ] . The classic version of this method uses two identical discharge tubes, and measures the fractional intensity of the light from one tube after passage through the other. The concentration of excited atoms is then determined from the measured value of the absorption coefficient [24, 1 1 7 ] . This concentration can also be measured in those cases where the discharge conditions in the emitting and the absorbing tubes are not the s a m e . It is then necessary to analyze the emission and absorption line patterns, and on this basis to determine the relationship between the absorption coefficient and the concentration of excited atoms. The problem thus becomes more complicated and can be solved only if precise data on both patterns are available.
3. The reabsorption method [37, 4 0 , 1 2 0 - 1 2 6 ] . The electron population in any given level is determined by measuring the ratio of intensities of a given spectral line in two sectors of the luminous column. If the spectrograph is operated at full transmission capacity and no reabsorption is involved, the spectral line intensity is proportional to the length of the luminous column. The effect of reabsorption alters this relationship, which no longer depends on the ratio of the column lengths but is a single-valued function of the concentration of atoms in the lower level. A simplified variant
20 EMISSION FROM GASEOUS DISCHARGES
of this method uses a m i r r o r , which magnifies the luminous column to double its length, set behind the tube (this variant does not allow for reflection l o s s e s ) .
4 . The spectral line width method [127]. The excited atom concentration can be determined by measuring the width of a spectral line emitted by a light source possessing a finite optical density.
5. The emission method [128]. In the absence of non-radiative transitions and reabsorption of radiation, the concentration of excited atoms Nh is related to the spectral-line intensity / by the equation
/ = = A ^ > , (1.4)
where ,4V is the transition probability for a given line, h is Planck's constant, and ν is the radiation frequency.
6. The reversal temperature method [ 1 2 9 - 1 3 2 ] . In this proce- dure the discharge is transilluminated by a source with a con- tinuous spectrum, operated at a variable temperature. One then ascertains the exact moment at which the spectral line, originating on the level in which it is desired to determine, vanishes against the source background. Knowing the temperature of the source, one can then calculate the reversal temperature and compute the ratio of concentrations of the excited atoms in the initial and final levels from the Boltzmann equation. To obtain the absolute values of these concentrations it is necessary to determine independently the concentration of excited atoms in either level.
Where no thermodynamic equilibrium exists, the reversal tem- perature varies for different lines. (The term " r e v e r s a l " signifies that, for the given luminous volume and wavelength, there is a thermodynamic equilibrium between the radiant fluxes emitted by the continuous spectrum source and the source under study.) A
BASIC C H A R A C T E R I S T I C S OF GASEOUS DISCHARGE 21 simultaneous reversal of all lines and equal source and reversal
temperatures indicate that a state of thermodynamic equilibrium exists throughout the system.
The first four methods give only the product of the concentra- tion of excited atoms and the oscillator strength (Nkf). It follows that the numerical value of the concentration can be computed only if the oscillator strength is known. The last two methods are only suitable for determining the concentration of excited atoms at the radiating levels. The scope of application for each of the above procedures is given by Fabrikant [ 3 7 ] .
Effect of discharge parameters on the concentration of excited atoms
The concentration of excited atoms depends on the current [113, 1 3 3 - 1 3 7 ] . Among other things it was demonstrated that the con- centration of excited atoms may reach the saturation level at a certain current [ 1 3 3 - 1 3 7 ] . In the opinion of many authors this indicates an equilibrium between collisions of the first and second kind. Fabrikant [37] believes that the decrease of electron tem- perature with rising current is responsible for the saturation phenomenon. An increase in the current may have a twofold effect.
On the one hand, the concentration of excited atoms should in- c r e a s e . On the other hand, this concentration should decline, due to the attendant electron temperature drop. These, however, do not appear to be the only causes of saturation under the conditions investigated by Fabrikant.
An essential factor affecting the concentration of excited atoms is its dependence on the electron velocity distribution. Departures from Maxwell's distribution may not appreciably affect the char- acteristic patterns obtained with the aid of probes, since these are determined largely by electrons whose velocities lie in the
22 EMISSION FROM GASEOUS DISCHARGES
neighborhood of the maximum probability level. At the s a m e time, the levels with high critical potentials are excited primarily by particles accounted for by the tail portion of the distribution func- tion. For this reason, deviations from the Maxwellian-type e l e c - tron velocity distribution may materially alter the process of level concentration of excited atoms as a result of an increase in current density may be explained by the lower electron tempera- ture, as well as by the deviation of the velocity distribution of the perature, as well as by the deviation velocity distribution of the electrons from a Maxwellian-type curve [73, 9 9 ] .
The decrease in the electron temperature was further shown by Kagan and Penkin [113] to be responsible for the absence of a
direct linear relationship between concentrations of excited atoms and of electrons.
As the pressure increases, the concentration of excited atoms passes through a maximum, the lower energy states attaining that maximum at pressures which are lower than those necessary for the higher energy states [ 9 9 ] . The existence of a peak concentra- tion is explained by the opposing effect of a pressure r i s e . Thus, while the concentration of excited atoms tends to increase because of higher concentrations of non-excited atoms and electrons, the higher pressures also tend to reduce the electron temperature which in turn effects a decrease in the concentration of excited atoms.
In Fig. 6 the variation of the concentration of excited atoms with pressure is shown for the case of a DC discharge in mercury vapor [113]. The shape of the curve is influenced by both primary and secondary p r o c e s s e s [37]. Penkin and Shukhtin [131] and Kagan and Penkin [113] have shown that the m e r e fact that the electron velocity distribution is Maxwellian does not necessarily imply a Boltzmann distribution of atomic excitation levels. It is seen from
S P E C T R A L LINE INTENSITY 23 Fig. 6 that equilibrium in the 3^ 2 level of mercury is reached only at relatively high pressures (3·10 2 m m Hg).
Ο L _ - - H ^ «-=τ—
i(H 102 70 ~
p, mm Hg FIG, 6, Effect of pressure on the concentration of excited mercury atoms in the level.
1—Calculated curve based on the Boltzmann equation; 2—experimental curve.
At low pressures departures from equilibrium may occur even at vicinal levels. Thus, Bogdanova [138], in experiments with thallium vapor, observed an anomalous electron population in the n2Ds and n2D6_ levels. Similar deviations from statistical equi-
2" 2
librium were noted for the hyperfine-structure components [ 1 3 9 - 141].
3. S P E C T R A L LINE INTENSITY
All methods of quantitative spectral analysis are based on a comparison of the intensities of spectral lines. In spectral anal- y s i s of gases it is essential to understand the nature of the de- pendence of spectral line intensity on the current strength, the pressure and the concentration of elements in the mixture.* These
* We shall not consider such phenomena as reabsorption and collisions of the second kind, although these processes may significantly affect the excitation of a gas mixture, nor will we discuss the specific techniques used in measuring line intensities.
24 EMISSION FROM GASEOUS DISCHARGES
relationships then allow us to interpret the phenomena within the light source, since any change in discharge parameters does inevitably alter the intensities of spectral lines. The exact effects of discharge parameters on line intensities, as well as methods for calculating these intensities, are extremely complex problems which have been explored in many studies, notably those of Fabrikant [37] and Frisch [39, 4 0 , 1 4 2 ] .
Where no secondary processes are involved, the spectral line intensity is proportional to the number of excitation events ANi(ne) and to the quantum of energy Av:
/ = /CA^(/i#)Av (1.5)
where Κ is a proportionality factor that depends on the transition probability for a given spectral line.
In the absence of stepwise excitation, the number of excitation events can be calculated from
OO
àNi(ne) = neN0 f Qoi(V)F(V)VVdV; ί1·6)
V0i
where N0 is the concentration of normal atoms, Qoi is the effective c r o s s section of the atoms, F(V) is a function describing the elec- tron energy distribution, and Voi is the critical potential. Fabrikant substituted into Eq. (1.6) a value of F(V) consistent with Maxwell's law and an excitation function calculated from Eq. (1.1). He thereby obtained a mathematical expression for the absolute spectral line intensity. We shall not show the full expanded equation but
l = K'f{Te)neN0, (1.7)
where f(Te) is a monotonically increasing function of the electron temperature, and K'is a proportionality factor.
On the basis of (1.7) Fabrikant was able to explain the presence of intensity peaks in the spectral line at certain p r e s s u r e s . A
S P E C T R A L LINE INTENSITY 25 higher pressure has a twofold effect. On the one hand, the concen- trations of normal atoms and of electrons increase, and this in turn produces higher line intensities. This effect i s , however, counter- acted by the attendant electron temperature drop, which tends to lower the above intensities. It follows that the spectral line in- tensity may increase or decrease with a rise in pressure, depend- ing on which of the two factors predominates. It is further evident that the lines which exhibit the maximum intensity at lower p r e s - sures are those with higher excitation potentials.
With stepwise excitation involving a single intermediate level, the number of excitation events is given by
OO
AAf0j = Nfße $Q0l{V)F(V)VVdV +
OO
+ Nkne f Qkl(V)F(V)VVdVt ) ( 1 - 8
where Qhi is the excitation function for the transition from level k to level i9 Vki is the critical potential for level / , and Nk is the concentration of excited atoms in the k state. A schematic r e p r e - sentation of the excitational and radiative atomic transitions for the above case is shown in Fig. 7. Assuming Nh ~ ne.9 the line intensity can be expressed as a sum of two quantities:
I = KNo[f{Te)ne + fx (Te)nl\ (1.9) where f(Te) and f\(Te) are monotonically increasing functions of
the electron temperature.
£t 1—I — A L L I £i
'£ο FIG. 7. Excitational and radioactive transi-
tions in an atom.
26 EMISSION FROM GASEOUS DISCHARGES
i,mA i,mA i,mA i,mA
700 3O0 500 7ÛÛ 3Û0 5ÛÛ 7M 3W 5ffl 70Û 300 500 i, mA i,mA i,mA i,mA FIG. 8. Intensity of argon spark and arc lines vs.
the current.
As seen from (1.9) the spectral line intensity depends on both f(Te) and ne. Higher currents can cause higher or lower line intensities depending on whether the electron temperature drop or the r i s e in the electron concentration proves controlling. Frisch
[39] pointed out the possibility of a nonmonotonic variation of intensity following an increase in current density. Thus, over the range of very low current densities the intensity increases with electron concentration. This may be followed by a reduced in- tensity, due to a lower electron temperature. Finally, at large current densities, a higher intensity may again be noted since the phenomena corresponding to the second term of the equation can be important under these conditions.
At constant electron temperature and p r e s s u r e , Eq. (1.9) r e - duces to the expression
I = Ane + Bnl (1.10)
where Λ and Β may be assumed constant.
The validity of this equation was confirmed by experiments of Frisch and Kagan [ 6 3 ] . At low current densities, the intensity of lines of neutral argon (Ar I) at first increased with the discharge current (see Fig. 8). The level sections of the curves, which are recorded at high currents, indicate the presence of secondary
S P E C T R A L L I N E INTENSITY 27 p r o c e s s e s . The intensity of the lines of ionized argon (Ar II) varied as a square root of the current strength, indicating that the excitation is stepwise.
At high pressures ( 1 - 2 m m Hg), the curve of spark line inten- sities as a function of the current may exhibit a peak and a shape shown in Fig. 9 [ 9 4 ] . The nonmonotonicity of the curve is due to a transverse electric field along with a rarefaction in the central sectors of the positive column [94, 143, 1 4 4 ] . A s the current increases, the pressure goes down. This
may lead to lower line intensities.
The effect of the discharge p a r a m - eters on the intensities of spectral lines in various light sources has been in- vestigated in a s e r i e s of experimental studies [ 1 4 5 - 1 5 1 ] .
The above description of the effect of the discharge parameters on the spectral line intensity obviously is a simplified one. Actually, in calculating the intensity of radiation from a given spectral line, one should take into a c - count possible deviations from the M a x - wellian electron velocity distribution
[73], in addition to various secondary p r o c e s s e s such as successive transitions from higher to lower levels, collisions of the second kind, absorption of photons, recombination of ions, reabsorption of radiation, etc. [142],
To mention one instance, resonance radiation is quite important in the excitation of inert gases [27, 3 1 , 1 5 2 - 1 5 5 ] , and markedly distorts the spectral lines. Ladenburg and Levy [120] and F r i s c h and Bochkova [124, 125] studied reabsorption in neon while Frisch FIG. 9. Intensity of the argon spark line with λ = 4806 Â as a function of the current at pres- sures of 1.0 mm Hg (1) and
1.75 mm Hg (2).
28 EMISSION FROM GASEOUS DISCHARGES
and Bogdanova [123] studied it in cesium and Harrison [126] in helium. In some instances reabsorption was noted even when the concentration of the impurity was low (1% oxygen in helium [126]).
The reabsorption effect is not as pronounced when one inert gas is added to another [156]. In resonance lines, the reabsorp- tion was observed even at very low pressures and low currents [152].
The effect of the various discharge parameters on the spectral line intensity is more difficult to establish in the case of gas m i x - tures than in pure g a s e s . In this c a s e we must allow for changes in line intensities caused by collisions of the second kind. It has been shown experimentally that such impacts may result either in intensification or weakening of the lines. Collisions of the second kind led to marked intensification of metal lines excited in an argon arc [157]. Molecular impurities intensified the mercury resonance line λ = 2537 Â [158]. The effect of collisions of the second kind on excitation in gas mixtures has been discussed in several reports [106, 142, 1 5 9 - 1 6 9 ] .
For best analytical results it is advisable to work with a line whose upper excitation level has a brief lifespan, since a long life is associated with a high probability of collisions of the second kind [170].
The ratio of intensities of two spectral lines of various gases varies with the electron temperature. In a binary mixture, the component with the higher ionization potential will exhibit larger variations with the Te. It follows that a r i s e in electron tempera- ture causes a relative intensification of the lines of the component which is difficult to excite. This is why the helium lines in the spectrum of an argon-helium mixture become m o r e intense as the pressure and the diameter of the discharge tube are reduced.
A higher current as well as a higher electron concentration
S P E C T R A L LINE INTENSITY 29 should also intensify the lines of a component which is difficult to excite.* The intensity ratio obtained in a gas mixture subjected to a DC discharge is sharply distorted by the separation of the components (see Section 4 ) .
*The effect of discharge parameters on the relative intensities of the spectral lines is discussed at length in Section 15.