T H E A P P L I C A T I O N O F F A R U L T R A V I O L E T S P E C T R O S C O P Y T O G A S C H R O M A T O G R A P H Y
W I L B U R I. K A Y E
Beckman Instruments, Inc., Fuller ton, Calif., U.S.A.
Gas chromatography provides an extremely valuable tool for the separation of components of a mixture. The identification and quantitative measure- ment of the isolated components can be improved by the use of other conventional analytical tools such as infrared and mass spectroscopy. One such tool that does not seem to have been used is the far ultraviolet spectro- photometer. The extremely high absorptivities of many gases make the far ultraviolet region a very attractive one to use [9]. Flow-through cells of small "hold-up" volume are capable of absorbing light when filled with chromatographic effluent containing a very low concentration of absorbing material. Most carrier gases are completely transparent in the far ultra- violet region above 1600 A. A large number of gases possess very detailed and characteristic far ultraviolet absorption spectra such that positive identification of the gas may be made.
Until recently the instrumentation requirements for far ultraviolet spec- troscopy were so exacting one would not likely consider its application to gas chromatography [4]. However, this situation has changed, at least for the longer wavelength portion of the far ultraviolet region.
I N S T R U M E N T A T I O N
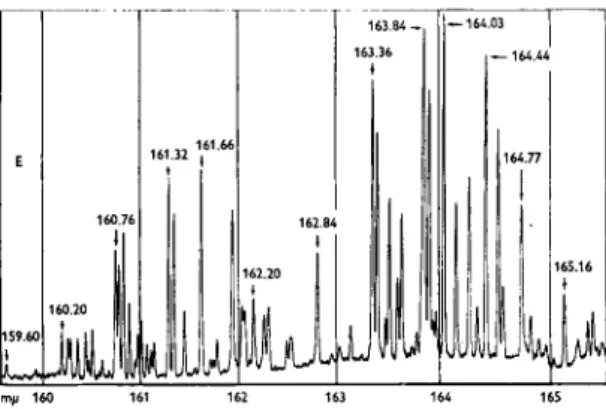
In this study a Beckman D K - 2 spectrophotometer modified for far ultra- violet operation was used in conjunction with the Beckman GC-2 gas chromatograph. The D K - 2 utilized special synthetic quartz prism, an R C A 7200 photomultiplier detector, and a hydrogen lamp with Suprasil window [6]. The instrument was purged with nitrogen to eliminate the absorption of oxygen and water vapor in the atmosphere. The instrument can operate to 1590 A for emission studies and to 1700 A for absorption work. Quartz has an extremely high dispersion in this region so that the resolving power of the instrument is very high. Fig. 1 shows the spectrum of the hydrogen lamp around 1650 A. In this region the hydrogen discharge emits a discrete line spectrum. The resolution (Effective Band Width) in Fig. 1 at 1615 A is 0.22 A. The continuous radiation is of weak intensity and in this region the hydrogen lamp is a poor source for scanning type absorption studies.
Above 1700 A the lamp emits an intense continuum. Stray light rises
456 Physical methods of chemical analysis · W . I. KAYE
my 160 161 162 163 164 165
Fig. 1.—Emission spectrum of hydrogen. Hydrogen emission Beckman N o . 94055 lamp;
sens. 312 χ 20; period, 2.0 sec; speed, 1 A/min.; scale 0-10; slit height, 4 mm; slit width, 0.045 mm; slit radius, 24 in.
rapidly as one approaches the short wavelength limit of the instrument but at 1750 A it is still less than 1 per cent. Fig. 2 shows the variation of stray light with wavelength. Under typical conditions of operation (1 per cent noise level at a 2 second period) the resolution in absorption work at 2000 A is 0.6 A. This is sufficient to bring out a great deal of detail in vapor phase absorption spectra.
In some of this work a time drive accessory (Beckman N o . 92430) was used in order to scan with time the effluent from the gas chromatograph column. A standard 1 cm flow-through cell (Beckman N o . 92522) was used for scanning the chromatograph effluent. Unfortunately, this cell was not provided with special far ultraviolet transmitting windows but the ordinary silica was found acceptable (15 per cent at 1700 A). The spectrograms (transmittance versus wavelength) were obtained with 0.10 and 10 cm sealed cells provided with special far ultraviolet transmitting windows.
Fig. 2.—Stray light versus wavelength—
modified DK-2 N o 94055 hydrogen lamp R C A No. 7200 photomultiplier N2 purge.
Application of far UV spectroscopy to gas chromatography 457
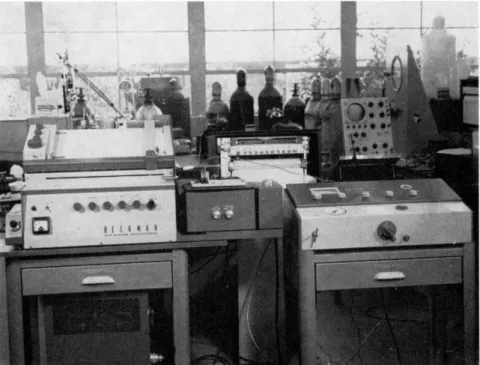
Fig. 3.—Photograph of the instrumentation.
The Beckman GC-2 instrument is a gas chromatograph primarily de- signed for analytical use. In the experiment described here it utilized a 4 ft length of quarter inch tubing (column) maintained at a temperature of 85°C.
Effluent from this column was passed directly into a flow-through cell placed in the sample path of the spectrophotometer. The response of the spectrophotometer was quite adequate to record the absorption of the sample as it was swept through the cell. Fig. 3 shows the two instruments as used. The outlet of the gas chromatograph was coupled to the flow- through cell of the spectrophotometer by means of a 2 ft length of |th inch copper tubing.
T H E O R Y
A l l gases absorb somewhere in the far ultraviolet. Fortunately, the gases (helium, argon and nitrogen) most commonly used as carriers in gas chro- matography are transparent in the portion of the far ultraviolet region that is of interest in this work. Helium does not absorb appreciably above 510 A. Argon transmits above 1300 A and nitrogen above 1400 in optical paths likely to be used in this type of work. The factors limiting sensitivity are (1) the absorptivity of the sample, (2) the optical path length, and (3) the resolution (and wavelength range) of the spectrophotometer.
458 Physical methods of chemical analysis · W. I. Κ AYE
T A B L E I . Molar absorptivities in the far ultraviolet.
Compound ε (L/mol-cm) Wavelength Reference
Olefins
ethylene 33 000 1704 A 14
propylene 13000 1710 5
Dienes
1.3-butadiene 30 000 2100 5
Aromatics
benzene 100 000 1790 5
naphthalene 120 000 2210 5
anthracene 22 000 1860 5
Carbonyl
formaldehyde 18 000 1750 2
acetaldehyde 10 000 1815 8
acetone 9 000 1950 8
Ethers
diethyl 2 000 1880 3
divinyl 15 600 2030 3
furan 31 000 1915 12
Halogens
methyl iodide 20 000 2013 1
ethyl bromide 10 000 1700 1
Miscellaneous
oxygen 500 1700 11
water vapor 3 000 1700 13
nitric oxide 900 1830 10
ammonia 12 000 1940 10
The most attractive feature of the far ultraviolet region is the high ab
sorptivity of most compounds. Table I lists a few absorptivity values selected from the literature. These values of absorptivities are only approximate since they depend upon the resolution of the instrument used. For each labeled compound the band listed in this table is the most intense one of that compound in the 1700-2200 A region.
The optimum path length for this work is largely dictated by the gas chromatograph. The cell must not contain a larger volume than the gas chromatograph delivers in the time during which the sample emerges from the column. The cell must be designed for "streamlined" flow of sample.
Application of far UV spectroscopy to gas chromatography 459 The cross section of the cell must fill the aperture of the spectrophoto
meter. For a typical laboratory analytical gas chromatograph with quarter inch diameter column a cell volume of 1 to 3 ml will not pose any hold-up problem (loss of resolution). Larger columns could effectively use larger optical cells in proportion to the column diameter. The cell used in this work had an effective volume of 1 ml (neglecting the connecting tubing) with an optical path length of 1 cm. There was no evidence of any hold-up in this cell.
The resolution (effective band width) of the far ultraviolet D K - 2 instru
ment used here varied from about 0.5 A at 2100 A to 5 A at 1700 A. The band width of the gaseous samples may frequently be considerably less than this. Unless the band pass of the instrument is a small fraction ( < £ ) of the half band width of the sample absorption band, the peak intensity will be materially influenced by instrument resolution. This is probably the main reason for the discrepancy in published absorptivity values of gases.
From Table I it is apparent that many compounds have molar absorp- tivities as high as 10,000 L/mol-cm. T o a large extent the molar absorp- tivities are a function of the number of chromophore groups in the molecule.
One can compute from this that a concentration of emerging gas of 10~6 moles per liter would produce an absorbance of 0.01 in a 1 cm cell. If the cell volume is 1 ml, then only 1 0- 9 moles or 6 χ 101 4 molecules, will produce this absorbance. Conceivably one might design a sample cell to fit adjacent to the exit slit of a spectrophotometer and possess an optical path of 1 cm for a volume of 0.25 ml. In such a cell only 1.5 χ 101 3 molecules of benzene (ε = 105) would produce an absorbance of 0.01. This is approximately the sensitivity of the thermal conductivity cell. The hydrogen flame detector is some 2500 more sensitive than this.
The above computations are based on a static condition for spectro
photometry and of necessity a dynamic (flowing) thermal conductivity or flame ionization condition. It is possible to collect the sample and study it by spectrophotometry with as long or short an instrument response time as one wishes. In a thermal conductivity cell or flame ionization detector, the sample must flow and response time cannot be adjusted at will. How
ever, if we wish to use the optical method to detect gases as they emerge from a column, one must consider the concentration of sample in the carrier gas. If one were to use a long path cell it would be quite possible to have all of the sample within the cell at a given instant under a flowing condition but the "hold-up" problem would be severe and the resolution of chromatographed peaks would be poor. Also the volume to path length ratio would increase with increasing path length due to beam divergence.
It is not practical to use multi-reflection cells in the far ultraviolet because of the poor reflectance of all materials in this region. Actually the limiting
460 Physical methods of chemical analysis · W . I . K A Y E
Fig. 4.—Chromatogram. Thermal con
ductivity and ultraviolet transmittance.
Mixture: 1, air; 2, methyl ioide; 3 , n- hexane; 4, benzene. A, thermal conduc
tivity; B9 transmittance at 2013 A; and C, transmittance at 1780 A.
Minutes 6 5 4 3 2 1 0
sensitivity of the optical absorption method is achieved using micro-liquid cells. However, the samples must be diluted with a transparent solvent for no cells can be made thin enough to handle the pure liquid. When using a small volume cell under flowing conditions of gas, the sample is never likely to be found entirely within the cell at one time and the practical sensitivity of the ultraviolet method will be less sensitive than indicated above. If the ultraviolet method is not as sensitive as the thermal conduc
tivity cell of what value is it as a detector? The answer seems to lie in the selectivity of the far ultraviolet detector.
A P P L I C A T I O N S
In order to evaluate a practical situation 0.07 ml of vapor above an equal volume solution of benzene, methyl ioide and H-hexame was passed through the GC-2 gas chromatograph. A 4 ft column containing Μ and Β silicone oil on crushed firebrick at 85°C was used. The emerging gas passed through the conventional thermal conductivity cell and then to the flow-through cell mounted in the far ultraviolet D K - 2 spectrophotometer. The latter was equipped with a time drive accessory. Unfortunately, the rate of drive on the thermal conductivity recorder was one inch per minute and that on the spectrophotometer was 2.5 cm/min so that the two records which have been superimposed on Fig. 4 do not have identical time scales. Actually the ultraviolet curves followed the thermal conductivity record with a constant 5 sec delay due to the time required for the gas to pass through the connect
ing tubing. The same volume of sample was passed through the column twice and two ultraviolet transmittance records were made at two different wavelengths. The wavelengths were selected for maximum sensitivity to benzene and methyl iodide.
Application of far UV spectroscopy to gas chromatography 461
100
75
50
25
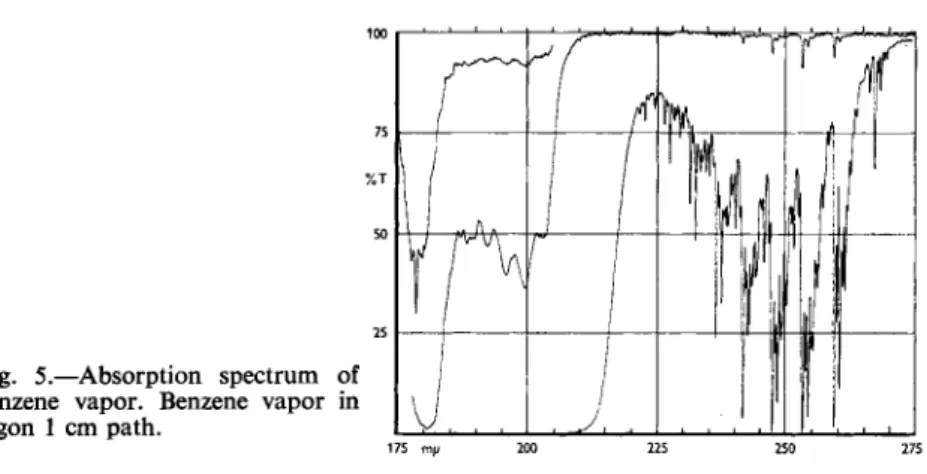
Fig. 5.—Absorption spectrum of benzene vapor. Benzene vapor in argon 1 cm path.
175 mp 200 225 250 275
Selection of the wavelength used was based upon the spectrograms of the pure material. Fig. 5 shows the spectrogram of benzene vapor as re- corded on the D K - 2 . The most intense absorption band occurs at 1790 A.
The spectrum of methyl iodide vapor is shown in Fig. 6. Several bands could have been chosen but the 2013 A band yields the best discrimination against benzene.
The w-hexane, which emerged from the column between the methyl iodide and the benzene, has no appreciable absorption at either wavelength. Like- wise the air peak, which was the first to come through the column, does not absorb. However, if the spectrophotometer is set to 1700 A or below the air peak is quite evident. Only the oxygen of the air absorbs in this region and this effect can be put to use to discriminate between oxygen and nitrogen. Had cyclohexane been added to this mixture it would have emerged from the column at the same time as the benzene. However, the cyclo- hexane would not have absorbed at 1780 A. By quantitative comparison of the thermal conductivity and ultraviolet transmittance records the true composition of the sample could have been determined.
100
75
% T 50
25
Fig. 6.—Absorption spectrum of methyl iodide.
1700 A 1800 1900 2000 2100
462 Physical methods of chemical analysis · W . I. KAYE
If one can trap the samples emerging from the column it is sometimes possible to identify the material by means of ultraviolet spectroscopy. This has been done quite successfully utilizing infrared spectroscopy but fairly large samples must be collected because of the smaller absorptivities gene
rally encountered in the infrared region. The samples may be trapped di- directly in the ultraviolet absorption cell without worry about damaging the cell with condensed moisture. If sample identification is the object of the experiment it is best to obtain the spectrum of the sample in the vapor state. Condensed phase ultraviolet spectra are usually characterized by very broad bands.
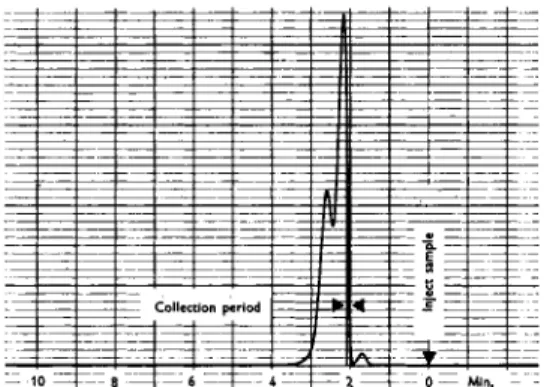
In order to illustrate this type of study a sample of a mixture of penta- dienes was passed through the GC-2 gas chromatograph and the isolated fractions were separately trapped. A 10 ft column containing 550 Carbowax was used at 40°C. Fig. 7 shows the conventional thermal conductivity record of this sample. Three samples were collected. The sample collected during the period indicated by the arrows gave rise to the spectrogram shown in Fig. 8. The broad intense absorptions centered about 2100 A are charac-
Fig. 8.—Absorption spectrum of chromatograph Fraction. 1,3- pentadiene trans; GC, sample;
ο I 1 1 1 1 1 1 1 10 cm path.
A 1800 2000 2200 2400
Fig. 7.—Chromatogram of Penta- diene mixture.
Application of far UV spectroscopy to gas chromatography 463
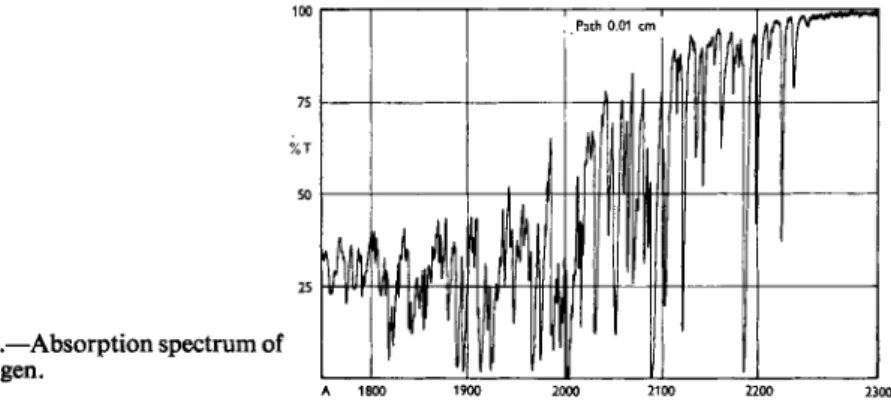
100
75
% T 50
25
Fig. 9.—Absorption spectrum of cyanogen.
A 1800 1900 2000 2100 2200 2300
teristic of conjugated dienes and in a sense give a "family" identification.
The pattern of sharp bands between 1700 and 1900 A identify the sample as trans 1,3-pentadiene. In a similar manner the last emerging peak was identified as cis 1,3-pentadiene. The first isolated component of the sample was not positively identified; however, it possessed a group of three diffuse bands around 2100 A indicative of a conjugated diene.
Before far ultraviolet spectroscopy can be put to widespread use for identification purposes it will be necessary to collect a library of reference spectra. If this work is done quantitatively the data may also serve to indicate the concentration as well as the composition of a mixture. Jones and Taylor [5] have made a good start on this library but many other compounds, particularly inorganic compounds possess characteristic ultra- violet spectra. Many of these spectra appear scattered throughout the literature. These have recently been catalogued [7]. Fig. 9 of cyanogen illustrates just how characteristic some of these spectra may be. One would have little difficulty making a positive identification for this compound.
On the other hand, the spectra of many high molecular weight compounds may be discouragingly broad. The substitution of only a few alkyl groups on a chromophore may broaden absorption bands until they are of little use for identification. Chromophores vary considerably in their "sensitivity"
to broadening by alkyl substitution. The iodides, for instance, retain some sharp bands even when heavily substituted [7]. The substitution of only one methyl group for a hydrogen atom on a double bond (ethylene) results in considerable broadening of bands.
In summary, the far ultraviolet spectral region seems to offer consider- able aid in the detection and identification of components separated by gas chromatography. Components unresolved by the column may be distin- guished by virtue of their different absorptivities at two or more different wavelengths. While there seems little possibility that detection limits will
464 Physical methods of chemical analysis · W . I. Κ AYE
be improved by this method, the high values of absorptivity and the charac
teristic spectra often encountered in the far ultraviolet make possible the identification of very small samples.
S U M M A R Y
The extremely high absorptivities and characteristic spectrum of many compounds in the far ultraviolet region have been put to good use for the selective detection and identification of effluents from a gas chromatograph.
The Beckman D K spectrophotometer modified for far ultraviolet work is readily adapted to scan either the spectrum of a chromatographed sample or record the transmittance at a fixed wavelength of effluent while it emerges from the column. It is capable of discriminating certain effluents that are unresolved by the chromatograph column.
The author is indebted to Mr. Robert Brace and Mr. Robert Kunold of the Application Engineering Department of Beckman Instruments, Inc. for assis
tance in this work.
R E F E R E N C E S
1. ASTOIN, N., GRANIER, J. and CORDIER, M., / . Phys. Radium 19, 507 (1958).
2. FLEMING, G . , ANDERSON, Μ . Α . , HARRISON, A . J. and PICKETT, L . W . , . / . Chem. Phys.
3 0 , 351 (1959).
3. HARRISON, A . J. and PRICE, D . R. W . , / . Chem. Phys. 3 0 , 357 (1959).
4. I N N , E. C. Y., Spectrochim. Acta 7, 65 (1955).
5. JONES, L . C. J. and TAYLOR, L . W . , Anal. Chem. 27, 228 (1955).
6. KAYE, W . I., Symposium on Spectroscopy, A S T M Reprint STP 269, 1960.
7. Appl. Spectroscopy. In Press.
8. LAKE, J. S. and HARRISON, A . J., / . Chem. Phys. 3 0 , 361 (1959).
9. PRICE, W . C , Advances in Spectroscopy 1, 5 6 (1959).
10. WATANABE, K . , ZELIKOFF, M. and I N N , C. Y. J., Air Force Cambridge Research Center, Tech. Rpt. 53 (1953).
11. WATANABE, K . , I N N , E. C. Y. and ZELIKOFF, M., / . Chem. Phys. 21, 1026 (1953).
12. W A T A N A B E , K . and N A K A Y A M A , T., / . Chem. Phys. 29, 4 8 (1958).
13. WATANABE, K . and ZELIKOFF, M., / . Optic Soc. Am. 4 3 , 753 (1953).
14. ZELIKOFF, M. and W A T A N A B E , K . , / . Optic Soc. Am. 4 3 , 7 5 6 - 5 9 (1953).