The Balancing Act of Intrinsically Disordered Proteins: Enabling Functional Diversity
while Minimizing Promiscuity
Mauricio Macossay-Castillo
1, 2, Giulio Marvelli
1, 2, Mainak Guharoy
1, 2,
Aashish Jain
3, Daisuke Kihara
3, 4, Peter Tompa
1, 2, 5and Shoshana J. Wodak
11 - VIB-VUB Center for Structural Biology,Vlaams Instituut voor Biotechnologie, Pleinlaan 2, 1050 Brussels, Belgium
2 - Structural Biology Brussels,Department of Bioengineering Sciences, Vrije Universiteit Brussel, Pleinlaan 2, 1050 Brussels, Belgium 3 - Department of Computer Science,Purdue University, West Lafayette, IN 47907, USA
4 - Department of Biological Sciences,Purdue University, Hockmeyer Structural Biology Building, 249 S. Martin Jischke Dr West Lafayette, IN 47907, USA
5 - Institute of Enzymology,Research Centre for Natural Sciences, Hungarian Academy of Sciences, Magyar tudosok korutja 2, 1117 Budapest, Hungary
Correspondence toShoshana J. Wodak:shoshana.wodak@vub.vib.be https://doi.org/10.1016/j.jmb.2019.03.008
Edited by Monika Fuxreiter
Abstract
Intrinsically disordered proteins (IDPs) or regions (IDRs) perform diverse cellular functions, but are also prone to forming promiscuous and potentially deleterious interactions. We investigate the extent to which the properties of, and content in, IDRs have adapted to enable functional diversity while limiting interference from promiscuous interactions in the crowded cellular environment. Information on protein sequences, their predicted intrinsic disorder, and 3D structure contents is related to data on protein cellular concentrations, gene co-expression, and protein–protein interactions in the well-studied yeastSaccharomyces cerevisiae.
Results reveal that both the protein IDR content and the frequency of“sticky”amino acids in IDRs (those more frequently involved in protein interfaces) decrease with increasing protein cellular concentration. This implies that the IDR content and the amino acid composition of IDRs experience negative selection as the protein concentration increases. In theS. cerevisiaeprotein–protein interaction network, the higher a protein's IDR content, the more frequently it interacts with IDR-containing partners, and the more functionally diverse the partners are. Employing a clustering analysis of Gene Ontology terms, we newly identify ~ 600 putative multifunctional proteins in S. cerevisiae. Strikingly, these proteins are enriched in IDRs and contribute significantly to all the observed trends. In particular, IDRs of multi-functional proteins feature more sticky amino acids than IDRs of their non-multifunctional counterparts, or the surfaces of structured yeast proteins.
This property likely affords sufficient binding affinity for the functional interactions, commonly mediated by short IDR segments, thereby counterbalancing the loss in overall IDR conformational entropy upon binding.
© 2019 The Authors. Published by Elsevier Ltd. This is an open access article under the CC BY-NC-ND license (http://creativecommons.org/licenses/by-nc-nd/4.0/).
Introduction
To carry out their function, proteins tend to associate with other macromolecules (other pro- teins, nucleic acids, etc.)[1]as well as with small- molecule ligands. These functional associations take place in the crowded cellular environment, where they have to compete with promiscuous non- functional binding events that may be detrimental
to fitness because they sequester interaction partners[2,3].
There is mounting evidence that to mitigate the interference from non-functional interactions, nature acts at several levels. These include adapting the amino acid sequence to modulate protein solubility and intrinsic stability [4,5], temporal, condition- dependent regulation of gene expression [6,7], or protein abundance and half-life [8]. Other means of
0022-2836/© 2019 The Authors. Published by Elsevier Ltd. This is an open access article under the CC BY-NC-ND license
(http://creativecommons.org/licenses/by-nc-nd/4.0/). Journal of Molecular Biology(2019)431, 1650–1670
reducing such interference involve post-translational modifications (PTMs)[9,10], binding to various protein adaptors[11], or the sequestration of proteins within specialized cellular compartments[7,12].
Of particular interest in this context are intrinsically disordered proteins (IDPs) and proteins with intrinsi- cally disordered regions (IDRs). IDPs/IDRs and their properties have been extensively reviewed [13,14].
These are polypeptides, or segments thereof, which are essentially devoid of stable secondary or tertiary structures, when in isolation. These segments are described as ensembles of conformations that inter- convert on a range of timescales [15,16]. Nonethe- less, a significant fraction of IDPs and IDRs have some regions with residual transient secondary structures. These regions often mediate function through association with other proteins (mostly to structured domains in these proteins), and can undergo disorder-to-order transitions as part of the recognition process[17].
Functional associations of IDPs/IDRs tend to be mediated by peptide recognitions motifs, the so- called short linear motifs (SLiMs), which are rela- tively well conserved in evolution[15,18,19]. While interactions mediated by individual motifs tend to be quite weak, interactions with several motifs of the same IDR may act cooperatively, thereby increasing the range of observed affinities[20,21]and enabling interactions with multiple partner proteins [22–25].
These properties empower IDPs/IDRs to carry out a diverse range of important functions, more particu- larly in regulatory [26,27] and signaling processes [15,28]. Intrinsic disorder has also been suggested to play a role in promoting the assembly of protein complexes[29].
The same properties, however, may also prompt disordered proteins to form promiscuous interactions with other proteins, especially at higher protein concentrations, causing, for example, deleterious dosage sensitivity in yeast [2]. It has also been observed that proteins with a high degree of intrinsic disorder are often hubs in protein–protein interaction (PPI) networks of human and other model organisms [22,24,25,30,31], with hubs being defined as the subset of protein nodes that form interactions with many other proteins, typically more than 10. While many of these interactions may be functional in nature[32], the fact that they may also include non- functional interactions needs to be considered[33].
The cellular abundance of a protein is a crucial parameter governing its association with other cellular components, since this association depends on the standard free energy of the binding reaction and on the concentrations of the interacting components[34].
Previous analyses have shown that the abundance and residence time of IDPs in the cells of yeast Schizosaccharomyces pombe and human were tightly regulated by fine-tuning the rates of translation, protein degradation, and transcript clearance [35].
Another mechanism of regulating availability of IDPs was suggested to involve synthesizing them at the site where they are required, by localization of the corresponding mRNA[36].
The main question addressed in the present study is if and to what extent the chemistry and other properties of IDPs and IDRs have adapted to mitigate their risk of engaging in promiscuous interactions, while enabling their diverse functional roles. To address this question, we focus on proteins of the yeast Saccharomyces cerevisiae, one of the most extensively studied organisms in terms of protein function, proteome- scale PPI data [33,37], gene expression [38], and protein abundance [39]. We relate information on protein sequences, their predicted intrinsic disorder content, and 3D structures to cellular protein abun- dance, and associate these relationships with protein function. In addition, we analyze patterns of the physical interactions of these proteins in a high- confidence (HC) PPI network of yeast soluble proteins [40]. These patterns are correlated to the intrinsic disorder content and abundance level of the corre- sponding proteins, as well as to the functional similarity and gene co-expression of their interacting partners.
Importantly, we complement the analysis by identifying multi-functional proteins on the basis of their Gene Ontology (GO) annotations [41], and evaluate the relative contribution of protein multi-functionalityversus its degree of intrinsic disorder to the observed trends.
Results of our analysis yield new insights into how the IDR content of proteins and the amino acid composition of IDRs have adapted to enable IDR- containing proteins to perform diverse functional roles, while reducing interference from promiscuous interactions in the crowded cellular environment.
Results and Discussion
Intrinsic disorder content in relation to protein abundance and functional annotations
Figure 1plots the fraction of proteins encoded by the S. cerevisiae genome containing a high degree of intrinsic disorder as a function of their abundance in the cell. Proteins with a high degree of disorder are defined as those with≥30% of their residues predicted to be in IDRs of ≥20 consecutive residues along the chain.
Disordered residues were predicted using the IUPred software[42,43], but essentially the same results were obtained using other disorder prediction methods (see Materials and Methods). Data on protein abundance were obtained from the Protein Abundance Database (PaxDb) database[39]. These data are expressed in parts per million (ppm), a quantity linearly related to the protein copy number in cells[44].
The plot ofFig. 1shows a clear trend for the fraction of proteins displaying high intrinsic disorder to decrease
with increasing protein abundance. This trend trans- lates into a strong inverse correlation between the fraction of highly disordered proteins and their abun- dance (rS=−0.76, withrSbeing the Spearman's rank correlation coefficient), which is, however, weakly significant (p= 0.02), likely due to the dip in the fraction of highly disordered proteins in the lowest abundance range. Indeed, the correlation becomes stronger and highly statistically significant (rS= −0.94p = 2e−16) when ignoring proteins with abundance below 8 ppm.
The latter tend to include membrane proteins, for which cytoplasmic abundance is underestimated [12], and various cellular proteins that are not reliably detected by current proteomics methods[45,46](seeMaterials and Methodsfor details). A highly statistically significant but lower correlation coefficient is obtained (rS=−0.11,p= 4e−15) when taking into account the fraction of all the residues in a protein that are predicted to be intrinsically disordered, over the entire range of protein abun- dances. Taken together, these results indicate that IDRs, especially IDRs ≥20 residues, are selected against as protein abundance increases.
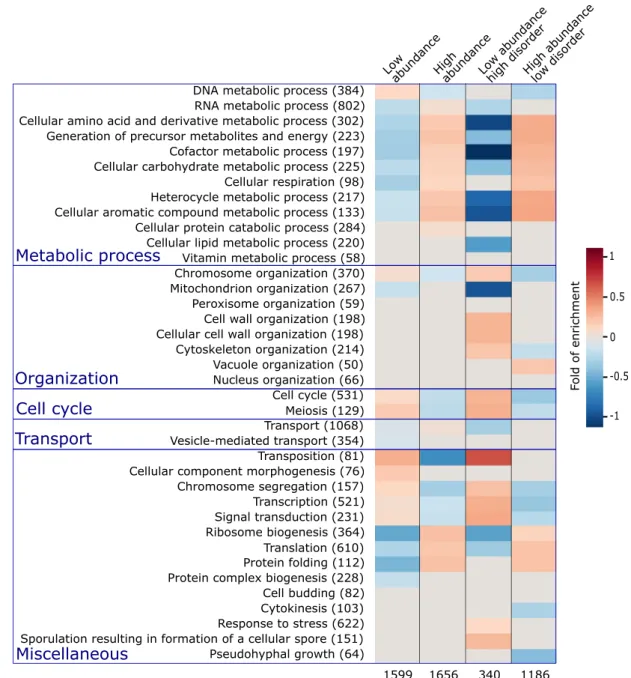
Both the abundance and the degree of putative intrinsic disorder of a protein were shown to correlate with protein function to some extent [47]. To re- examine these correlations in our data set, we computed the enrichment in the biological process (BP) GO terms inS.cerevisiae proteins in the highest
and lowest one third of the abundance range, respectively. This was repeated for subsets in each of these two categories, comprising proteins of high and low disorder, featuring≥30% andb10% of their residues in IDRs of ≥20 residues, respectively, with results displayed inFig. 2.
The first two columns of the heatmap in Fig. 2 clearly indicate that most BP terms related to cellular metabolism, ribosome biogenesis, translation, and protein folding are overrepresented in high- abundance proteins and are underrepresented in proteins of low abundance. This trend is reversed, with an overrepresentation in low-abundance pro- teins, and an underrepresentation in highly abundant ones, of processes related to the cell cycle, chromosome segregation, transcription, cellular component morphogenesis, and signal transduction.
Interestingly, these same trends are significantly strengthened in the subsets of proteins with the highest and lowest disorder content in each of the two abundance categories (last two heatmap col- umns inFig. 2). For example, the overrepresentation of metabolic processes, ribosome biogenesis, and translation and protein folding is more pronounced in high-abundance proteins with low IDR content than in all high-abundance proteins. The same applies to the underrepresentation of the same processes in low-abundance proteins with high IDR content.
Likewise, the highlighted reverse trend for processes such as chromosome segregation, transcription, and cell cycle processes is also significantly more pronounced when IDR content is considered.
These various trends are in good agreement with those reported in a previous study examining the relation between proteins with high IDR content in UniProt[48]and their BP annotations[49]. The new insight provided by our analysis is that the relation of IDR content to protein function also depends on protein abundance, an aspect likely reflecting a more complex level of regulation and adaptation in evolution.
Residue properties of IDRs in relation to protein abundance
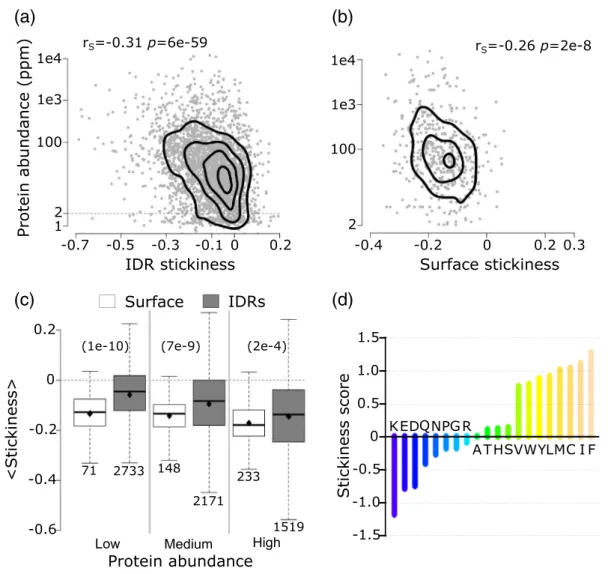
In the following, we investigate the relationships of various sequence properties of the IDRs with the abundance levels of the corresponding proteins. The main properties examined are the average stickiness of IDR residues, with stickiness representing an interaction propensity scale derived from structural data (see Ref. [4] and Fig. 3d), and the average aggregation propensity of residues in IDR regions, as measured by different aggregation propensity scales (see Materials and Methods for details). These properties were computed only for IDRs of ≥20 consecutive residues along the polypeptide.
The most statistically significant correlation is found between the average stickiness value of residues in Fig. 1. Fraction of S. cerevisiae proteins with a high
degree of putative intrinsic disorder, as a function of their cellular abundance. The graph reveals a strong negative correlation between the fraction of highly disordered proteins and the corresponding protein abundance level (Spearman correlation rS=−0.76,p = 0.02). A stronger and highly significant correlation is obtained when applying a somewhat higher abundance threshold and a lower but significant correlation is observed when taking into account the fraction of all the disordered residues in a protein (see text). Proteins featuring a high degree of intrinsic disorder are defined as those containing≥30% of their residues in IDRs of at least 20 consecutive residues.
Proteins in the yeast proteome were divided according to their abundance into 10 equally populated bins (498 proteins each). Numbers along the horizontal axis repre- sent the rounded upper limit in the protein abundance range of each bin.
IDRs and protein abundance. From the scatter plot of Fig. 3a, we see that the average stickiness of IDRs decreases with protein abundance (rS =−0.31 p= 6e−59). Interestingly, this trend is very similar to
that reported earlier for the average stickiness values of surface (solvent-accessible) residues of globular proteins inS. cerevisiaeand other model organisms [4].
Fig. 2. Enrichment in GO terms for proteins with different abundance levels and intrinsic disorder contents. The first column lists the BP terms of the GO[56,57]for which statistically significant enrichments were obtained. The number of S. cerevisiaeproteins with the corresponding BP term in the reference data set is indicated in parentheses. The last four columns represent the heat maps of the computed statistically significant enrichment levels for each of the listed BP terms among proteins in the following 4 categories respectively. Proteins among the 33.3 percentile most abundant and least abundant proteins, respectively (columns 2 and 3); the subset of proteins from each of the previous categories with high (≥30%) and low (b10%) IDR content, respectively (columns 4 and 5). The number of proteins in each of the four categories is listed at the bottom. The BP GO terms are those from the GO slim yeast ontology in the BiNGO[84]application for Cytoscape [85] with all possible evidence codes. Enrichments were computed using as reference, all S. cerevisiae proteins with available GO annotation and abundance levels of at least 2 ppm (4900 proteins in total). The statistical significance of the computed enrichment was evaluated using the hypergeometric test with Benjamin and Hochberg false discovery rate (FDR) multiple testing correction[93].
Retrieving the atomic coordinates of globular soluble yeast proteins, totaling 452 structures, from a recent version of the Protein Data Bank (PDB;
October 2017), and computing the average sticki- ness values of their surface residues, we confirm the previously reported[4]negative correlation between these values and protein abundance (rS=−0.26,p= 2e−8) (Fig. 3b). Using our more recent larger data set of yeast protein structures, we also reproduce the reported negative correlation [4] between the average stickiness of residues in the protein interior
and protein abundance (rS = −0.22, p = 2e−6) (Supplementary Fig. S1). But unlike in Ref. [4], we observe a weak positive correlation between protein size and the stickiness of both interior and surface residues, respectively (Supplementary Fig. S2a, b).
The latter positive correlation may reflect the greater tolerance of larger proteins for surface residues to evolve toward optimizing interactions with binding partners at the cost of compromising intrinsic stability, owing to the smaller surface to volume ratio of larger proteins[50].
(a) (b)
(c) (d)
Fig. 3. Average residue stickinessversusprotein abundance. (a) Scatter plot of the average residue stickiness in IDRs
≥20 residues of 2874 (2566≥2 ppm)S. cerevisiaeproteins, as a function of protein abundance. (b) Scatter plot of average stickiness of surface residues in 452 yeast globular proteins retrieved from the PDB, as a function of protein abundance.
The Spearman's correlation coefficients (rS) and the correspondingpvalues are given at the top of each panel. For both data sets, correlations were calculated using proteins with an abundance value of at least 2 ppm. (c) Boxplots of average residue stickiness on the surface of globular proteins (white) and in IDRs ≥20 residues (gray) for proteins in three abundance ranges: low (2–15.5ppm), medium (15.6–64.7ppm), and high (64.8–21866). The corresponding average stickiness values (diamond in each boxplot) are as follows: −0.13,−0.06,−0.14,−0.10,−0.17, and−0.15.Pvalues (computed using the Wilcoxon rank‐sum test) between pairs of distributions in the three abundance ranges are given at the top of the panel in parentheses. The number of data points in each distribution (n) is shown below each boxplot. The horizontal line in each boxplot indicates the median value. Outliers are not depicted. (d) Bar plot of the stickiness score of amino acids in Ref.[4]. Protein abundance values were obtained from PaxDb[39](seeMaterials and Methods).
Finally, we note that the average residue hydro- phobicity of IDRs, measured using the Kyte and Doollitle scale[51] (Supplementary Fig. S3a), was also negatively correlated with protein abundance, albeit to a lesser degree (rS=−0.12,p= 4e−10) than the average stickiness.
Following Ref. [4], we interpret the decrease of average IDR stickiness with protein abundance as reflecting the fact that proteins tend to limit promiscuous interactions by reducing the stickiness of residues in readily accessible, solvent-exposed regions: the IDRs of at least 20 residues, analyzed here, and the surface residues of structured proteins and domains.
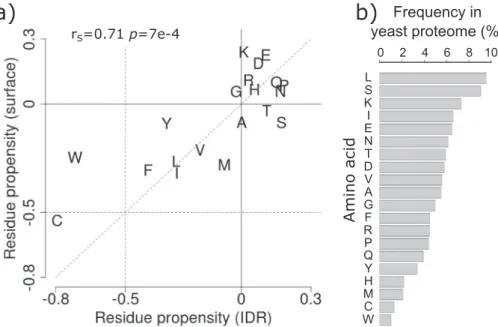
Somewhat unexpectedly, however, in proteins of all abundance levels, and particularly in less abundant proteins, the average stickiness of residues in IDRs is shifted toward higher values (more sticky) relative to surface residues of globular proteins (p= 1e−10 to 2e−4), as witnessed by the distributions inFig. 3c. To gain further insight into the origins of this shift, we examine the amino acid propensities in the two types of regions respectively (Fig. 4a), using the full yeast proteome as reference. We find that both IDRs and surface residues of globular proteins are depleted in sticky amino acids, especially in the aromatics W, Y, and F, and in C, and somewhat enriched in the least sticky charged amino acids (Fig. 3d). Interestingly, the depletion in the four sticky amino acids is more pronounced in IDRs, whereas surface residues are enriched in the least sticky charged amino acids (E, D, K) (Fig. 4a). To understand how these trends contribute to the higher stickiness of IDRs relative to
surface residues, one must take into account amino acid frequencies in the proteome (Fig. 4b). We see, indeed, that the more sticky amino acids (W, Y, F, C) are the least abundant amino acids overall, whereas the less sticky charged amino acids (E, D, K, R) are among the most abundant amino acids. Thus, the higher average stickiness of IDRs relative to surface residues is the consequence of the protein surface being enriched in less sticky and highly abundant charged amino acids. For the full list of amino acid frequencies and propensities, see Supplementary Table S2.
This higher stickiness of IDRs is interesting. It may reflect the need to afford a minimum binding affinity for the SLiMs of IDRs that commonly engage in interac- tions with binding partners. Such minimum binding affinity would partially compensate for the overall loss in conformational entropy upon binding, and may therefore relate to the more multi-functional nature of these proteins in comparison to their structured counterparts, an aspect examined further along this study. Also noteworthy is the enrichment in the more abundant S and T amino acids in IDRs relative to surface residues (Fig. 4a). These very marginally sticky residues commonly undergo phosphorylation.
Their enrichment in IDRs is hence consistent with the frequent role of IDRs in signaling processes[15,28].
Lastly, we find that there is virtually no overlap between putative IDRs and aggregation prone segments identified using two different computational methods: TANGO, an algorithm for predicting aggre- gation prone regions in unfolded polypeptide chains
Fig. 4. Comparing amino acid propensities of IDRs to those on surfaces of globular proteins. (a) Amino acid propensities in IDRs≥20 residues (horizontal axis)versusthose on the surfaces of globular proteins/domains (vertical axis) using the yeast proteome as reference (seeMaterials and Methods). Amino acids are represented by the one-letter code. The Spearman's correlation coefficient between the two sets of propensities and the correspondingp value are given at the top of the graph. (b) Frequencies of amino acids (%) in the yeast proteome.
[52], and PASTA2.0, a predictor of residues likely to be part of amyloid fibrils [53]. Less than 1% of the residues in IDRs overlapped with aggregation prone residues predicted by both methods, indicating that unlike globular proteins[52–54], IDRs are essentially devoid of such segments. Recent findings on intra- cellular liquid-like protein compartments, which often lead to the formation of fibrillar aggregates involving IDRs, suggest indeed that these aggregation phe- nomena are distinct from those occurring in the unfolded state of structured proteins[55].
Relating protein properties to the pattern of their physical and functional interaction in the cell
Having gathered evidence that structural disorder has evolved properties that promote its capacity to form functional interactions with other proteins, we proceed to investigate how several of the protein properties analyzed above relate to the patterns of physical and functional interactions proteins form in the cell. These patterns are investigated in the high confidence (HC) PPI network ofS. cerevisiaesoluble proteins, built from data obtained by two different groups using affinity purification and mass spectrom- etry techniques[40]. This network, thereafter denoted as the Collins network, contains 1622 proteins, representing only a fraction (~ 25%) of all yeast
proteins. These proteins engage in 9070 reliably detected “interactions” (see Materials and Methods and Ref.[40]for details). The detected“interactions” represent in fact co-complex associations, of which only a fraction corresponds to direct physical contacts [33].
For each protein in the network, we retrieved their abundance values and several other properties of interest. The functional implications of the interactions were obtained by associating each protein node to its functional annotations, retrieved from the GO resource [56,57], as well as its mRNA expression profiles measured in a set of different conditions (COX- PRESdb[38]). This information was further analyzed to quantify the degree of functional diversity among the interacting proteins.
Relating protein abundance and intrinsic disorder to the number of interaction partners
The number of interactions formed by a protein in a PPI network depends on several factors. When present at higher concentrations, a protein may engage in promiscuous interactions with multiple partners[58,59]
and is generally more readily detected by experimental methods [33,37]. Interactions with multiple partners may also be a distinctive property of proteins that carry out multiple functions. It is therefore not surprising
(a) (b)
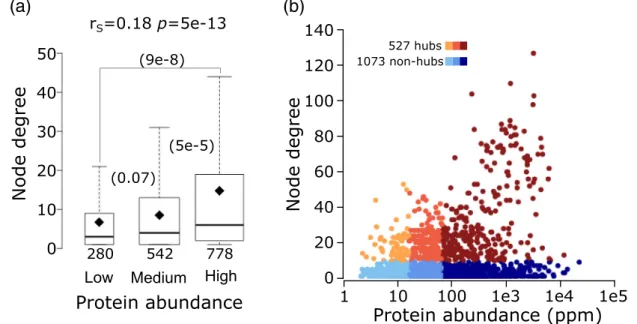
Fig. 5. Relating protein abundance to the number of interaction partners (node degree) in the yeast interactome.
(a) Boxplots of the number of interaction partners (node degree) for proteins in three ranges of abundance: low (2–15.5 ppm), medium (15.6–64.7 ppm), and high (64.8–21866 ppm).Pvalues (computed using the Wilcoxon rank‐sum test) between pairs of distributions in the three abundance ranges are given in parentheses. The number of data points in each distribution (n) is shown below each boxplot. The horizontal line in each boxplot indicates the median value, and the diamond indicates the mean value. Outliers are not depicted in the panel. (b) Scatter plot of protein abundanceversusnode degree. Hub proteins (those with≥10 interaction partners) are colored from orange to brown, and non-hubs (b10 interaction partners) are colored from light to dark blue, according to the three protein abundance ranges given in panel a. Hubs represent 22%, 30%, and 39%, respectively, of proteins of low, medium, and high abundance in the HC Collins interactome.
to find that the number of interaction partners (node degree) of a protein in the Collins yeast network is significantly positively correlated with its abundance (rS= 0.18,p= 5.2e−13) (Fig. 5a). As a result, hubs in the network, defined as proteins (nodes) connected to at least 10 other proteins, are enriched in abundant proteins (Fig. 5b).
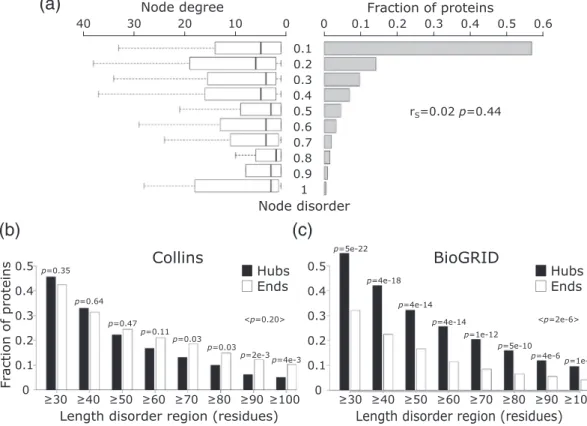
Next, we investigate the relation between the number of interaction partners of a protein and its intrinsic disorder level, with the latter defined as described above. Depicting the histograms of predicted protein disorder and the corresponding node degree distribu- tions side by side (Fig. 6a), there appears to be no correlation between the two parameters (rS=−0.02, p = 0.44). This lack of correlation confirms earlier findings by Schnellet al. [60], but disagrees with a several other studies according to which network hubs tend to be more intrinsically disordered than non-hub proteins[22,24,25,61].
Being fully aware that PPI networks of the same organism detected by different experimental methods or derived from different databases may differ
substantially (for review, see Refs. [33,37,62–64]), we hypothesized that differences between the yeast PPI networks used in different studies are the main reason for these contradictory observations. To test this hypothesis, we computed histograms displaying the fractions of proteins featuring increasing levels of disorder in hubs and“end”proteins, respectively. This was done for proteins in the PPI network used here and for those in a recent version (March 2018) of the multi-validated (MV) PPI network of yeast, down- loaded from BioGRID (interactions supported by at least two publications) [65]. We considered this literature-curated network, hereafter denoted as BioGRID, because earlier versions of this network were used in two of the above mentioned earlier studies[22,32].
Our results show striking differences between the corresponding histograms (Fig. 6b, c). In the Collins network, hub proteins tend to be less disordered (albeit not significantly) than“end”proteins (average p≥0.05). On the other hand, hubs in the BioGRID network are significantly more disordered than“end”
(a)
(b) (c)
Fig. 6. Node degree of proteins with different levels of intrinsic disorder. (a) Depicted on the right-hand side is the histogram of the intrinsic disorder ranges (fraction of disordered residues in IDRs≥20 residues long) of protein nodes in the Collins yeast PPI network[40]. Shown on the left are boxplots representing the distributions of the number of interaction partners (node degree) for individual disorder ranges of disorder. The Spearman's correlation coefficient (rS) and its correspondingp value are given at the right-hand side of the panel. (b) The fraction of hub (≥10 partners) and “end”
(1 partner) proteins at different IDR length cutoffs in the HC yeast PPI network of Collins. (c) The same as panel b but for proteins in a recent version of the BioGRID[65]interactome. In both panels, thepvalue between the fraction of hub and end proteins was calculated using the two-sample test for equality of proportions with continuity correction (Pearson's chi-squared statistic).
proteins (maximump= 1e−5), in excellent agreement with previous observations (Fig. S1 of Ref. [22]).
These opposing trends cannot be attributed to a bias in protein disorder content of the respective networks, since both networks are similarly enriched in IDP/IDRs relative to the proteome as a whole (Supplementary Fig. S4).
Reproducing the same trends as in Ref.[22]with an up-to-date version of the BioGRID network, therefore, suggests that other differences between the BioGRID and Collins networks may be at play. In the Materials and Methods section, we present evidence that the BioGRID and Collins networks differ substantially in a number of important aspects.
We show, in particular, that the Collins network is significantly less noisy than the BioGRID network, despite the fact that the latter includes PPI data from multiple detection methods, in agreement with previous finding [33], thereby justifying the use of the Collins network throughout our analysis.
Relating protein intrinsic disorder to the properties of its interaction partners
Having demonstrated that the level of intrinsic disorder of a protein is not significantly correlated with the number of its interaction partners in the PPI network, we now examine the relation of protein disorder with various properties of its partners. In particular, we considered the disorder level of the
interacting partners, their gene co-expression rela- tionship, and their functional similarity based on GO terms. The latter two properties were evaluated for protein pairs and averaged over all pairs of the direct interaction partners of a given protein node (see Materials and Methodsfor details).
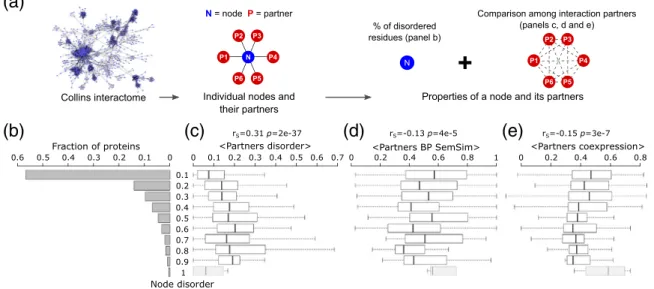
Our analysis reveals that more disordered protein nodes tend to interact with more disordered partners (rS= 0.31p= 2e−37) (Fig. 7b, c). On the other hand, statistically significant negative correlations are detected between the disorder level of the protein node and both the average pairwise semantic similarity of the BP GO annotations (rS=−0.13p= 4e−4) and the average pairwise correlation coeffi- cient of the gene expression profiles (rS=−0.15,p= 3e−7) of its partners (Fig. 7b, d, e).
To further scrutinize the latter findings, we examined properties of hub proteins and their interaction partners. Hubs interact with a larger number of partners, yielding more robust statistics for trends in various partner properties. We segregated hubs into two groups: hubs with weakly co-expressed partners (average pairwise Pearson correlation coefficient b|0.5 |) and hubs with highly co-expressed partners (average pairwise Pearson correlation coefficient
≥0.5) (see Materials and methods). In line with the correlations described above, we find that, on average, hubs with weakly co-expressed partners contain nearly twice as many disordered residues than those interacting with highly co-expressed
(a)
(b) (c) (d) (e)
Fig. 7. Relating intrinsic disorder of protein nodes to the properties of their interaction partners. (a) Schematic illustrations of node types and their computed properties. (b) Histogram of the intrinsic disorder levels of protein nodes of the HC Collins yeast PPI network[40], depicted inFig. 6a. Shown to the right are boxplots representing the distributions of various properties of the interaction partners of protein nodes in the disorder ranges depicted on the far-left histogram. (c) Average disorder (fraction of disordered residues in IDRs≥20 residues long) of interaction partners, (d) average functional similarity (semantic similarity of their BP GO annotations, BP SemSim) of interactions partners, and (e) average coexpression (Pearson correlation coefficient of the mRNA expression profiles[38]) of interaction partners. The Spearman's correlation coefficient (rS) and its correspondingp value are given at the top of each panel. Nodes with the highest disorder level comprisingb10 proteins (grayed boxplots) were not considered in the analysis.
(a) (b)
(c) (d)
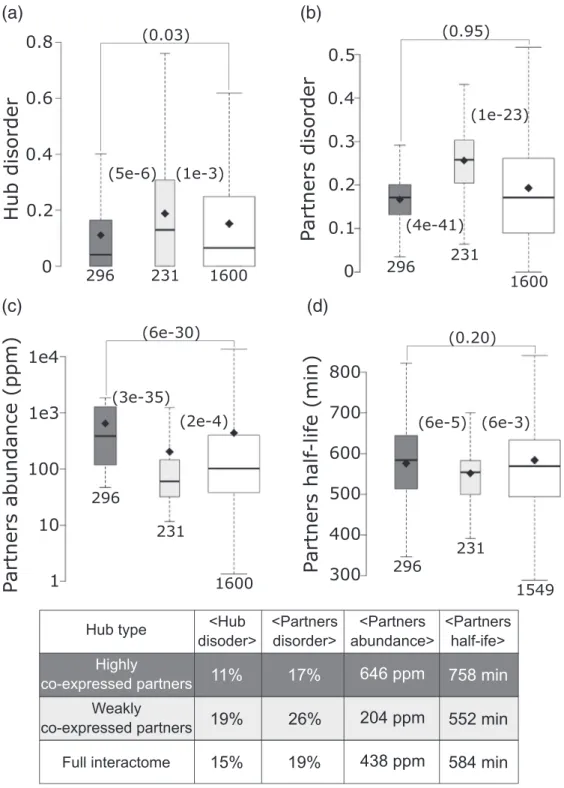
Fig. 8. Contrasting the properties of protein nodes and their interaction partners in hubs with highly and weakly co- expressed interaction partners. (a) Boxplots depicting the average disorder level of: hubs with highly co-expressed partners (average partners' mRNA expression profiles Pearson correlation coefficient≥0.5; dark gray), hubs with weakly co-expressed partners (average partners' mRNA expression profiles Pearson correlation coefficientb|0.5 |; light gray), all protein nodes in the HC Collins interactome (white). (b–d) Boxplots depicting respectively the distributions of disorder content, abundance levels (ppm) and half-life (min) of the interaction partners for the same three categories of protein nodes as in panel a. Abundance values are from PaxDb[39], and yeast protein half-lives are taken from Ref.[78].Pvalues (computed using the Wilcoxon rank‐sum test) between pairs of distributions in the three groups are given in parentheses.
The number of data points in each distribution (n) is shown below each boxplot. The horizontal line in each boxplot indicates the median value, and the diamond indicates the mean value. Outliers are not depicted. The table at the bottom lists the average values of the corresponding displayed distributions.
partners (19%versus11%,p= 5e−6) (Fig. 8a). The weakly co-expressed partners of the first category of hubs are also more disordered than the highly co- expressed partners of the second category (26% of disordered residuesversus17%,p= 4e−41) (Fig. 8b).
Interestingly, the same weakly and highly co- expressed partners of the corresponding two hub categories display, on average, significantly different abundance levels (p = 3e−35) and half-lives (p = 6e−5) (Fig. 8c, d). Average values for all the parameter distributions are listed in the table of Fig. 8. These various trends hold when segregating hubs into those with low-to-medium and high abundance levels, respectively (Supplementary Fig. S5).
In summary, the picture emerging from these observations is that more disordered proteins tend to interact with more disordered partners. The interaction partners of these proteins are also more weakly co- expressed and functionally diverse, as well as less abundant and shorter lived. These trends are consis- tent with previous findings, where more disordered network hubs were suggested to play distinct roles in diverse signaling cascades [32] (Supplementary Fig. S6). In the next section, we explore an alternative explanation that takes the multifunctional character of the protein nodes into account.
Contribution of multifunctional proteins to the observed trends
While the low functional similarity and weak co- expression of interaction partners are often linked to noise (promiscuous interactions) in the corresponding PPI data [33,37,66–68], they may also reflect a genuine functional behavior, namely of proteins performing multiple cellular functions. How to define such proteins remains, however, a subject of much debate. Some authors focus on proteins performing unrelated molecular functions (moonlighting)[69–72], and others integrate information from functional (molecular and cellular) annotations and/or protein interaction data [41,69]. These different definitions and approaches often yield small and poorly overlap- ping sets of multifunctional proteins (MFPs) for the
same organism (for data on yeast, for example, see Supplementary Section I).
To evaluate the contribution of protein multifunc- tionality to the observed trends, we identified putative MFPs in theS. cerevisiaeproteome. To this end, the GO functional annotations of each yeast protein (including multidomain proteins) were clustered using a metric reflecting the similarity between these annotations [41]. A protein was classified as multi- functional if it is annotated with GO terms belonging to at least two clusters (see Materials and Methods and Supplementary Figs. S7 and S8 for details). The analysis was performed for both the GO BP and MF terms.
By applying this procedure to the fullS. cerevisiae proteome (6437 proteins), we identified a total of 595 putative MFPs on the basis of the GO BP terms and 423 MFPs on the basis of the GO MF terms. These two sets are essentially distinct as only 74 proteins are common to both. For the purpose of the present analysis, we considered mainly the MFPs based on GO BP terms, as we were primarily interested in multiple functions of a protein, most likely to affect the number and types of interactions it forms in the cell.
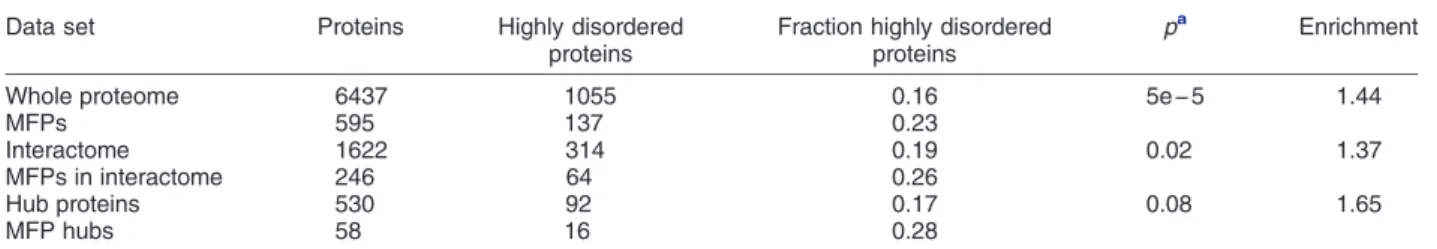
Results show that the identified putative MFPs are enriched in structural disorder (proteins withN30% of their residues in IDRs ≥20 residues). As shown in Table 1, the full set of 595 MF proteins is 44%
enriched in IDRs, relative to the entire proteome. The subset of MFPs that is part of the PPI network is 37%
enriched in IDRs relative to all proteins in the network, whereas MFP hubs are most highly enriched in IDRs (65%), relative to non-MFP hubs in the network. This enrichment is all the more significant considering that MFPs tend to be slightly more abundant than the entire yeast proteome (Supplementary Fig. S9a), a trend that should in principle lower the proportion of IDRs (Fig. 1). The observed enrichment therefore agrees with the view that protein intrinsic disorder may promote more diverse functional roles in the cell[72].
Furthermore, we find that the IDRs of the predicted MFPs display on average higher stickiness values than
Table 1.Intrinsic disorder enrichment in MFPs ofS. cerevisiae
Data set Proteins Highly disordered
proteins
Fraction highly disordered proteins
pa Enrichment
Whole proteome 6437 1055 0.16 5e−5 1.44
MFPs 595 137 0.23
Interactome 1622 314 0.19 0.02 1.37
MFPs in interactome 246 64 0.26
Hub proteins 530 92 0.17 0.08 1.65
MFP hubs 58 16 0.28
Highly disordered proteins are those with≥30% disordered residues
a Pvalues from the two-sample test for equality of proportions (Pearson's chi-squared statistic).
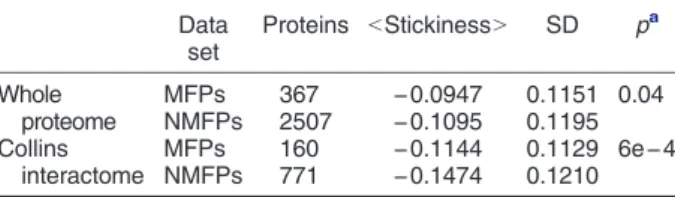
their non-functional complement, when considered in the context of both the whole yeast proteome and the interactome (Table 2). This trend is consistent with the hypothesis presented above that higher stickiness of IDRs relative to surface residues of globular proteins may be linked to the thermodynamics of the IDR mediated functional interactions.
Next we investigate the potential influence of intrinsic disorder and multifunctionality on the prop- erties of their interaction partners. To tease out these influences, we analyzed various properties of the interaction partners of MFPs and their non-MFPs counterpart with the same extreme intrinsic disorder levels: respectively, those with≥30% and those with b10% of their residues in disordered regions.
The results summarized in Fig. 9 (and the table within) show that among highly disordered proteins, the subset of MFPs interacts with more disordered partners on average (31% versus 25% disordered residues in partners of MFPsversusnon-MFPs,p= 4e−3). These partners also tend to display a lower level of functional diversity (average semantic similarity of 0.40 for MFPs versus 0.52 for non- MFPs,p = 4e−3) and weaker gene co-expression (0.33 for MFPsversus0.42 for non-MFPs,p= 1e−3) than their equally disordered non-MFP counterparts (Fig. 9a–c). On the other hand, among the set of most highly structured (least disordered) proteins, Table 2.Average stickiness scores in IDRs of MFP and
non-MFP inS. cerevisiae Data
set
Proteins bStickinessN SD pa Whole
proteome
MFPs 367 −0.0947 0.1151 0.04
NMFPs 2507 −0.1095 0.1195 Collins
interactome
MFPs 160 −0.1144 0.1129 6e−4
NMFPs 771 −0.1474 0.1210
NMFPs, non-MFPs;bStickinessN, average IDR stickiness per protein. More negative values correspond to lower stickiness.
a Pvalues from the two-sample test for equality of proportions (Pearson's chi-squared statistic).
(a) (b) (c)
Fig. 9. Relations of high intrinsic disorder content and the multifunctional nature of protein nodes to the properties of their interaction partners. Panels a–c compare the distributions of the disorder levels, functional similarity (BP SemSim), and the mRNA co-expression levels, respectively, of interaction partners in the two groups of proteins with a high disorder content (≥30% residues in IDRs≥20 residues): putative multi-functional protein nodes of the Collins PPI network[40](dark gray) and non-multi-functional proteins nodes (light gray).Pvalues (computed using the Wilcoxon rank sum test) between the pair of distributions are given in parentheses. The number of data points in each distribution is shown below each boxplot. The horizontal line in each boxplot indicates the median value and the diamond indicates the mean value. Outliers are not depicted. The table at the bottom lists the average values of the corresponding displayed distributions.
the interaction partners of MFPs display on average a similar level of disorder and functional diversity to non-MFPs, while nonetheless maintaining a similar lower level of gene-co-expression as in the highly disordered set (Supplementary Fig. S10). Importantly, consistent with the higher intrinsic disorder in MFPs, 20% of the proteins in the highly disordered set are predicted to be multifunctional, whereas this fraction is only 13% for the more structured set.
Lastly, we note that somewhat surprisingly, MFPs interact on average with fewer partners in the yeast PPI network than their non-MFP counterparts (Supplemen- tary Fig. S9b). Considering that MFPs represent a small fraction of the proteins in the network, this observation may reflect the general bias in the PPI data toward more abundant proteins, which are more likely to form promiscuous interactions[33,37].
Thus, taken together, these observations indicate that multifunctionality contributes significantly to the elevated stickiness of IDRs in comparison to the surfaces of globular proteins. Multifunctionality also increases significantly the propensity of disordered proteins to interact with more disordered and functionally diverse partners.
Concluding Remarks
In this study, we evaluated how intrinsic disorder of proteins and the properties of disordered regions have adapted to mitigate the risk of engaging in non- functional interactions, while at the same time enabling the corresponding proteins to perform diverse cellular functions. To this end, we used information on the protein sequences, 3D structures, and genome-scale data on cellular protein concentrations, gene co- expression, and PPIs in one of the most thoroughly studied model organisms, the yeastS. cerevisiae.
We found that the fraction of highly disordered proteins decreases significantly with increasing pro- tein abundance, in agreement with previous findings [35]. This trend suggests that protein intrinsic disorder is selected against as protein abundance increases, in line with the observation that disorder is associated with deleterious dosage sensitivity in yeast[2].
A significant new finding is that IDRs of highly abundant proteins have adapted their amino acid composition in order to minimize promiscuous interac- tions with other proteins, in a way similar to surface residues of globular proteins[4]. This adaptation has lowered the frequency of “sticky” amino acids found more frequently in protein–protein interfaces and raised the frequency of polar and charged amino acids, which tend to remain solvated even for proteins present at high concentrations in the cell. We find, however, that IDPs/IDRs of≥20 contiguous disordered residues maintain a somewhat higher average sticki- ness than surface residues at all protein abundance levels. This is explained by the lower frequency of less
sticky polar and charged amino acids in IDRs than on the surface of globular proteins.
We propose that the trend toward higher stickiness of IDRs likely reflects the need to provide sufficient binding affinity for the SLiMs-mediated functional interactions to counterbalance the large loss of conformational entropy that generally accompanies these interactions. A good example is the binding of the trans-activator domain (TAD) of p53 to the nuclear coactivator-binding domain (NCBD) of CREB-binding protein (CBP), largely driven by intermolecular hydro- phobic contacts involving two short segments of the disordered portion of p53[73].
Investigating the pattern of interactions made by IDPs/IDRs in the context of the HCS. cerevisiae PPI network yielded further important insight into the balancing act of protein disorder, enabling it to engage in diverse functional interactions while mini- mizing promiscuity. Overall, proteins with a higher level of intrinsic disorder were found to interact more frequently with more highly disordered partners.
These partners also tend to be functionally more diverse, as evident by the reduced similarity of their GO functional annotations and the weaker correlation of their gene expression profiles.
Most importantly still, our study makes significant headway toward assessing the respective contribu- tions of functionalversuspromiscuous interactions to the observed trends. GO functional annotations were used to identify ~ 600 putative MFPs inS. cerevisiae, and these proteins were mapped to and analyzed in the context of the yeast PPI network. Interestingly, we found that MFPs, which represent ~ 20% of the highly disordered proteins in the PPI network (Table 1), make a significant contribution to the trends described above.
They are enriched in IDRs (by 44%–65%, Table 1), their interaction partners tend to be more disordered (p = 4e−3), and the functional similarity of these partners is significantly lower (p = 4e−3 for their partners GO-BP semantic similarity annotations;p = 1e−3 for their partners gene co-expression) (Fig. 9a–c), in comparison to their non-MFPs counterpart.
Moreover, the IDRs of MFPs display higher sticki- ness values than IDRs of their non-multifunctional complement (Table 2), lending support to the idea that the somewhat higher average stickiness of IDRs reflects the thermodynamic requirements of forming specific interactions with cognate proteins, mediated by SLiMs. Indeed, our yeast MFPs do feature, on average, a somewhat higher coverage of SLiMs predicted by the ANCHOR algorithm[74]than non- MFPs (between 32% and 34% for MFPs in the whole proteome and Collins interactome, and 28% for the non-MFPs in both data sets respectively; see Supplementary Fig. S11).
Nevertheless, it is reasonable to assume that a fraction of the interactions formed by both structured proteins and IDPs/IDRs is likely non-functional under certain conditions but may serve as a reservoir for
future adaptation to altered conditions and environ- mental contexts[3,75]. Evidence has, indeed, been accumulating that IDPs/IDRs are frequently involved in intracellular liquid-like compartments, where they form both functional and spurious interactions [55,76]. More data on such cellular assemblies and on the functional interactions involving IDPs/IDRs in specific systems [77] are clearly needed to better evaluate the functional contexts of the trends uncovered in our analysis.
It also remains to be seen if the trends observed here for yeast proteins are shared by other organisms. The study by Levy et al. [4] showed that the stickiness of surface residues in structured human proteins is more weakly anti-correlated to protein abundance than in yeast. This may be attributed to the fact that protein abundance is ill defined in human cells, due to the variety of cell types and to a higher degree of compartmentaliza- tion of proteins in human cells, which relieves some of the pressure to decrease their propensity to engage in promiscuous associations. This may also be the case for IDPs/IDRs, as the latter can be translated into a spatially localized fashion within mammalian cells[36].
Materials and Methods
Data sets
Data on protein sequences abundance levels and half-life
Data on S. cerevisiae protein sequences were taken as provided by the PaxDb version 4.0 (March 2016)[39].
Data on protein abundance levels in yeast S.
cerevisiae, expressed as ppm, a quantity linearly related to the protein copy number in the cell[44], were obtained from PaxDb. We used the integrated organism-level abundance data provided by PaxDB for a total of 6437 yeast proteins. From these data, 1457 proteins with very low abundance levels (b2ppm) were discarded from our analysis, as they were found to have higher variability among individ- ual data sets deposited in PaxDB and therefore considered as less reliable (see Supplementary Fig.
S12).
Data on the steady-state half-life of yeast proteins expressed in minutes were obtained from Ref.[78].
Gene co-expression data
Data on the Pearson correlation coefficient of mRNA expression profiles of S. cerevisiae gene pairs, taken to represent the co-expression levels of the corresponding gene, were extracted from the COXPRESdb[38]. The mRNA profiles were com-
puted from mRNA expression data (microarrays) measured under a large set of different conditions and retrieved from the ArrayExpress database bhttps://www.ebi.ac.uk/arrayexpressN. The expres- sion data were normalized using the robust multi- array average method[79].
PPI data
Data on genome-wide PPIs in the yeast S.
cerevisiaewere taken from the study by Collinset al.
[40]. This study derived an HC PPI network involving soluble yeast proteins, starting from the raw data obtained by affinity purification and mass spectrometry analysis in the two independent high-throughput studies by Kroganet al.[66]and Gavinet al.[80].
The HC“Collins”yeast PPI network was derived using the protein enrichment (PE) statistical scoring scheme to filter out spurious interactions. Applying a PE threshold of≥3.19[40], the“Collins”PPI network contains 9070 HC co-complex associations, com- monly denoted as“interactions”among 1622 distinct proteins (1600 protein with abundance levels N2ppm). The estimated TP/FP ratio for this data set is ~ 30, where TP (true positive) are detected interactions from the positive examples and FP (false positive) are detected interactions from the negative examples. The PPI data set with the associated PE scores was downloaded from bhttp://interactome-cmp.ucsf.edu/N.
In addition, we examined S. cerevisiae PPI data retrieved from the March 2018 release of the BioGRID database [65]. These data include PPIs annotated from the scientific literature, detected by both high- and low-throughput methods of variable stringencies, and include both co-complex and binary interactions. We used the MV data set of BioGRID. In this data set, the reliability criteria for a given interactions are based on the number of experimental systems and publications where the physical interaction between the proteins was detected.
Data on structures of yeast globular proteins A data set of yeast globular proteins was assembled from the PDB (RCSB-PDB)[81] (September 2017).
We selected entries comprising x-ray structures determined at 3-Å resolution or better, which contain only proteins (no DNA or RNA) fromS. cerevisiae, displaying≤90% sequence identity. For these struc- tures, we downloaded both the atomic coordinates and biological assembly assignments. Structures representing membrane proteins (annotated intra- or trans-membrane regions in UniProt[48]or predicted by TOPCONS[82]), and those lacking UniProt[48]
identifiers or protein abundance information in PaxDb [39]or identified as probable errors in QSbio[83](low and very-low confidence) were discarded. This set
was further reduced to a total of 452 structures by retaining entries containing only a single protein chain (e.g., hetero-complexes were not considered). All subsequent calculations were performed on the biologically meaningful assembly state of the protein (Biological Unit).
Gene functional annotations, enrichment analysis, and functional similarity
Functional annotations for yeast proteins were downloaded from the GO [56] (July 2016). Unless otherwise specified, only GO terms based on evidence codes IDA (Inferred from Direct Assay) and IPI (Inferred from Physical Interaction) from the BP and MF ontologies, respectively, were considered for the present analysis. The GO enrichment analysis was performed using the BiNGO [84] plugin for Cytoscape[85].
The extent to which two interacting proteins carry out similar functions was evaluated using theseman- tic similarity measure. The specific measure was that
of Wang et al. [86] implemented in the R-package GOSemSim [87]. This measure evaluates the simi- larity of two GO terms based on both the locations of these terms in the GO graph and their relations to their ancestor terms.
Comparing the Collins and BioGRID PPI networks To justify the use of the Collins PPI network for the bulk of our analysis, we compared various properties of interacting protein pairs in the MV BioGRID and HC Collins yeast PPI networks, respectively, with those of a random network having the same node degree distribution as the Collins network (generat- ed as described below).
The evaluated properties are derived from indepen- dent data types routinely used to gauge the quality and biological relevance of experimentally derived PPI networks. For individual interacting protein pairs in each network, we computed the GO BP semantic similarity score[86], the gene co-expression Pearson correlation coefficient, and the ratio of the protein
(a) (b)
(c) (d)
Fig. 10. Comparing the Collins and BioGRID interactomes ofS. cerevisiae.The HC interactome of Collins[40]and the MV BioGRID interactome[65](March 2018) are compared against each other and to a random PPI network (seeMaterials and Methodsfor detail). Four properties of interacting proteins pairs in the network are compared: (a) Pearson correlation coefficient of mRNA expression profiles (gene co-expression), (b) the semantic similarity of the BP GO annotation (BP SemSim), (c) the ratio of protein abundance levels, and (d) the ratio of protein half-life. (c and d)Pvalues (computed using the Wilcoxon rank‐sum test) between pairs of distributions in the three networks are given in parentheses. The number of data points in each distribution is shown below each boxplot. Data on protein abundance are from PaxDb[39], and those on half-life are from Ref.[78].
abundance levels [38,39]. These values were then averaged over all the interacting pairs in each of the networks.
First, we note that while 42% of the proteins of the larger MV BioGRID network are shared with the HC Collins network, only 14% of the PPI in MV BioGRID are also part of the Collins network (Supplementary Fig. S13a, b). As a result, the proteins defined as“hubs”(protein nodes connect- ed toN10 interaction partners in the network) and those defined as“ends”(proteins connected to only 1 partner) differ substantially (Supplementary Fig.
S13c, d).
Next, our analysis shows (Fig. 10a) that the distribution of the Pearson correlation coefficient of the mRNA expression profiles of interacting pairs for both the HC Collins and MV BioGRID networks is significantly different from the distribution for the random network. On the other hand, the distribution for the HC Collins network is bimodal, with a significant fraction of interacting pairs (~ 57%, 4387 out of 7636 pairs with a coexpression correlation value) displaying highly correlated expression pro- files (≥0.5), shifting it further toward higher values relative to the random distribution than the distribu- tion computed for the MV BioGRID network. We find, furthermore, that the HC Collins network features a larger fraction of functionally similar interacting pairs (SemSim values ≥0.6) and a smaller fraction of functionally diverse pairs (≤0.4) than the MV Bio- GRID network, and that the SemSim distributions of both networks depart significantly from random (Fig.
10b). In addition, the distributions of the pairwise protein abundance ratio and the half-life ratio of interacting protein pairs are more significantly shifted toward lower values in the HC Collins network than for the MV BioGRID network, although the distribu- tions for both networks differ significantly from random (Fig. 10c, d).
On the basis of this multipronged comparison, we conclude that the HC Collins network is of higher quality than the MV BioGRID network, confirming earlier findings that the HC Collins network is one of the highest-quality interaction networks of the soluble S. cerevisiaeproteome and therefore is the network of choice for the present analysis. Many of its interac- tions were indeed confirmed by subsequent publica- tions, allowing for the generation of CYC2008, a widely used updated version of annotated yeast protein complexes[88].
Generation of random networks
Ten different random networks were created, which preserve the number of protein nodes and the node degree distribution of the Collins PPI network [40].
Starting from the Collins network, binary interactions (network edges) were randomly shuffled using the sample_degseqfunction in theigraphpackage for R
bhttp://www.igraph.org/rN, avoiding repeating inter- actions and self-loops. Next, the identities of the protein nodes were randomly shuffled using the sample function without replacement in the base package of Rbhttp://www.r-project.orgN. The resulting networks were pruned to eliminate the few interactions that were also in the Collins network, yielding essentially identical random networks shown in the Supplementary Fig. S14.
Residue properties and amino acid propensities The stickiness scale of Levy and Teichmann[4]
(values were taken from the Supplementary Material of Ref.[4]) was used to evaluate the propensity of a protein residue to be part of an interaction interface with another protein. In addition, we used the Kyte– Doolittle amino acid hydrophobicity scale [51].
Surface residues were defined as those with a relative solvent-accessible surface area (RSASA) of at least 20, with RSASA = SASAprotein/SASAfree, where SASAproteinis the accessible surface area of the residue in the protein structure and SASAfreeis the accessible surface area of the corresponding amino acid free in solution. The accessible surface area values were computed using FreeSASA[89].
The amino acid composition of IDRs and surface residues of globular proteins, respectively, was evaluated using a propensity score. The latter was derived by calculating the fractional occurrence (f) of each individual amino acid with respect to the total number of residues in each data set (IDRs or surface residues in the data set of globular proteins). Amino acid propensities (p) were then calculated usingp= log10(fA/fB), wherefA is the fractional contribution of an amino acid for a given residue subset (IDRs or protein surfaces) and fB is its average fraction computed for the full yeast proteome.
Prediction of intrinsically disordered and aggregation-prone residues
Residues likely to be part of IDRs were predicted from the amino acid sequence by the IUPred software [43], using the long-window option. To decrease the level of noise, we considered only segments of at least 20 consecutive residues predicted to be disordered. In addition, we analyzed predicted IDRs from the meta- predictor MobiDB-lite [90] and observed the same trends as with IDRs inferred by IUPred. These are the following: (1) the negative correlation between the fraction of highly disordered proteins and protein abundance levels gets stronger when filtering out proteins with an abundance ofb2 andb8 ppm [rS =
−0.26 (p = 0.48) and rS = −0.84 (p = 2e−3), respectively]; (2) at the protein abundance cutoff of 2ppm, there is a negative correlation between protein abundance and IDR stickiness (rS=−0.29,p= 1e−47);
and (3) and a significant but weak negative correlation
between protein abundance and IDR hydrophobicity (rS =−0.07, p = 5e−4). Moreover, we observed a very high correlation between the amino acid propensities in IDRs predicted by both software tools (rS = 0.98,p = 6e−6) using the whole yeast proteome as reference.
The propensity of amino acid residues to be aggregation prone was evaluated from the amino acid sequence using respectively the TANGO[52]
and PASTA2.0[53]software. TANGO, which predicts aggregation prone regions in unfolded polypeptide chains, was applied using the default parameters for pH, temperature, and ionic strength (7298 K and 0.1, respectively). An aggregation prone region was defined as a segment of at least five con- secutive residues with a β-aggregation propensity of minimum 5%.
PASTA2.0, a predictor of residues likely to be part of amyloid fibrils[53], was applied using parameters optimized to achieve 90% specificity. The file containing the “best pairs”was used to retrieve the putative amyloid forming regions.
Identifying putative MFPs
Putative MFPs in the genome of S. cerevisiae were identified on the basis of publically available functional annotations using a slight modification of the procedure of Khanet al.[41].
In summary, protein annotations were retrieved from UniProtKB Swiss-Prot database bhttp://www.
uniprot.org/N. GO terms[56,57]from all UniProtKB evidence codes were extracted. Next, the GO terms belonging to MF and BP category were clustered separately. Clustering was done using single linkage clustering [91] based on the sematic similarity among GO terms, with similarity cutoff of 0.1 and 0.5. A protein was classified as multi- functional if it is annotated with GO terms (a) belonging to two or more clusters with sematic similarity cutoff of 0.1 and (b) belonging to four or more clusters with sematic similarity cutoff of 0.5 (Supplementary Figs. S7 and S8). These cutoff values were empirically determined (2014) [41].
When only MF GO terms are available, the number of clusters based on BP terms was assigned as 0 (zero). Multi-domain proteins were included in the analysis. Ideally Multi-functional proteins identified by this approach should be validated on the basis of manual curation of the literature and other sources [41]. However, this very time-consuming process was therefore foregone in this study, but may be performed in the future, using recently developed text-mining techniques[92].
In the present study, we considered protein clusters derived on the basis of the GO BP terms. Results were essentially unchanged when considering the union of putative MFPs inferred using, respectively, the MF and BP GO annotations.
Statistical analyses
The statistical analyses and the corresponding graphical representations were performed using custom R scripts. To evaluate the relationships between variables, we used the non-parametric Spearman's rank correlation coefficient (rS) and its pvalue as implemented in thecor.testfunction in R Statspackage. To compare pairs of distributions of the same variable, the non-parametric Wilcoxon rank‐sum (Mann–WhitneyU) test was used. In case of multiple distribution comparison, the Bonferroni correction was applied. To compare the fraction of elements in different groups, we used the two- sample test for equality of proportions with continuity correction (Pearson's chi-squared statistic).
Acknowledgments
We thank Wim Vranken and Tamas Lazar for helpful discussions, and are particularly grateful to Emmanuel Levy for critical reading of the manuscript and helpful suggestions. M.M.-C. acknowledges support from the Mexican National Council of Science and Technology (CONACYT) PhD Fellowship (215503). This work was supported in part by the Odysseus Grant G.0029.12 from the Research Foundation Flanders (FWO) and OTKA grant K124670 to P.T., and by a grant from the National Institute of General Medical Sciences of the National Institutes of Health (R01GM123055) and the National Science Foundation (DMS1614777, CMMI1825941) to D.K.
Competing Interests: All authors declare no competing interests.
Appendix A. Supplementary data
Supplementary data to this article can be found online athttps://doi.org/10.1016/j.jmb.2019.03.008.
Received 23 November 2018;
Received in revised form 25 February 2019;
Accepted 3 March 2019 Available online 13 March 2019
Keywords:
protein abundance;
multifunctional proteins;
intrinsic structural disorder;
protein interaction network;
yeast
Abbreviations used:
BP, biological process; FP, false positive; GO, Gene Ontology; HC, high confidence; IDP/R, intrinsically disordered
![Fig. 10. Comparing the Collins and BioGRID interactomes of S. cerevisiae. The HC interactome of Collins [40] and the MV BioGRID interactome [65] (March 2018) are compared against each other and to a random PPI network (see Materials and Methods for detail)](https://thumb-eu.123doks.com/thumbv2/9dokorg/1331781.107784/15.892.127.763.537.972/comparing-collins-biogrid-interactomes-cerevisiae-interactome-interactome-materials.webp)
