University of Sopron (Soproni Egyetem) The Simonyi Károly Faculty of Engineering,
Wood Sciences and Applied Arts
The Cziráki József Doctoral School of Wood Sciences and Technologies
ATR-FTIR Study of the Interaction of CO
2with Bacterial cellulose-Based Membranes
Author: YANIN HOSAKUN
Research Supervisor: Prof. Dr. LEVENTE CSÓKA
Sopron
2017
Membranes
Értekezés doktori (PhD) fokozat elnyerése érdekében
a Soproni Egyetem Cziráki József Faanyagtudomány és Technológiák Doktori Iskolája Rosttechnikai és nanotechnológiai tudományok programja
Írta:
YANIN HOSAKUN
Készült a Soproni Egyetem Cziráki József Faanyagtudomány és Technológiák Doktori Iskola Rosttechnikai és nanotechnológiai tudományok programja keretében
Témavezető: Prof. Dr. Csóka Levente Elfogadásra javaslom (igen / nem)
(aláírás)
A jelölt a doktori szigorlaton …... % -ot ért el,
Sopron, 2016.11.29.
………...
a Szigorlati Bizottság elnöke
Az értekezést bírálóként elfogadásra javaslom (igen /nem)
Első bíráló (Dr. …... …...) igen /nem
(aláírás) Második bíráló (Dr. …... …...) igen /nem
(aláírás) (Esetleg harmadik bíráló (Dr. …... …...) igen /nem
(aláírás)
A jelölt az értekezés nyilvános vitáján…...% - ot ért el
Sopron,
………..
a Bírálóbizottság elnöke
A doktori (PhD) oklevél minősítése…...
………..
Az EDHT elnöke
“ATR-FTIR Study of the Interaction of CO2 with Bacterial cellulose-Based Membranes”, was carried out by myself for the degree of Doctor of Philosophy under supervision of Dr. Levente Csóka, Institute of Wood Based Products and Technologies, University of Sopron. The whole work is the result of my own investigation except where duly cited. The sources of information have been used and acknowledged in the content as well as the reference section.
Sopron, March 17th, 2017
………..
Yanin Hosakun
Bacterial cellulose (BC) was used as an active material for fabrication of the membrane for CO2 adsorption study. The BC-membranes were further modified with silk fibroin protein and ZnO nanoparticles in order to increase the number of sites that may bind CO2. The morphologies of all BC-based membranes were characterized by FESEM microscopy indicating that they were formed into a fine crisscross mesh structure with entangled nanofibrils. The interaction of the CO2 with the membranes was investigated by means of ATR-FTIR spectroscopy. Heated membranes above 100°C, in order to remove some trapped CO2 from atmosphere, were used as the control samples. After pressurizing the membranes in CO2 at 3 bar for 8h, 16h, and 24h, FTIR spectra were recorded and compared to the spectra of the controls. The interaction of the membrane materials with CO2 were studied by examining two regions of the spectra:
740-610 cm-1 (bending vibrations of CO2) and 2400-2300 cm-1 (asymmetric stretching vibrations of CO2). The envelopes of the bending and asymmetric stretching modes were deconvoluted into particular peaks by PeakFit software. The increase of the CO2
absorbance in bending and asymmetric stretching features after CO2 adsorption, together with the appearance of extra bands, is an evidence of CO2 sorption to the membranes. Therefore, infrared studies showed that there was a strong interaction of CO2 with BC-based membrane suggested by the Lewis acid-base type of interaction.
The modified BC membranes spectra display broader and more splitting lines in both bending and asymmetric stretching modes signifying the introduction of silk fibroin and ZnO nanoparticles could increase the number of active sites for interaction with CO2 to form more complex species. Additionally, it have been found that the specific sites in the modified BC membranes could facilitate the interaction with CO2. These modified BC membranes could interact with CO2 rapidly by demonstrating the optimum ability since 8h duration. On the other hand, the basic BC membrane was able to achieve the highest ability and be saturated by CO2 after adsorption for 16h.
Table of Contents
Chapter Page
Chapter I Introduction and Problem Statement……… 12
1.1 The CO2 Problems……… 12
1.1.1 Greenhouse Gases and Global Warming……….. 12
1.1.2 CO2 in Natural Gas………... 14
1.2 CO2 Capture……….. 15
1.2.1 Chemical/Physical Absorption………. 15
1.2.2 Adsorption……… 17
1.2.3 Cryogenic Separation………... 17
1.2.4 Membrane Technologies……….. 18
1.2.5 Comparison between Membrane Technology and Other Methods for CO2 Removal………... 18
1.3 Membrane Technology………. 19
1.3.1 Membrane Materials………...19
1.3.1.1 Inorganic Membranes………... 20
1.3.1.2 Organic Membranes………...20
1.3.1.3 Composite Membranes………. 31
1.3.2 Study of the Interaction of Membrane Materials with CO2 by FTIR Spectroscopy……… 37
1.4 Lewis Acid-Base Interactions………... 39
1.5 Problem Statement……… 42
Chapter II Materials and Methods……… 43
2.1 Materials………. 43
2.2 Experimental details………... 43
2.2.1 Purification of Raw Nata de coco and Preparation of Dried Bacterial Cellulose Films………... 43
2.2.2 Preparation of Microfibrillated Bacterial Cellulose Suspension………….. 44
2.2.3 Preparation of Nanocrystalline Bacterial Cellulose Suspension………….. 44
2.2.4 Preparation of ZnO Nanoparticles Suspension……….44
2.2.5. Purification of Silk Cocoon (Degumming) and Preparation of Nano-Silk
Fibroin Suspension………... 45
2.2.6 Fabrication of Bacterial Cellulose-Based Membranes by Evaporation Casting………. 45
2.2.7 ATR (Attenuated Total Reflection)-FTIR Spectroscopy Studies of the Interaction with CO2……… 46
2.3 Characterizations of the BC-Based Membranes……… 47
2.3.1 Structural Analysis of BC-Based Membranes by ATR (Attenuated Total Reflection)-FTIR Spectroscopy………... 47
2.3.2 Morphological Analysis by FESEM Microscopy……… 47
Chapter III Results and Discussion……….. 48
3.1 Structural Analysis by ATR (Attenuated Total Reflection)-FTIR Spectroscopy……….. 48
3.2 Morphological Analysis by FESEM Microscopy……….. 51
3.3 ATR (Attenuated Total Reflection)-FTIR Spectroscopy Studies of the Interactions with CO2………. 54
3.3.1 Bending (υ2) Vibrational Mode of CO2……… 54
3.3.2 Asymmetric Stretching (υ3) Vibrational Mode of CO2……… 65
3.3.3 Carbonate Species Vibrational Region………. 79
3.3.4 Integrated Area under IR Absorption Bands of CO2 Vibrational Modes…. 81 Chapter IV Conclusions………83
Chapter V References………... 87
List of Figures
Figure Page
Figure 1. CO2 levels in atmosphere (“Carbon Dioxide”, 2016)………... 13 Figure 2. The relative change of global surface temperature to 1951-1980 average temperature (“Global Temperature”, 2015)……….. 13 Figure 3. Physisorption and Chemisorption of CO2 (Berger and Bhown, 2011)…....17 Figure 4. Morphologies of polymeric membranes; symmetrical membranes are the two- top illustrations, a) microporous membrane and b) non-porous dense membrane, while asymmetric membranes are the two-bottom illustrations,
c) Loeb-Sourirajan membrane and d) thin-film composite membrane……… 22 Figure 5. Biochemical pathway for cellulose synthesis in Acetobacter xylinum (Jonas and Farah, 1998)………... 25 Figure 6. Inter- and intra-hydrogen bonding of bacterial cellulose (Esa et al., 2014)………. 27 Figure 7. Schematic representation of the formation mechanism of AgCl nanoparticles (Hu et al., 2009)……… 28 Figure 8. Structure of silk cocoons
(Bunnell, “Silk Fibroin”; “Structure of cocoon silk”)……….. 30 Figure 9. The amino acid consequence of silk fibroin (“Fibroin”, 2015)……… 31 Figure 10. Polymer-inorganic nanocomposite membrane’s types; (a) polymer and inorganic phases connected by covalent bonds and (b) polymer and inorganic phases connected by van der Waals force or hydrogen bonds (Cong et al., 2007)………….. 32 Figure 11. CO2 adsorption on ZnO surface (Lavalley et al., 1982)……….. 33 Figure 12. Structure of (a) bent CO2; (b) bicarbonate; (c) monodentate carbonate; (d) bidentate carbonate; and (e) carboxylate formed on the ZnO surface……….. 34
Figure 13. Possible molecular orientations; (a−d) monodentate, (e, f) bidentate, and (g, h) tridentate adsorption modes for CO2 on ZnO surfaces as represented by a ZnO (0001̅) surface. Carbon atom, adsorbate oxygen, lattice oxygen, and zinc represented by dark
gray, yellow, red, and blue spheres, respectively………. 35
Figure 14. Most energetically favorable configurations for adsorbed CO2 on (a) ZnO (0001̅), (b) ZnO (0001), (c) ZnO (101̅0), (d) ZnO (112̅0), and (e) ZnO (112̅1). Atoms engaged in the adsorbate-substrate interaction were labeled. Upper panels show side views, while lower panels indicate top views. Carbon atom, adsorbate oxygen, lattice oxygen, and zinc represented by dark gray, yellow, red, and blue spheres, respectively………... 36
Figure 15. Proposed intermolecular interaction between hydroxyl group/carbonyl group and CO2 (Gabrienko et al., 2016)………. 41
Figure 16. CO2-methylacetate complexes (lengths are in A°)………. 41
Figure 17. Dried bacterial cellulose (BC) films in a silicone tray……… 44
Figure 18. Silk cocoons from silk worm Bombyx Mori……….. 45
Figure 19. Flow process diagram of BC-based membranes preparation……….. 46
Figure 20. Schematic representation of the pressurization process……….. 47
Figure 21. FTIR spectra in the 4000-400 cm-1 region of; (a) BC membrane, (b) ZnO- modified BC membrane, and (c) silk fibroin-modified BC membrane……… 48
Figure 22. Schematic illustration of the Teflon-supported bacterial cellulose (BC) membrane and its interaction with CO2. Each membrane contained cellulose microfibrils and nanocrystals. In order to increase their affinity towards CO2 they were additionally modified with a) silk fibroin protein or b) with ZnO nanoparticles. c) The image of the pure Teflon-supported BC membrane………. 51
Figure 23. FESEM images of basic BC membrane……….. 51
Figure 24.FESEM images of silk fibroin-modified BC membrane………. 52
Figure 25. FESEM images of ZnO nanoparticles-modified BC membrane…………. 53
Figure 26. ATR-FTIR spectra of BC membranes in the bending mode region (740-610 cm-1) of CO2 in all conditions: after heating above 100°C (control) and after pressurizing with CO2 at 3 bars for 8 h, 16 h and 24 h……… 55 Figure 27. ATR-FTIR spectra of silk fibroin-modified BC membranes in the bending mode region (740-610 cm-1) of CO2 in all conditions: after heating above 100°C (control) and after pressurizing with CO2 at 3 bars for 8 h, 16 h and 24 h…………... 56 Figure 28. ATR-FTIR spectra of ZnO-modified BC membranes in the bending mode region (740-610 cm-1) of CO2 in all conditions: after heating above 100°C (control) and after pressurizing with CO2 at 3 bars for 8 h, 16 h and 24 h……… 57 Figure 29. ATR-FTIR spectra of BC membrane; control sample and sample after pressurizing with CO2 16h, in the bending mode region (740-610 cm-1) of CO2 after resolved into particular peaks by PeakFit………. 58 Figure 30. ATR-FTIR spectra of silk fibroin-modified BC membrane; control sample and sample after pressurizing with CO2 8h, in the bending mode region (740-610 cm-1) of CO2 after resolved into particular peaks by PeakFit……… 59 Figure 31. ATR-FTIR spectra of ZnO-modified BC membrane; control sample and sample after pressurizing with CO2 8h, in the bending mode region (740-610 cm-1) of CO2 after resolved into particular peaks by PeakFit……….61 Figure 32. ATR-FTIR spectra of BC membranes in the asymmetric stretching mode region (2400-2300 cm-1) of CO2 in all conditions: after heating above 100°C (control) and after pressurizing with CO2 at 3 bars for 8 h, 16 h and 24 h………. 65 Figure 33. ATR-FTIR spectra of silk fibroin-modified BC membranes in the asymmetric stretching mode region (2400-2300 cm-1) of CO2 in all conditions: after heating above 100°C (control) and after pressurizing with CO2 at 3 bars for 8 h, 16 h and 24 h……… 66 Figure 34. ATR-FTIR spectra of ZnO-modified BC membranes in the asymmetric stretching mode region (2400-2300 cm-1) of CO2 in all conditions: after heating above 100°C (control) and after pressurizing with CO2 at 3 bars for 8 h, 16 h and 24 h…... 67
Figure 35. ATR-FTIR spectra of BC membrane; control sample and sample after pressurizing with CO2 16h, in the asymmetric stretching mode region (2400-2300 cm- 1) of CO2 after resolved into particular peaks by PeakFit……….69 Figure 36. ATR-FTIR spectra of silk fibroin-modified BC membrane; control sample and sample after pressurizing with CO2 24h, in the asymmetric stretching mode region (2400-2300 cm-1) of CO2 after resolved into particular peaks by PeakFit…………... 70 Figure 37. ATR-FTIR spectra of ZnO-modified BC membrane; control sample and sample after pressurizing with CO2 24h, in the asymmetric stretching mode region (2400-2300 cm-1) of CO2 after resolved into particular peaks by PeakFit…………... 71 Figure 38. Possible mechanisms of the interactions of the CO2 with a) BC (hydroxyl), b) silk fibroin (amide) functional groups, and c) ZnO nanoparticles (formation of the bicarbonate (left) and monodentate carbonate species (right)) (Galhotra and Grassian, 2010)………. 77 Figure 39. Possible complexes of CO2 with (a) bacterial cellulose and with (b) silk fibroin; blue, red, yellow, and gray spheres represented as carbon, oxygen, nitrogen, and hydrogen atom, respectively………. 78 Figure 40. ATR-FTIR spectra of BC-based membranes in the range of 1700-1200 cm-
1………. 80
Figure 41. Integrated area of; a) the ν2 CO2 bending (689-644 cm-1) absorption bands and b) the ν3 CO2 asymmetric stretching (2375-2310 cm-1) absorption bands versus conditions of CO2 exposure (control, 8h, 16h, and 24h)……….. 82
List of Tables
Table Page
Table 1. Some of principle membrane suppliers (Baker and Lokhandwala, 2008)…. 21 Table 2. Examples of Lewis acids and Lewis bases
(“Preparation and reactions of carboxylic acids”)……… 40 Table 3.Carbon dioxide bending vibrational band positions from the deconvoluted BC- based membrane spectra………... 62 Table 4. Carbon dioxide asymmetric stretching vibrational band positions from the from the deconvoluted BC-based membrane spectra……… 74 Table 5. FTIR peak wavenumbers of cellulose, silk fibroin, and ZnO nanoparticles according to the literature (Fan et al., 2012; Zhang et al., 2012; Oliveira et al., 2015;
Tsalagkas, 2015; Wang et al., 2016)………100 Table 6. IR peak wavenumbers of different carbonate species formed after interaction with CO2 according to the literature (Galhotra and Grassian, 2010)………...101
CHAPTER I
INTRODUCTION AND PROBLEM STATEMENT
1.1 The CO2 Problems
1.1.1 Greenhouse Gases and Global Warming
Greenhouse effect is a natural process which atmospheric gases absorb infrared radiation resulting in trapping of heat. Gases that absorb energy, on the other hand, slowing the rate at which the energy escapes to space are called Greenhouse gases.
These gases act like a blanket insulating the Earth. The Greenhouse effect plays an important role in shaping the earth’s climate. However, the changes in climate are not only owing to natural processes, human activities, such as burning fossil fuels, industrialization, and deforestation, also contribute to enhance the greenhouse effect.
This enhanced greenhouse effect results from an increase in the concentrations of the greenhouse gases which influences on the increasing in global mean temperature (“The Greenhouse Effect and Climate Change”, 2014; “Overview of Greenhouse Gases”, 2016; “Understanding Global Warming Potentials”, 2016).
Greenhouse gases comprise of carbon dioxide (CO2), water vapor (H2O), methane (CH4), nitrous oxide (N2O), ozone (O3), chlorofluorocarbons (CFCs), etc. It is interesting to note that the majority of emissions are CO2. Since 1927 to 2006, the CO2
emissions released from industry and combustion of fossil fuels have increased from 1 billion tons per year to 8 billion tons per year. CO2 is a significant contributor to the global warming. It is emitted by human activities, natural processes; respiration and volcanic eruptions, and a by-product of the combustion of fossil fuels (“The top Ten Green House Gases”, 2009; “The Greenhouse Effect and Climate Change”, 2014; “A blanket around the Earth”, 2016). The CO2 emission is mainly come from electricity generation, transportation, industrial and residential use. The concentration of CO2 has increased by 40% after the industrial revolution. The atmospheric CO2 levels in recent years are illustrated in Figure 1. CO2 is the fourth most abundant gas in atmosphere and is uniformly distributed over the Earth’s surface with a concentration of about 404 ppm as shown in the graph. Its concentration has been rising annually (Galhotra and Grassian, 2010; Sun et al., “Coal Conversion and utilization for reducing CO2 emissions from a power plant”; “Carbon Dioxide”, 2016).
Figure 1. CO2 levels in atmosphere (“Carbon Dioxide”, 2016).
The change in global surface temperature relative to 1951-1980 average temperatures is demonstrated in Figure 2. As can be seen, in 2015, it ranks as the warmest on record.
Figure 2. The relative change of global surface temperature to 1951-980 average temperature (“Global Temperature”, 2015).
Since the levels of CO2 concentration released into the atmosphere have enhanced annually resulting in an increase in global temperature obviously, the issue of CO2
emission is great concerned (Sun et al., “Coal Conversion and utilization for reducing CO2 emissions from a power plant”). CO2 has a high positive radiative forcing of 1.66 w/m2 (Galhotra and Grassian, 2010). Radiative forcing is the measurement of the
change in the balance between radiation coming into the atmosphere and radiation going out, hence contributing to climate change. If its value is positive, warming the atmosphere, on the contrary, a negative value results in cooling of the atmosphere. For this reason, the large amount emissions of CO2 into the atmosphere are possible to warm the surface of the Earth. Besides, CO2 has a long lifetime remaining in the atmosphere and thus it is a very considerable factor leading to global warming (Galhotra and Grassian, 2010; “Radiative Forcing”, 2011).
1.1.2 CO2 in Natural Gas
Natural gas is a fossil fuel. It originates from the remains of sea plants and animals which were buried on the ocean floor covered by layers of soil, sand and rock. Over millions of years, they were buried deeper and deeper. These organisms were exposed to heat and pressure as a result of being highly compressed underneath thousands of meters of soil and rock. These forces transformed the once living organisms into natural gas (“What is Natural Gas?”). The worldwide usage of natural gas is about 100 trillion scf (standard cubic feet) per year. From the estimation of total energy consumption by each type of fuel in 2030, natural gas will be the third demand fuel in that year. In addition, every sector need natural gas as energy consumption such as transportation (natural gas will be consumed around 3%), industrial (37%), residential and commercial (78%), and electric power (15%). It means that natural gas will be increasingly consumed in the future because it is a clean source of energy. However, all natural gas requires some treatment before it enters the pipeline to meet pipeline specifications. The larger demand of using natural gas leads to the larger market for industrial gas separation processes (“What is Natural Gas?”). Raw natural gas consists of various components depending on the source. Generally, methane is the main composition (about 75% - 90% of total) with other light hydrocarbons, such as ethane, propane, and butane and it also contains small amount of other higher hydrocarbons. Additionally, other impurities for example water, carbon dioxide, nitrogen, and hydrogen sulfide are composed of raw natural gas (Baker and Lokhandwala, 2008). Corrosion of pipeline by acidic gases has been one of the major problem in the gas and oil industry. One of the most interested in corrosion study is CO2 in the pipeline of gas and oil industry which
can cause failure on the equipment and thus can disrupt the oil and gas production. The basic CO2 corrosion reaction mechanisms are shown in the equations (1) and (2), CO2(g) CO2(aq) (1)
CO2 + H2O H2CO3 (2)
From equation (2), carbonic acid is obtained and then it dissociates into bicarbonate and carbonate in two steps as in equations (3) and (4),
H2CO3 H+ + HCO-3 (3) HCO-3 H+ CO2-3 (4)
CO2 corrosion is an electrochemical reaction with the overall reaction given in equation (5),
Fe + CO2+ H2O FeCO3 + H2 (5)
which is the formation of a corrosion product FeCO3 (Koteeswaran, 2010). To meet the pipeline specifications for natural gases, CO2 content should not over 2-5%, hence, the removal of CO2 is the crucial process (Simons, 2010).
1.2 CO2 Capture
According to various problems occur from the presence of CO2, the strategies for CO2 management have gained great importance in the scientific community and the public. One of the main methods for CO2 management is the direct capture of CO2 from the source of release (Galhotra and Grassian, 2010). Several techniques for CO2 capture, including absorption/adsorption, membrane technologies, cryogenic separation, and other options have been introduced (Plasynski and Chen, 2000; “CO2 Capture Methods”).
1.2.1 Chemical/Physical Absorption
Chemical absorption is an exothermic reaction between a sorbent and CO2 at low temperature, forming a weakly bonded intermediate compound. After that, the reaction is reversed at higher temperature so called regeneration which produces the original
solvent and a CO2 stream. Chemical absorption process consists of an absorber and a stripper (desorber) where absorbent is thermally regenerated. Thence, this process is a reversible chemical reaction of CO2 with an aqueous alkaline solvent, usually an amine.
After the regeneration, a pure stream of CO2 is sent to compress for the subsequent transportation and storage while the regenerate solvent is then sent back to the absorber.
The advantages of the chemical absorption technology are that it has been commercialized for many decades, it is the most matured technology for CO2 capture, and it is suitable for retrofitting of the existing power plant. While, many drawbacks also exist including low CO2 loading capacity, large instrument size, high instrument corrosion rate, amine degradation by other gases mixed with CO2 which induces a high absorbent makeup rate, and high energy consumption during high temperature regeneration. Furthermore, energy is required for compressing the CO2 to the conditions needed for storage and operate the pumps and blowers in the process. In absorption step, the CO2 loading capacity is limited by the quantity of the active component of the solution. If it is saturated, only a minor loading could be achieved by physical absorption in the solution. The extensively absorbents for CO2 capture in chemical absorption are alkanolamines which their degradations cause economic, operational, and environmental problems. However, the relatively high selectivity and a relatively pure CO2 stream could be obtained from the chemical absorption (Kothandaraman, 2010;
Wang et al., 2011; Yu et al., 2012; Li et al., 2013).
Physical absorption of CO2 into a solvent is based on Henry’s law. The solubility of CO2 within the solvents depends both on partial pressure and temperature of feed gas. At high pressure and low temperature, CO2 is absorbed, whereas, CO2 is desorbed at reduced pressure and increased temperature. Generally, physical solvents have low affinity towards acid gas, hence, these solvents are favored when feed gas has high amount of CO2 and low purity requirements in the product. Common solvents are Selexol (dimethyl ethers of polyethylene glycol) and Rectisol (methanol). The physical absorption has been broadly applied to several industrial processes such as natural gas, synthesis gas, and hydrogen production with high CO2 contents (Wang et al., 2011; Yeo et al., 2012; Yu et al., 2012).
1.2.2 Adsorption
As the chemical absorption possesses many drawbacks, solid adsorption processes are introduced and studied to overcome the problems from the chemical absorption process. Adsorption is the process that involves the attachment of gas or liquid to the surface of a solid (active site) by either chemical or physical attraction. In physical adsorption, the molecules of gas are attracted to the surface of sorbent by Van der Waals forces with a low heat of adsorption. While, in chemical adsorption, the gas molecules undergo a chemical reaction for binding with certain sites on the sorbent and have much higher heat of adsorption as exhibited in Figure 3. Adsorbents that used for CO2 removal include activated carbon, alumina, metallic oxides, and zeolites. The adsorbent can be regenerated by the application of heat (so called temperature swing adsorption), or the reduction of pressure (so called pressure swing adsorption). In temperature swing adsorption, the system is heated until the attached gases are released from the adsorbent bed, on the other hand, pressure swing adsorption involves reducing the pressure of the scrubber until trapped gases are driven from the adsorbent bed. The temperature swing adsorption is more time consuming and requires larger adsorbent beds compared to pressure swing adsorption (Anderson and Newell, 2004; Wang et al., 2011; Yu et al., 2012).
Figure 3. Physisorption and Chemisorption of CO2 (Berger and Bhown, 2011).
1.2.3 Cryogenic Separation
Cryogenic separation undergoes the compression and cooling of gas mixtures in multiple stages to induce phase changes in CO2 and other gases leading to gas mixture separation. Owing to the constant need for compression and refrigeration, cryogenic processes are energy intensive. It separates CO2 from the flue gas stream by condensation, by which CO2 condenses at -56.6°C at atmospheric pressure. This process
is suitable for treating the gas streams with high CO2 concentrations as it is complicated by contaminants. These impurities, for instance, water vapor, SO2 and NOx, can result in the formation of CO2 frost and ice formation which plug equipment and simultaneously obstruct the cryogenic processes (Anderson and Newell, 2004; Wang et al., 2011).
1.2.4 Membrane Technologies
Membrane technologies have played a significant role in various environmental and energy processes e.g. CO2 capture, natural gas sweetening, biogas upgrading, hydrogen production, etc. and can be an alternative way to the traditional methods in terms of energy requirements and economic costs. The energy efficiency and simplicity of the membrane method are attractive benefits for CO2 capture applications. In 1961, Loeb and Sourirajan invented the first asymmetric cellulose acetate membranes. Firstly, almost researches of membranes were mainly for reverse osmosis applications. Gas separation membranes were first commercialized in 1977 when Monsanto/Perma released their hydrogen recovery system. Since the success of them and other membrane systems by Cynara, Separex and Generon led to great innovation during 1980s and 1990s for membrane materials. These development results in gas separation efficiency and membrane durability enhancement as well as making the membranes commercially competitive with the existing technologies (Scholes et al., 2008; He and Hägg, 2012).
1.2.5 Comparison between Membrane Technology and Other Methods for CO2 Removal
The most well-known method for CO2 removal from natural gas and in power plants is the selective physical or chemical absorption of CO2 by a solvent (aqueous alkanolamine solutions). However, there are a lot of drawbacks in amine absorption such as corrosion of equipment, instability in the presence of oxygen, high energy consumption, high liquid losses due to evaporation of the solvent in the stripper (Simons, 2010), requires high maintenance, and expensive, thick walled and heavy absorber tower. Besides, another conventional process; adsorption process, is not also attractive because of its expensive and low efficiency, requires pre-treatment, and
produces large amounts of waste water and sludge. According to these drawbacks of conventional processes, membrane technology has become a promising approach as compared to conventional processes (Yeo et al., 2012). Membrane technology plays a crucial role in economics, safety, environment and technique compared with the conventional operation (Bernardo and Clarizia, 2013). The equipment of membrane separation process is installed easily because of its modular design. The membrane technology has a high energy efficiency, low weight, a high area-to-volume ratio (Simons, 2010), and higher recovery of the desired gaseous effluent that can be reused for multiple purposes (Abedini and Nezhadmoghadam, 2010). Further, other advantages of this technique include low capital and operational cost, simple operations, environmental friendly, and low maintenance required (Yeo et al., 2012).
1.3 Membrane Technology
One example of the membrane applications is used for CO2 capture in the natural gas process. Owing to the low energy requirements and the ease of scale-up and small size of membrane modules in off-shore installations of the membrane processes for CO2
removal from natural gas, the solubility and diffusion of CO2 in polymer membranes has also been received attention. Usually, membranes for CO2 capture are incorporated with electron donor functional groups having the ability to interact with CO2 in the feed stream, which CO2 acts as a Lewis acid in the presence of Lewis bases (Kasturirangan, 2007).
1.3.1 Membrane Materials
Different types of membranes, for instance, common polymers, microporous organic polymers, fixed-site-carrier membranes, mixed matrix membranes, carbon molecular sieve membranes, as well as inorganic membranes, have been studied to be used in various gas separation processes. The types of materials for producing these membranes can be varied by the requirements of the process. Normally, materials are classified as inorganic and organic materials. Inorganic such as carbon nanotubes, zeolite, ceramic, metallic, metal oxide, etc. However, the membranes are mostly constructed from organic polymers; polymeric materials (Scholes et al., 2008; Ulloa, 2012).
1.3.1.1 Inorganic Membranes
Generally, inorganic membranes are made from ceramics, carbon, or metals. These membranes have been developed since 50 years ago. Because of their well-known thermal and chemical stabilities, and also higher gas permeability or selectivity when compared to polymeric membranes, inorganic membranes have been famous investigated as membranes for gas separation. For instance, zeolite and carbon molecular sieves are remarkable materials with high diffusivity and selectivity (Chung et al., 2007), and ceramic membranes are thermally stable (above 400°C) can be used to separate hydrogen from gasified coal. Basically, inorganic membranes can be divided into two types: nonporous (dense) and porous membranes. Ceramic membranes such as silica, alumina, titanium, glass, and porous metals e.g. silver and stainless steel are the examples of commercial porous inorganic membranes which have high permeabilities but low selectivities. For dense inorganic membranes, Pd metal based membranes and metal oxide membranes are specific in hydrogen separation and oxygen separation, respectively. These membranes are very specific in their separations (Abedini and Nezhadmoghadam, 2010). Nevertheless, because of the expensive and difficulty of inorganic materials to produce large membranes from their fragile structures, organic materials are more attractive due to their ease of production, reproducibility and low cost (Ulloa, 2012).
1.3.1.2 Organic Membranes
One example of organic membranes, Schell and co-workers in 1989 reported advances in cellulosic membranes for gas separation. Cellulose acetate membranes have been used commercially for many gas separation applications, most of which contain either hydrocarbon or polar. The main gas separation applications for cellulose acetate membranes are carbon dioxide removal from natural gas (Schell et al., 1989). Moreover, many principal suppliers of membrane for natural gas separation also use cellulose acetate as a membrane’s material for CO2 separation as presented in Table 1 (Baker and Lokhandwala, 2008).
Table 1. Some of principle membrane suppliers (Baker and Lokhandwala, 2008).
Company Principal natural gas separation
Membrane material
Medal ( Air Liquid) CO2 Polyimide
W.R. Grace CO2 Cellulose acetate
Separex (UOP) CO2 Cellulose acetate
Cynara (Natco) CO2 Cellulose acetate
ABB/MTR CO
2, N
2, C
3+ hydrocarbons
Perfluoro polymers silicone rubber Permea (Air Products) water polysulfone
Also, other polymeric materials have been accepted as membrane materials continuously due to polymeric materials are easy to operate and scale up, low production cost, light in weight, capable to modify the structure of membrane, processable into high surface area membrane, and able to be used in a variety of applications (Moore and Koros, 2005; Cong et al., 2007; Wang and Han, 2012). This type of membrane could be fabricated in different geometries depending on the application. Generally, flat-sheet membranes are simple to produce and can be used in a plate-and-frame or spiral-wound shape. In case of hollow fiber membranes, an extrusion process would be required with specialized machinery and strict quality control (Ulloa, 2012). Morphology of polymeric membranes is illustrated in Figure 4.
Figure 4. Morphologies of polymeric membranes; symmetrical membranes are the two- top illustrations, a) microporous membrane and b) non-porous dense membrane, while asymmetric membranes are the two-bottom illustrations, c) Loeb-Sourirajan membrane and d) thin-film composite membrane.
In case of symmetrical membranes, they have uniform morphology, can be divided into microporous and non-porous dense membranes as shown in Figure 4(a) and 4(b).
Porous in microporous membranes allow the separation by the passage of smaller penetrants, while non-porous dense membranes allow the penetrants by solution- diffusion through the membranes which is governed by the chemical interactions between the polymer and the penetrant. Alternatively, asymmetrical membranes divided into Loeb-Sourirajan membranes and thin-film composite membranes as shown in Figure 4(c) and 4(d). These membranes consist of a thin and also selective layer overtop a microporous support layer. These support layer should be porous enough so as not to hinder the transport of penetrants and also rigid enough to endure the driving forces of the separation. Loeb-Sourirajan membranes are formed by a controlled precipitation of a polymer out of solution, creating a thin selective layer (500-2000 A° thick) and a microporous substructure (50-200 μm thick) out of the same material. For fabrication
a) b)
c) d)
of composite membranes, other polymers are coated as thin layer on the top of microporous support layer (Ulloa, 2012).
Several researchers have been fabricated the organic membranes and examined their abilities to separate gas mixture. Xing and Ho (2009) prepared crosslinked polyvinylalcohol (PVA)/polyethyleneglycol (PEG) blend membranes for CO2/CH4
separation. They could achieve high CO2/CH4 selectivity for this membrane as a result of the polar segments in the membrane. The CO2 permeability of 80.2 Barrers and a CO2/CH4 selectivity of 33 at 30 °C. Lin and Freeman (2006) determined the permeability of cross-linked poly(ethylene glycol diacrylate) to He, H2, O2, N2, CO2, CH4, C2H4, C2H6, C3H6, and C3H8. The polar units in PEO could react with CO2
molecules which resulted in high solubility selectivity for CO2/nonpolar gas pairs.
Hence, it is unsurprised that CO2 is the most permeable penetrant in their study. In 2008, swollen chitosan membranes have been studied by El-Azzami and Grulke (2008) for CO2 separation from H2 and N2 at 20–150 ◦C and feed pressure range of 1.5–5 atm. The best results in their works are obtained at 110 ◦C and 1.5 atm. The CO2 permeability of 482 barrers, the CO2/H2 selectivity of 43.4, and the CO2/N2 selectivity of 250 at 110◦C.
Later on, Francisco et al. (2010) fabricated diethanolamine-impregnated poly(vinyl alcohol) membranes for CO2 separation from N2 application by varying the amount of diethanolamine 0 wt.% to 50 wt.%. They found that the membrane containing 20 wt%
diethanolamine exhibited the best performance among all the membranes. At higher temperature and lower CO2 partial pressure, the higher selectivity can be obtained from these membranes. In addition, they also concluded that these membranes exhibited a CO2 permeance of 9.7 GPU and a CO2/N2 selectivity of 112, which achieved from the mixture containing 15.6 mol%CO2 at a feed pressure of 308 kPa and ambient temperature.
Nevertheless, organic membranes can also be produces from other biomaterials of natural resources as follows;
- Cellulose
Cellulose is the natural polymer (polysaccharide) which is the most abundant material in the world, synthesized by plants, algae and also some species of bacteria (Legnani et al., 2008), thereby, it is a biodegradable material. From the structure of
cellulose, there are the strong hydrogen bonds between cellulose chains, hence, cellulose does not melt or dissolve in ordinary solvents (Wu and Yuan, 2002). Although, cellulose produced from plant is chemically the same with that one produced from bacteria (β-1,4-glucans), the degree of polymerization (13,000 to 14,000 for plant cellulose and 2000-6000 for bacterial cellulose), structure, and some properties are different (Jonas and Farah, 1998). Therefore, among other polymers, cellulose has been one of the most studied as a membrane material due to its abundance and high mechanical strength (Thiyam et al., 2015). In 1970, Gantzel and Merten studied the permeability of cellulose acetate membranes. They suggested that these membranes could be applied in the gas separation process as the permeation rate of each gases are different (Gantzel and Merten, 1970).
Cellulose acetate (CA) membrane and cellulose acetate-TiO2 nanoparticle composite membrane were synthesized to investigate CO2 adsorption by Hafeez et al.
(2015).The theoretical steps of CO2 adsorption in membranes and on TiO2 nanoparticles blended in CA matrix are as follows: (1) transportation of gas molecules from bulk phase near the surface of membrane, (2) diffusion of gas molecules into the external surface of membrane, and (3) gas molecules solubilize in membrane and adsorb in polymeric chains and on TiO2 nanoparticles. They found that CO2 was adsorbed in both membranes but the blended membranes achieved higher CO2 adsorption capacity. They mentioned that the addition of TiO2 nanoparticles could not only increase the free volume between polymeric chains, which may be helpful in diffusion and adsorption of CO2, but also provides OH functional groups that enhances CO2 adsorption. Also, ester groups of CA matrix help to improve the CO2 affinity. Another important aspect for gas and polymer interaction is polarity that have affected the CO2 adsorption capacity. As CO2 has quadrupole moment, it is able to soluble in polar polymers and its polar bonds have strong interaction with OH groups of TiO2. Recently, Venturia et al. (2016) analyzed the behavior of Microfibrillated cellulose (MFC) films and their blends with PVAm (Polyvinylamine) in views of their uses in CO2 separation applications. The membranes were obtained by casting from a solution of carboxymethylated MFC and Lupamin. The films were subjected to a thermal treatment in a vacuum oven in order to improve the film stability at high humidity by decreasing water uptake and possibly creating covalent bonding through the fibers and the polymer. Gas permeation of CO2
and CH4 were performed at 35°C as a function of relative humidity and water sorption.
From their results, they suggested that both MFC and MFC-Lupamin films have attractive ability for CO2/CH4 separation providing very high selectivity values (more than 400) which achieved separation performance well above the trade-off of 2008 Robeson’s plot. On the other hand, they claimed that the difference between CO2 and CH4 permeability reduced leading to a strong decrease of selectivity when the relative humidity exceed 60%.
- Bacterial Cellulose
Bacterial cellulose is produced by Gram-negative bacteria (Gluconacetobacter xylinus), which shows several unique properties when compared to plant cellulose (Legnani et al., 2008). This aerobic Gram-negative bacteria is active when fermented at pH 3-7 and temperature range 25 to 30°C using saccharides as carbon source (Esa et al., 2014). The formation of cellulose occurs at the interface between air and cellulose pellicle, hence, oxygen is an important factor for the production of cellulose.
Biochemical pathway for cellulose formation from glucose is shown in Figure 5.
When cellulose produced, the pores presented in the form of fibrils and then those synthesized fibrils formed together into a ribbon of crystalline cellulose. The self- assembly process might be called crystallization, which occurred after the polymerization of the fibrils was completed.
Figure 5. Biochemical pathway for cellulose synthesis in Acetobacter xylinum (Jonas and Farah, 1998).
Bacterial cellulose consists of glucose molecules linked by β(1→4) - glycosidic bonds with molecular formula (C6H10O5)n forming linear chains. These chains are held together by inter- and intra- hydrogen bonding as demonstrated in Figure 6 (Albu et al., 2014; Esa et al., 2014). Bacterial cellulose is normally of crystallinity structure. The 3D structure of an ultrafine network of cellulose nanofibers (3-8 nm) which is called
“nanocelluloses” could be obtained from the culture medium (Legnani et al., 2008) resulting in formation of hydrogel sheet with high surface area and porosity.
Microfibrils of bacterial cellulose are about 100 times smaller than those of plant cellulose. The abundant surface of hydroxyl groups of the cellulose formed makes it hydrophilic, biodegradable, and chemical-modifying capable (Esa et al., 2014).
Bacterial cellulose membrane appearance is gelatinous and transparent. The remarkable properties of bacterial cellulose include high molecular weight and crystallinity (60-90%), high mechanical strength, high purity (free of lignin and hemicellulose), and high water-holding capacity. In addition, this membrane has unique properties such as nanometric structure, physical and mechanical properties which lead to a great number of applications (Legnani et al., 2008) such as dietary fiber, acoustic or filter membrane, ultra-strength paper, and reticulated fine fiber network with coating, binding, thickening, and suspending (Keshk, 2014). For example, in 2008, Legnani et al. fabricated dried bacterial cellulose membranes as flexible substrate for organic light emitting devices (OLED) by depositing Indium tin oxide (ITO) film onto bacterial cellulose membranes. They concluded that this membrane is possible to use as flexible substrate to develop a fully biocompatible OLED (Legnani et al., 2008). Additionally, the application of bacterial cellulose can be applied instead of cellulose from plants in areas that plant cellulose hardly be used because of its high purity and crystalline structure (Jonas and Farah, 1998).
Figure 6. Inter- and intra-hydrogen bonding of bacterial cellulose (Esa et al., 2014).
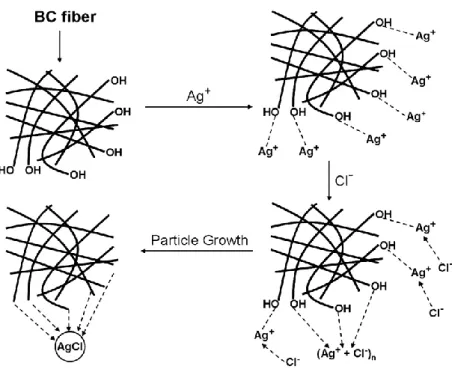
Bacterial cellulose may be considered as an ideal hydrophilic matrix for impregnating nanoparticles. In 2009, Hu et al. prepared bacterial cellulose membranes incorporated with silver chloride nanoparticles by immersing the membranes in silver nitrate solution and sodium chloride solution. After that, the synthesis of silver chloride nanoparticles in the three-dimensional non-woven network of bacterial cellulose nanofibrils occurred (Figure 7). Due to the nanoporous structure and high oxygen (from ether and hydroxyl) density of bacterial cellulose fibers, it is an effective nanoreactor for nanoparticles synthesis. These nanopores are important for introduction of silver ions. After the impregnation of silver chloride nanoparticles, bacterial cellulose membrane exhibited high hydrophilic property and strong antimicrobial activity against both S. aureus (Gram-positive bacteria) and E. coli (Gram-negative bacteria) that are found on the contaminated wound, so this membrane can be applied to wound dressing.
Figure 7. Schematic representation of the formation mechanism of AgCl nanoparticles (Hu et al., 2009).
Additionally, bacterial cellulose is extremely abundant and of low cost, thereby, blending it with other polymers, for instance, chitosan, poly (ethylene glycol) (PEG), and gelatin via immersing wet bacterial cellulose pellicle into chitosan, PEG, or gelatin solutions and then freeze-drying step is needed. The products look like a foam structure that used for potential biomedical application of tissue engineering scaffold and wound- dressing material (Keshk, 2014).
In order to improve bacterial cellulose’s ability for CO2 capture application, modified it with silk fibroin is hopeful to be a useful method to introduce amino acid groups into cellulosic materials (Shang et al., 2011). The amide bonds of the protein may act as electron donor functional groups i.e. accessible sites for interaction with CO2
molecules, resulting in enhancement of CO2 capture (Lin and Park, 2011). Further, silk fibroin has already been used for improving the mechanical properties of the bacterial cellulose films (Jung and Jin, 2007) and for fabrication of bacterial cellulose based sponge scaffolds for tissue regeneration (Oliveira Barud et al., 2015).
- Silk Fibroin
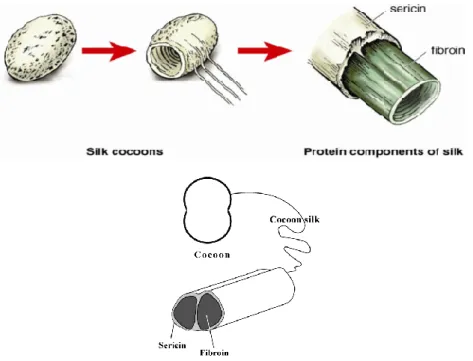
Silk fibroin is a fibrous protein produced by the domestic silkworm Bombyx mori, which provides structural roles in cocoon formation, that has been used as films, three- dimensional scaffolds, electrospun fibers, and microspheres a long time due to their superior mechanical properties, favourable oxygen permeability, high thermal stability, and also versatile protein biomaterial (Tudora et al., 2013). The structure of silk cocoon, which two fibroin filaments join together and are formed in one Bombyx mori silk filament where sericin coats the silk fibroin and acts as an adhesive (Shang et al., 2013), is shown in Figure 8. Sericin is a group of glycoproteins (nonfilamentous protein, gum- like protein) that covered the surface of fibroin. The amount of sericin is about 25-30%
of the total silkworm cocoon by weight (Rockwood et al., 2011).
Silk fibroin consists of a light chain (its size is much smaller than heavy chain) and a heavy chain of proteins linked by a single disulfide bond (Tudora et al., 2013). The heavy chains form discrete β-sheet crystalline structure serving as the main structural component, whereas, the light chains are not associated with the formation of the crystalline region in silk fibroin (Koh et al., 2015). The molecular structure of silk fibroin heavy chain composes of 12 hydrophobic amino acids, which segregated by 11 hydrophilic regions (Tudora et al., 2013; Koh et al., 2015).
Figure 8. Structure of silk cocoons (Bunnell, “Silk Fibroin”; “Structure of cocoon silk”).
There are three main conformations of silk proteins, including α-helical and random coil structures ascribed to silk I structure, while β-sheets to the silk II structure, which the amount of β-sheet is about 50% in case of Bombyx mori silk corresponding to the proportion of the (Gly-Ala)n motif. Thereby, Bombyx mori silk fibroin is accepted that it is composed of a highly repetitive (Gly-Ala)n sequence motif leading to antiparallel β-sheet conformation that is silk II of the crystalline form (Liu and Zhang, 2014). The amino acid sequence, (Gly-Ser-Gly-Ala-Gly-Ala)n, is the main component in its primary structure as presented in Figure 9. The tight packing of the sheets results from the high content of glycine that leads to the rigid structure and higher tensile strength of silk. Therefore, the combination of stiffness and toughness of silk allow it to be a material with many applications in several areas.
Figure 9. The amino acid consequence of silk fibroin (“Fibroin”, 2015).
Yang et al. (2000) prepared and examined the blend membranes between cellulose and silk fibroin. From their results, these blend membranes which obtained by coagulating with acetone-acetic acid were miscible and had a strong hydrogen bond interaction exists between cellulose and silk fibroin. Moreover, they found that the specified intermolecular hydrogen bonds between OH at the C2, C3 position of cellulose and NH in the amide groups of silk fibroin increased, which affected to the decreasing of the intramolecular hydrogen bonds of cellulose.
1.3.1.3 Composite Membranes
The segmental flexibility of polymeric membranes leads to limit their ability especially when use at high temperature. While, inorganic membrane materials are difficult and expensive to fabricate large membranes due to their fragile structures. For this reason, polymeric membranes are still attractive. Also, to provide a solution to the trade-off problem of polymeric membranes, polymer-inorganic nanocomposite materials; defined as inorganic nanofillers dispersed in a polymer matrix, have been investigate for gas separation. Polymer composites could enhanced material properties compared to pure polymers. The nanocomposite materials offer the advantages from both materials such as the flexibility and processability of polymers, and the selectivity and thermal stability of the inorganic fillers. This composite membrane could thus improve membrane performance for gas capturing or separation purpose. The blended components in a composite membrane thus provide a high capability to adsorb the desired gas. The addition of inorganic nanofillers may affect the gas separation in either the interaction between polymeric chain segments and nanofillers or the interaction
between hydroxyl and other functional groups on the surface of the inorganic phase with polar gases e.g. CO2. This could obstruct the polymeric chain packing resulting in an increase in the free volumes between the polymeric chains and thus enhance gas diffusion and concurrently improve the gas solubility (Cong et al., 2007; Hafeez et al., 2015; Oliveira Barud et al., 2015). The nanocomposite membranes can be divided into two types by their structure: (a) polymer and inorganic phases connected by covalent bonds and (b) polymer and inorganic phases connected by van der Waals force or hydrogen bonds as shown in Figure 10.
Figure 10. Polymer-inorganic nanocomposite membrane’s types; (a) polymer and inorganic phases connected by covalent bonds and (b) polymer and inorganic phases
connected by van der Waals force or hydrogen bonds (Cong et al., 2007).
- Zinc Oxide Nanoparticles
Zinc oxide (ZnO) nanoparticles have their own important properties, hence, they have been used in large area of applications e.g. gas sensor, chemical sensor, bio-sensor, optical and electrical devices, cosmetics, solar cells etc. (Djurisic et al., 2012). ZnO- containing material can be developed to apply in CO2 adsorption process as CO2 is
sensitive to the oxide surface structure. In 1982, Lavalley et al. examined the CO2
adsorption on ZnO surface using FTIR spectroscopy. They revealed the particular sites for CO2 adsorption on ZnO surface were Zn2+ ions with two vacancies and a reactive oxygen ion in an adjacent position as the below figure (Figure 11). They also claimed that this adsorption leads to an increase of Lewis acidity of the coordinatively unsaturated cations.
Figure 11. CO2 adsorption on ZnO surface (Lavalley et al., 1982).
Reactions of CO2 on ZnO surface were also investigated by Galhotra and Grassian (2010). They mentioned that the possible ways for CO2 adsorption could be the formation of chemisorbed products and also physisorbed bent CO2 as suggested by the peak at 2350 cm-1 that is assigned to the asymmetric stretching mode (υ3) of CO2 the ZnO surface reacts with carbon dioxide to form bent CO2, bicarbonate, carbonate and carboxylate species under dry conditions as presented in Figure 12.
Figure 12. Structure of (a) bent CO2; (b) bicarbonate; (c) monodentate carbonate; (d) bidentate carbonate; and (e) carboxylate formed on the ZnO surface (Galhotra and Grassian, 2010).
Later on, Tang and Luo (2013) studied the adsorption of CO2 molecules on five different ZnO surfaces, including (0001̅), (0001), (101̅0), (112̅0), and (112̅1) surfaces, by using the density functional theory plus U (DFT+U) method. On the basis of their surface energy calculations, the stability of different ZnO surfaces was revealed, which was in the sequence of ZnO(101̅0) > ZnO(112̅0) > ZnO(0001̅) /ZnO(0001) >
ZnO(112̅1). Therefore, both types of surfaces (101̅0) and (112̅0) are exposed and most likely to be found, moreover, they also concluded that there are abundant (101̅0) and (112̅0) faces on ZnO nanoparticles. According to their results, the preferred CO2
adsorption state on ZnO surfaces depends strongly on the nature of the substrate. Figure 13 shows all of possible molecular orientations for adsorption modes on each considered surfaces, including monodentate, bidentate, and tridentate geometries. The CO2
molecule maintained its linear structure during adsorption on (0001̅) and (0001) surfaces as shown in Figure 14(a) and 14(b), where they are O-terminated and Zn- terminated facets, respectively. Hence, it was the physisorption owing to the lacking of coordinatively unsaturated Zn-O dimers, which are needed for CO2 to be activated, and also could not support the CO2-surface interaction. In contrast, the adsorption on the
a) b) c)
d) e)
mixed-terminated (101̅0), (112̅0), and (112̅1) planes demonstrated the chemisorption and resulting activation of CO2. For the ZnO (101̅0)and ZnO (112̅0) planes, CO2
preferred to bind with two neighboring surface Zn atoms by its two O ends and C atom with a lattice O atom as presented in Figure 14(c) and 14(d), thus leading to a tridentate carbonate species. In case of ZnO (112̅1) plane, a stable bidentate carbonate was found upon exposure to CO2 (Figure 14(e)). The binding of CO2 to ZnO surfaces was strengthened in the order of ZnO (0001̅) ≤ ZnO (0001) < ZnO (112̅1) < ZnO (112̅0)
≤ ZnO (101̅0). They mentioned that the ZnO (101̅0) facet was not only the most stable but it was also the best site for CO2 adsorption on ZnO particles. In case of the chemisorbed CO2 with ZnO surfaces, the 2p states of the CO2 were able to overlap with the relevant 2p orbitals of surface oxygen and 4s orbitals of surface zinc. The mechanism presented as follows: Zn donated electron to the antibonding orbitals of CO2
and CO2 bonding orbital back-donated electron to lattice O resulting in elongated C=O internal bond distances as well as a rather bent O=C=O angle.
Figure 13. Possible molecular orientations; (a−d) monodentate, (e, f) bidentate, and (g, h) tridentate adsorption modes for CO2 on ZnO surfaces as represented by a ZnO (0001̅) surface. Carbon atom, adsorbate oxygen, lattice oxygen, and zinc represented by dark gray, yellow, red, and blue spheres, respectively (Tang and Luo, 2013).
Figure 14. Most energetically favorable configurations for adsorbed CO2 on (a) ZnO (0001̅), (b) ZnO (0001), (c) ZnO (101̅0), (d) ZnO (112̅0), and (e) ZnO (112̅1). Atoms engaged in the adsorbate-substrate interaction were labeled. Upper panels show side views, while lower panels indicate top views. Carbon atom, adsorbate oxygen, lattice oxygen, and zinc represented by dark gray, yellow, red, and blue spheres, respectively (Tang and Luo, 2013).
Furthermore, Farias et al. (2013) studied the physical adsorption of CO2 on the (0001) and (0001̅) surfaces, and the chemical adsorption of CO2 on the (0001) surface by using the density function theory (DFT). The valence states of O were 2s2, 2p4; of Zn were 3d10, 4s2; and of C were 2s2, 2p2. They presented the geometry optimization
results for the CO2 physical adsorption on (0001) and (0001̅) surfaces, where the large distance between CO2 and ZnO surface was noticed owing to the physical process.
According to their Electron localization function (ELF) analysis, CO2 molecule had insignificant interaction with (0001) and (0001̅) surfaces in physical adsorption.
Additionally, from their results of ELF analysis for the chemical adsorption with bidentate and tridentate species, it pointed out a covalent bonding between CO2 and the (0001) surface in both adsorptions.
1.3.2 Study of the Interaction of Membrane Materials with CO2 by FTIR Spectroscopy
Every atom in molecules vibrate continuously with respect to each other at temperature above absolute zero. When the frequency of a specific vibration is matched with the frequency of the IR radiation directed to the molecule, that molecule absorbs the radiation and the associated energy is converted into some type of motion leading to absorption bands observed in the mid IR region. FTIR spectroscopy provides the absorption bands at the specific frequency of the sample absorbs the radiation, which allows to identify the chemical functional groups of the sample (qualitative analysis), and the intensity of the absorptions (quantitative analysis) that related to the concentration of the component. For instance, Kasturirangan (2007), they split IR beam into two paths, one path is used to measure the υ2 frequency spectra regions of the polymer film in the presence of CO2 and another path is used to measure the spectrum of CO2 in the absence of the film. The information about the interactions of CO2 with any polymer could be achieved by the differences in these two spectra. In their work, they revealed the specific CO2-polymers containing C=O and C-F groups interactions using in situ FTIR spectroscopy. They claimed that the longer alkyl chains connected to the C=O group could improve the interactions possibly by the formation of cooperative C-H…O bonds that further stabilize the Lewis acid-base complex between C=O and CO2 and the chain branching could enhance the accessibility of C=O group and thus favors interaction with CO2. For example, PBMA has longer alkyl side chains attached to the C=O group and hence it has a higher free-volume than PMMA.
According to PBMA structure, the Lewis acid-base interactions are favored because it is more accessible for electronic sharing with CO2. In case of Polyvinylidene fluoride
(PVDF), the electron rich fluorine atoms act as Lewis base or electron donor, which provide the strong interactions between C-F…CO2 groups, even though, it is absent of chain branching and lower free-volume. Nevertheless, there was no shifted in IR spectra were noticed for Polystyrene (PS) that indicated the absence of Lewis base groups in the backbone. Thereby, they suggested that these results proved molecular level evidence for the CO2 interactions with C=O and C-F groups.
In addition, Kazarian et al. (1996) investigated the specific interactions of CO2 with polymer films via using Fourier Transform IR spectroscopy to observe whether the bending mode of CO2 (range of 680-600 cm-1) changed when the basic functional groups contained polymers incorporated with CO2. PMMA film was subjected to CO2
41-83 bars for 1 h and then the pressure was released. They found three main peaks;
667, 662, and 654 cm-1 appeared. However, after removing CO2 gaseous, the peak at 667 cm-1, which arose from free and unassociated CO2, was not presented, there was just only the 662 and 654 cm-1 bands that appeared as peaks on the broad band shifted to lower frequency from the gaseous CO2, indicating the CO2 molecules remaining in the polymer film. They mentioned that these new bands were of the out-of-plane and in-plane bending modes of CO2 interacting with the carbonyl of PMMA, while the larger shift was the in-plane mode (654 cm-1). These shifts and splitting peaks provided strong evidence for the specific interactions between CO2 and PMMA, most probably by the Lewis acid-base interaction, where electron donating from lone pair of the oxygen atom of the carbonyl group of the polymer to carbon atom of CO2 molecule that acts as electron acceptor. CO2 molecules also has a considerable quadrupole moment which they could not entirely exclude the contribution of electrostatic forces in the interaction of CO2 with PMMA. Additionally, they also examined the IR spectra of asymmetric stretching mode of CO2 entrapped in the PMMA film. Only a band at 2338 cm-1 and a weak low-frequency band at 2326 cm-1 were noticed. They suggested that there was only one type of the site within the polymer matrix for CO2 molecules for their conditions because if there were more sites for CO2 within the matrix, it should have more than one band in the asymmetric stretching region. On the other hand, they did not find any splitting and shift for the polymers lacking electron-donating functional groups.
Afterward, Nalawade et al. (2006) also used a Fourier transform-infrared spectroscopy (FT-IR) to determine the intermolecular interactions between CO2 and