SPECTRUM ABSORPTION METHODS IN ANALYSIS OF GAS MIXTURES
30. GENERAL DESCRIPTION OF S P E C T R U M ABSORPTION METHODS
The absorption methods for analysis of gas mixtures can successfully compete with procedures based on emission spectra.
It is a matter of common knowledge that in recent years much a t - tention has been focused on developing absorption methods for analysis of metals [ 3 7 4 , 4 6 6 - 4 6 8 ] . A general description of such methods is offered by Walsh [ 3 7 4 ] , who also discusses their m e r i t s as compared with other techniques. Walsh argued that an analysis based on absorption spectra can be considered as an a b - solute method, whereby the need for comparison standards is e l i m - inated. An added and essential advantage is the elimination of the third component effect. Finally, the analytical sensitivity no longer depends on the excitation potential of the particular line. Thus, the sensitivity for sodium is the same as for zinc [466].
Walsh's argument that absorption sprectroscopy is an a b s o - lute method has, however, proved somewhat optimistic. For one thing the transition probabilities are known for s o m e , but by no
241
242 SPECTRUM ABSORPTION METHODS IN ANALYSIS OF GAS MIXTURES means all, resonance lines. Furthermore, absorption lines are in m o s t cases distorted by the isotopic and hyperfine structure. This leads to e r r o r s in determining absorption coefficients and, there- fore, in evaluating the absolute concentrations. It is necessary, m o r e o v e r , to know the vapor pressure equation for the metals in the sample. Absorption spectroscopy of metals, especially for those melting at high temperatures, involves considerable experi- mental difficulties, since the absorption becomes appreciable only at high temperatures. While high temperature furnaces need not be used when working with g a s e s , which simplifies the experimental technique, there are s o m e specific difficulties which must be overcome. Thus, in analyzing inert gases whose absorption lines lie in the vacuum region, the entire spectrograph must be filled with the mixture, or else one requires cuvettes with windows transparent to vacuum U V . The experimental difficulties involved appear to have been holding back the development of methods for gas analysis in the vacuum spectral region. Absorption spectra for wavelengths of 1100 A and higher can be obtained using cuvettes with lithium fluoride windows. These cuvettes a r e , however, useless for absorption spectroscopy of helium, neon and argon, since the wavelengths of the resonance lines of these gases a r e λ 5 8 4 , 736 and 1048 A . However, the problem should not be considered hope- l e s s since manufacturing techniques are currently being developed for the preparation of solid transparent films designed for working in the far ultraviolet region of the spectrum.
Analysis of gases absorbing in the near UV, visual and IR regions is far l e s s complicated. The most widely accepted methods use IR absorption spectra, which a r i s e predominantly from rotational and rotational-vibrational molecular transitions.
Rotational spectra lie in the far infrared with wavelengths from a few hundred microns to several centimeters. This wavelength
range is practically inaccessible to optical spectroscopy, and there- fore radiofrequency methods must be employed. Analytical a p - plications of microwave spectroscopy were reviewed by Zeil [ 4 6 9 ] .
The rotational-vibrational spectra correspond to the wavelength range of 2 to 100 m i c r o n s . They partially overlap the spectral region which can be detected without difficulty both on photoplates and with the aid of thermocouples and other devices.
Vibrational bands appear only in the spectra of molecules possessing a dipole moment. It follows that rotational-vibrational spectra cannot be obtained for symmetrical diatomic molecules;
hence, the analysis in this case must be based on electronic spectra.
The electronic molecular spectra correspond to quanta of con- siderably higher frequency, and can therefore be observed in the visible and UV spectral regions.
The fundamentals of analysis based on absorption spectra have been elaborated upon in a number of papers [ 3 1 7 , 4 7 0 , 4 7 1 ] .
In view of the difficulties involved in analyzing the absorption of resonance lines of inert g a s e s , a procedure based on absorption in excited gases was developed [ 4 3 3 ] .
31. ABSORPTION IN EXCITED GASES AS A BASIS OF ANALYSIS
To determine impurities in inert g a s e s , light is transmitted through an absorption discharge tube filled with an excited inert gas from a source discharge tube filled with the same g a s . One thus obtains an attenuation or absorption of the light at several spectral line frequencies. According to [ 6 4 , 4 3 3 , 4 7 2 ] , the m a x i - mum absorption occurs in lines which appear as a result of tran- sitions from the upper to the metastable levels 3Poand3P2, as well as to the excited level 3Pi (see the energy level diagrams in Section 1 ) . The excited atom concentration depends strongly on
244 SPECTRUM ABSORPTION METHODS IN ANALYSIS OF GAS MIXTURES the purity of the gas in the discharge tube. The presence of such impurities as nitrogen, hydrogen, oxygen, or water vapor reduces the concentration of excited atoms, due both to collisions of the second kind between the impurity atoms and the metastable atoms of the primary gas, and to the electron temperature drop. The decreased excited atom concentration, in turn, causes a decrease in the amount of absorption. This occurs only in the case where the first excitation potential of the impurity is lower than the excitation energy of the metastable levels of the primary gas.
To characterize the absorption process we shall introduce the absorbance A expressing the ratio of radiation absorbed by the sample to that incident upon the sample
A = I s+ i; -/ q 100%; (6.1)
where /s, /a and I ο denote, respectively, radiation emitted by the source discharge tube alone, the absorption discharge tube alone and the total radiation of both tubes operating simultaneously.
Absorbances of different neon lines at varying impurity con- centrations are shown in Table 3 . The variability of the absorbance of pure neon can be traced to differing conditions (different p r e s - sures and lengths of the discharge tube) under which m e a s u r e - ments were carried out.
The dependence of absorbance on the impurity concentration provides a basis for plotting calibration curves for the determina- tion of a readily excited impurity in inert g a s e s , as well as for determining traces of an inert gas with a lower ionization potential in an inert gas having a higher ionization potential.
It will be remembered that what is determined is not the a b - sorption of radiation by the impurities, but a diminution of the a b - sorption by the neon atoms themselves. This is both the superior- ity and the weakness of the method. On the one hand, it fails
Variation of absorbance with impurity concentration for various neon lines [ 4 3 3 , 473]
Impurity C, %
A (in %) for lines (in A)
Impurity C, %
Impurity C, %
6143 6402 6266 6163
0.00 60.7 70 43.4 40.7
0.075 51,3 63 39.4 33.3
Nitrogen 0.15 49 63 34.1 27,7
Nitrogen
0.26 45 58 24.1 20,5
0.39 21.8 27 9,8 7.9
0.00 100 100 100 90
Argon 0^50 90 85 55 34
Argon 1.0 76 80 35 25
2.0 45 65 4 9
0.00 48.3 61 31.4 26.3
0.06 33.5 48 18.5 15.4
Hydrogen 0,12 12.2 17 4.5 6.0
0.29 8.7 10 1.8 2.6
0.17 11.2 14 3.7 4.0
to identify the individual impurities; on the other hand, this con- siderably simplifies the analytical procedure, since the absorption of neon lines can be measured m o r e easily than that of the lines of the impurities.
The fact that lines of a fairly narrow spectral region (Νβλ 6143—6506 Â ; ArÀ 6365—8014 A) produce considerable absorption permits dispensing with spectroscopes and use of simple light filters. In addition, a procedure based on total radiation absorption is most adaptable to a simple system of photoelectric detection.
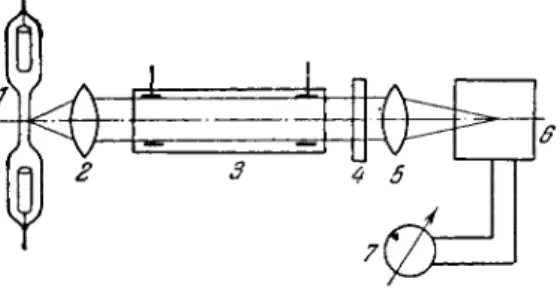
A schematic diagram of an arrangement for absorption analysis of gas mixtures [433] is shown in Fig. 8 8 . The source discharge tube 1 is filled with the principal component of the mixture and gives off a very intensive radiation flux (the internal diameter of the capillary is several m i l l i m e t e r s ) . The absorption discharge
Table 3
246 SPECTRUM ABSORPTION METHODS IN ANALYSIS OF GAS M I X T U R E S
FIG. 88. Experimental arrangement for absorp- tion analysis of gas mixtures.
tube 3 is filled with the sample to be analyzed. The tube dimensions can be varied depending on the composition of the sample, since its purpose is to provide an absorption column of sufficient length.
The source and absorption tubes a r e connected to sources p r o - viding, respectively, 30 mA and 10 m A , 1500 V DC current. An objective lens 2 directs a parallel light beam from the source through the absorption tube and light filter 4; this beam is then focused (by objective 5) on the photocathode of photomultiplier 6.
After passing through a DC amplifier, the photocurrent is in- dicated by galvanometer 7. Either interference filters or a set of tinted glasses can be used as light filters. Interference filters, which operate in a relatively narrow passband (100-150 A ) , give m o r e accurate measurements than conventional colored glass filters. Colored glass filters invariably pass through a portion of the source radiation which is outside the absorption region. The result is that the accuracy of measurements is reduced. If in the above arrangement the absorption tube is filled with a gas mixture of known composition, one can plot a calibration curve. The con- centrations of the gas to be determined are plotted on the abscissa, and the absorbance values along the ordinate. If then one m e a s - ures absorbance, the concentration of the minor component ( i m - purity) can be determined from the calibration curve.
The analytical procedure can be considerably speeded by c a l i - brating the galvanometer readings directly in percent of the minor component.
Figure 89 shows the schematic diagram of a double beam unit (the notation is the s a m e as in Fig. 8 8 ) . The light from the source discharge tube (two parallel beams) passes through two identical absorption tubes 3 and 3' and is detected by two independent photomultipliers 6 and 6'. The luminous flux difference is indicated by the galvanometer. If the two absorption tubes and the source discharge tube are filled with the s a m e (principal) component of the s a m p l e , the two fluxes will be equal and the galvanometer will indicate z e r o . If one of the absorption tubes is filled with the sample, the light flux passing through it will be l e s s attenuated (the con- centration of absorbing atoms is lower because of the presence of the minor component). The galvanometer will then indicate a flux intensity difference which is a function of the concentration of the minor component.
4 3 «Ô 3f 4
2
TTf
2'
7
FIG. 89. Double beam unit for absorption spectroscopy of gas mixtures.
This procedure is most suitable for analyzing binary gas m i x - tures. It can be used in determining impurities in inert g a s e s , when the ionization potentials of the impurities are lower than those of the primary gas (see Fig. 90). It can also be used for molecular gases (nitrogen, hydrogen, oxygen, carbon dioxide) whose ionization potentials are lower than the energies of the metastable levels of inert gases (see Fig. 9 1 ) . Figures 90 and 91 were obtained at the
248 SPECTRUM ABSORPTION METHODS IN ANALYSIS OF GAS M I X T U R E S
0.2 OA O.B OS 1.0 7.2 14 7.6 /.S 2.0C.%
FIG. 90. Calibration curves for determination of nitrogen in
inert gases.
following conditions: discharge tube 60 m m long, 2 m m I . D . , p r e s - sure 6 m m Hg; 30 mA current; absorption discharge tube, 500 m m
long, 20 m m I . D . ; variable p r e s s u r e , 1 to 5 m m Hg, depending on the specific an- alytical problem; 10 mA current. In plotting the calibration curves, special care was given to the selection of the spectral region and excitation conditions in the a b - sorption discharge tube. The spectral r e - gion was usually one which corresponds to a maximum absorption. Since such regions 0.2 OA aß o.ô 7.2 ç% were fairly wide, further restrictions were imposed by the available filters, as well as
S S Ä K Ä T ^
* t e h s p e c tl " a c t i v i t y of the photo r a tube and photomultiplier cathodes.The curves for argon and neon in F i g s . 90 and 91 were obtained with the aid of interference filters. In the case of argon the filter transmission peak was at λ™7850 Ä , and with neon the peak was at λ™6300 Ä . For helium, various combinations of glass filters were used. The passband thus obtained limited the spectrum to the infrared region beginning with À8000 A .
The sensitivity of analysis to changes in concentration in- c r e a s e s markedly with the diameter of the absorption discharge tube and the pressure in it (see Fig. 92). It follows that impurities of the order of 0.001% to 0.01% must be determined at high p r e s - s u r e s , using large-diameter absorption discharge tubes. In such c a s e s the absorbance in a pure gas is rather low, and as a result the accuracy of the measurements is considerably reduced. To i m - prove the accuracy, it is necessary to increase the length of the column of absorbing g a s , i.e., the length of the tube.
0 £2 Μ 06 06 W 12 1.4 16 16 20 2£ 2.4 2.6 2£
FIG. 92. Effect of pressure on the sensitivity of the analysis for nitrogen in argon. 1—φ = 0.5 mm Hg;
2—ρ = 1.4 mm Hg; 3—ρ = 2.8 mm Hg.
Analysis of multicomponent mixtures based on measuring a b - sorbance is possible only when one of the components of the m i x - ture p o s s e s s e s a higher ionization potential than that of the principal component. If this is not the c a s e , it becomes impossible to d e - termine which component is responsible for the decrease in absorption.
The above procedure is a simple and fast test for the presence of impurities in inert g a s e s , even though the percentage of the impurity may remain unknown.
Absorption of radiation in an excited gas was used as a basis for an analysis of a mixtured hydrogen isotopes [ 2 0 9 , 4 4 6 ] . The
250 SPECTRUM ABSORPTION METHODS IN ANALYSIS OF GAS MIXTURES source tube was filled with the sample, while the absorption discharge tube was filled with light hydrogen. Both tubes were connected to a source of DC current. The light in the source tube was modulated, and a special amplifier tuned to the modulator frequency was provided in the system so that only the emitted radiation was recorded. A marked absorption of the Balmer series was noted. The procedure can also be modified. Thus, the a b - sorption, rather than the source, tube can be filled with the sample.
Mixtures of isotopes of inert gases can also be analyzed by o b - serving absorption in excited gases.
32. INFRARED ABSORPTION ANALYSIS OF GASEOUS MIXTURES
Infrared absorption spectra have been used in gas mixture analysis for m o r e than 20 years and this application has been e x - tensively reviewed [ 4 7 1 , 4 7 4 - 4 7 6 ] . * The analysis can be carried out with or without dispersion of the radiation.
Analysis involving the dispersion of radiated light is based on the fact that each constituent of the mixture has specific absorption bands. It is assumed that the other constituents do not absorb in this region. The concentration of the constituent in the sample is determined from the intensities of the absorption bands. D i s - persion of the light is achieved by means of a spectrograph or a monochromator. Bolometers, thermopiles or photographic plates are used for detection and/or recording. The type and operating conditions of the radiation receiver materially affect the accuracy of the measurement [478]. This type of analysis is based on the application of Beer's law to each component of the mixture.
However, Beer's law frequently does not hold exactly. Various
*For information on techniques of infrared spectroscopy, see general manuals and reviews [317, 477],
methods are available for correcting these deviations from the ideal behavior [ 4 7 9 , 4 8 0 ] .
Spectrographs or monochromators a r e used in cases where a high analytical accuracy is required. Such devices also require highly sensitive detectors.
A gas analyzer operating on the principle of a double beam spectrophotometer was proposed by P e m s l e r and Planet [481]. The spectrophotometer consists of two chambers, each of which is filled with the sample component which is being determined. One of the chambers is then closed off and the other is evacuated. Next, the sample is slowly introduced into the evacuated chamber until absorption is the s a m e in both chambers, and the instrument needle is at z e r o . The pressure ratio in the two chambers then indicates the percentage of the desired constituent. The method is accurate to within 0.1-2%. An automatic prism-diffraction grating IR gas analyzer is also described in [482],
Analysis without dispersion of radiation is known as the integral absorption method [471]. Selectivity is attained either with the aid of a selective detector, a selective filter, or a selective emitter (source). The last involves the greatest design difficulties, but there is a possibility that the problem will be solved through the use of l a s e r s . A s a rule, a selective detector is the gas whose content is being determined; it is heated by the absorption of r a - diation, and the change in heat content is then indicated by a bolometer. The same g a s , when giving off the absorbed radiation, can also act as a selective filter. This function can also be p e r - formed by an interference filter which separates a narrow spectral region. Interference filters are widely used in conventional gas analyzers [ 4 8 3 , 4 8 4 ] .
The Parsons-Irland-Bryan gas analyzer [ 4 8 4 ] , designed for hydrocarbon determination in exhaust g a s e s , is shown in Fig. 9 3 .
252 SPECTRUM ABSORPTION METHODS IN ANALYSIS OF GAS M I X T U R E S
FIG. 93. Schematic diagram of the Parsons-Irland-Bryan gas analyzer.
Interference filters which isolate individual lines of the rota- tional band structure are also used in the Harrison and Reid [483]
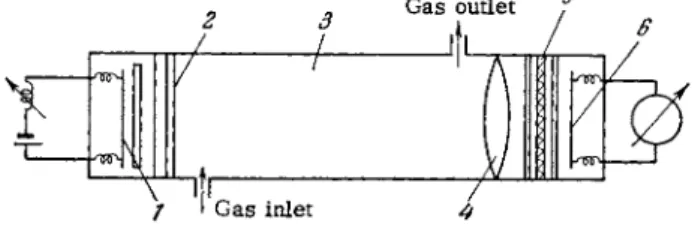
unit (see Fig. 94) designed for hydrogen fluoride (partial pressure range of 0 . 0 2 - 2 0 m m Hg) determination in corrosive gas m i x - tures at a total pressure of 1 atm. The principal constituent of the mixture is nitrogen, and uranium hexafluoride (UF6) is the minor component. The apparatus consists of a tungsten lamp connected to a voltage stabilizer, a system of lenses, a shutter and a detector.
Two beams are transmitted through the device, where one undergoes absorption while the other does not; both beams then impinge on the detector. Two filters are provided—a fixed wide-band one (with 2 - 2 . 5 micron passband) and a narrow-band one, with a half- thickness of 0.004 micron. The last filter is mounted on a modu- lator vibrator oscillating at 10 cps. A narrow spectral region is
The unit consists of a ribbon filament tube / , a quartz window 29 an aluminum tube 3 for passage of the g a s , a quartz lens 4, filters 5 and a thermocouple 6 . An interference filter with a half- thickness of 0.15 micron separates out the 3.43 micron absorption band, while a second filter chops off the wavelength range below 2.4 microns. To determine rc-hexane, an analytical curve was plotted (with an accuracy of 0.1%) for the concentration range of 0.1 to 0.2 mole%. The thermocouple readings, which indicate the fraction of transmitted radiation, vary with concentration.
scanned; this is achieved because of the unique capacity of an interference filter to change its output λί η with a change in the angle of incidence. When the vibrator is disconnected, the filter transmits line λ0 (one of the lines of the rotational structure of HF); when the filter is in circuit, the line transmitted is λι (it lies between the rotational structure lines). The differential reading for these two wavelengths indicates the partial pressure of the hydrogen fluoride.
/
ô U 9 W
FIG. 94. Gas analyzer with mobile filter. 1—
Light source; 2—-lenses; 3—shutter; 4—filter;
5—oscillating filter; 6—chamber with the sample;
7—detector; 8—light source power supply; 9—
oscillator; 10—recorder; 11—amplifier; 12—
measuring instrument.
A gas analyzer with selective filter (see Fig. 9 5 ) , where the filter is the analyzed gas itself, was proposed by Pfund [485]. A s seen from the diagram, the two beams emerging from the light source / pass through sample 2, then through a gas filter whose excitation bands coincide with those of the gaseous component analyzed, and finally through chambers 3 and 4 and onto the two detectors 5 and 6 connected in opposition to each other; a measuring device 7 is inserted in the circuit. Chamber 3 is filled with the gas which is being determined; the object is to absorb completely the radiation at frequencies characteristic of this gas and prevent
254 SPECTRUM ABSORPTION METHODS IN ANALYSIS OF GAS MIXTURES
FIG. 95. The Pfund gas analyzer.
The chief merit of this analyzer is its simplicity. Its disad- vantage is that the signal (relative to total radiation) is s m a l l . Consequently, high sensitivity detectors and stabilized light sources must be used.
The most widely used units employ selective detectors. This type of analyzer, first proposed by Veyngerov [ 4 8 6 ] , was sub- sequently modified (see Fig. 96) by Luft [ 4 8 7 ] . Light beams are radiated from spiral coils / and 2, pass through a modulator
r-TL
ι 1 W
FIG. 96. The Luft gas analyzer.
it from reaching detector 5 . Chamber 4 is filled with any gas which does not absorb at these frequencies. Detector 5 thus indicates total radiation, except the fraction emitted by the gas to be determined.
Detector 69 on the other hand, indicates the total radiant flux. The difference in intensity between the two signals is thus a function of the unknown concentration of the g a s . The higher the unknown concentration, the c l o s e r will be the readings of detectors 5 and 6 (since the absorption in chamber 3 will tend to decrease—whatever radiation could be absorbed there is already absorbed by the sample).
stage 3, and are then directed, respectively, through chambers 4 and 5. The former is filled with the sample; the latter is empty and can be filled with any standard mixture.
Chambers 6 and 7, separated by a membrane strain gage 89 are filled with the gas whose concentration is unknown (selective d e - tector). Because the absorption is not the s a m e in chambers 4 and 5, there exists an absorption differential between chambers 6 and 7. If chamber 5 is empty, then because of previous absorption in 4 the absorption in 6 is s m a l l e r than in 7, A s a result, the gas temperature in the two chambers is different and a pressure dif- ferential is created. Unequal pressures acting on the strain gage can be converted to an alternating current, which is amplified in 9 and recorded by instrument 10. The composition of gases in the sample can thus be continuously monitored.
Gas analyzers operating on the principle of selective detection are far m o r e sensitive (but are also m o r e complex) than analyzers using selective filters.
Another gas analyzer whose operation does not involve light dispersion was designed by Veyngerov [486] and used for analyzing molecular gases and vapors. This optico-acoustic procedure is based on the fact that a 4'sound" will be produced in the gas a b - sorbing infrared radiation, if the radiant beam is interupped at an audio frequency rate. In the p r o c e s s of absorption, the gas becomes heated, and its pressure r i s e s . Because the radiant flux is inter- rupted at an audio frequency rate, the resulting pressure ripple in the gas produces a sound, which is recorded by a microphone.
The sound intensity depends on the capacity of a given gas for absorbing the radiation.
A block diagram of the optico-acoustic analyzer is shown in Fig. 9 7 . The source of the radiation is a platinum strip 4 (about 0.05 m m thick, 20 m m long and 15 m m wide) enclosed in a sealed
256 SPECTRUM ABSORPTION METHODS IN ANALYSIS OF GAS M I X T U R E S
The least complicated analysis by this method involves a binary mixture consisting of an absorbing and a non-absorbing gas. Galvanometer readings will in this case be a direct function of the concentration of the absorbing gas. The calibration curve is plotted with mixtures of known concentrations. Thus, calibration curves for carbon dioxide in air are shown in Fig. 98. The air is considered the non-absorbing component, since neither nitrogen nor oxygen absorbsIR radiation (the method is therefore inapplicable to analysis of oxygen-nitrogen mixtures, nor can it be used for
w
23
7
FIG. 97. Block diagram of an optico-acoustic gas analyzer.
metal case 3. The radiant flux emerging from the case through the uviol glass window 5 is interrupted with a frequency of 200 cps by means of a flicker shutter / mounted on the shaft of an electric motor 2. On passing through a fluorite window 6 the radiation falls into the audio-optical chamber 8. The gas sample is introduced into the s a m e chamber and flows through channels 7 and 10. The interior surfaces of the chamber are gold-plated and polished, hence l o s s e s due to reflection from the walls are negligible. The moving-coil microphone 9 is isolated from the chamber by a partition made of fine aluminum foil. The current set up in the microphone is amplified by a two tube DC amplifier
/ / , and is indicated by galvanometer 12*
Ο 20 40 60 βΟ 70Û C, % FIG. 98. Calibration curve for determining carbon d i - oxide - air mixtures. 1—
without filter; 2-with filter.
hydrogen, since the hydrogen molecules do not absorb in the near infrared). The calibration is steep at low concentrations, then the slope becomes flatter, and finally, at high *
concentrations, α (the galvanometer deflec- tion) becomes virtually independent of the C 02 concentration. The reason for this is that the energy absorption is determined largely by the mid-region rather than the fringes of the band. At high concentrations, nearly all of the mid-band is absorbed, so that increased absorption of the fringes contributes v e r y little additional energy.
Two methods were proposed by Veyn-
gerov and Luchin [ 4 8 8 , 489] for improving the analytical s e n - sitivity of this method at high concentrations. In the first p r o - cedure, a filter is inserted between the absorption chamber and the light source. The filter—a tube with reflecting walls, provided with windows transparent to radiation—is filled either with the gas whose concentration in air is to be determined, or with a mixture containing a known amount of this g a s . The fraction of radiation most intensively absorbed by the gas i s blocked by the filter. A s a result, the light flux entering the measuring chamber will be absorbed to a far l e s s e r extent, and the system will once again show its initial rectilinear characteristic (curve 2 in Fig. 98).
The second method is based on reducing the length of the a b - sorbing gas column. If this gas column is long, then the extent of radiant flux absorption is already high at low concentrations, so that an increase in concentration will not appreciably affect the amount of heat transmitted to the g a s . If, on the other hand, the column is short, the total heat transmitted to the gas will vary
258 SPECTRUM ABSORPTION METHODS IN ANALYSIS OF GAS MIXTURES linearly with the concentration, and this relationship can be taken a s a basis for an analytical curve.
The filter method i s suitable for analyzing mixtures consisting of two gases capable of absorbing radiation. This is true also in the case when the respective absorption spectra are quite d i s - s i m i l a r . A filter inserted between the absorption chamber and the radiation source traps the light flux in the spectral region corresponding to the absorption range of one component; then the sound will be produced by the other component of the mixture. The method is not always practicable in analyzing multicomponent mixtures.
A somewhat modified model was proposed by Veyngerov and Luchin [ 4 8 8 , 489] for the analysis of multicomponent gas mixtures. The sample (A + Β + C) is passed through an absorption tube situated between the chamber and the radiation source, rather than through the optico-acoustic chamber. The latter chamber is filled with the mixture component to be determined, for instance, A.
The radiation passing through the absorption tube will then be absorbed by the sample. The light flux falling into the optico- acoustic chamber is thus reduced, and as a result the sound in- tensity is attenuated. The attenuation increases with the concen- tration component A in the sample. The concentration of A is found from a calibration graph plotted for this component. A multicomponent mixture can thus be fully analyzed by filling the chamber successively with each component, and determining the concentrations with the aid of respective calibration curves. For convenience it is best to have a s many individual chambers a s there are components in the sample. In the measurement p r o - cedure, the chamber filled with the desired component is placed after the radiation source and the absorption tube. The needle of the output instrument will then indicate the concentration of this
component in the sample. A monochromatic radiation source [470]
must be used when analyzing samples containing components with overlapping absorption bands.
The principal advantages of Veyngerov's gas analyzer are its low limit of detection ( 1 03% ) and rapid response.
The theoretical e r r o r s inherent in the optico-acoustic gas analyzer were discussed by Sail' [490].
Infrared gas analyzers were also successfully used in de termina- tions of carbon and nitrogen isotopes [ 4 9 1 - 4 9 3 ] .
3 3 . ABSORPTION ANALYSIS OF GAS MIXTURES IN THE U L T R A V I O L E T
Until recently, UV absorption was rarely used for analysis of g a s e s . The reason for this is that very few gases absorb in the near ultraviolet (2000-4000 A ) , while the vacuum region, as mentioned e a r l i e r , was practically inaccessible to spectroscopic analysis.
An automatic, double beam UV gas analyzer (Fig. 99) has been designed by G l a s s e r [ 4 9 4 ] . Its photomultiplier s a r e hooked up in a bridge circuit. The analysis is of the flow type.
FIG. 99. Circuit diagram of Glasser's automatic gas analyzer. 1—Electrometer; 2,2!—radiation detectors;
3—absorption stage; 4,4»—modulators; 5—light source;
6—filter; 7,7·—condenser lenses; 8,8'—mirrors; 9,9'.- motors.
260 SPECTRUM ABSORPTION METHODS IN ANALYSIS OF GAS MIXTURES The analyzer uses a filter or a monochromator, depending on the specific analytical problem. The filters employed are of standard type, and any wavelength from 2200 to 12,000 A. can be used. The length of the absorption cell may be varied from several hundrdths of a millimeter to 200 m m . This enables the analyst to work with both low and high concentrations. Therefore the unit is so sensitive that it can detect concentrations of the order of 10~4%.
This analyzer has been used to determine hydrogen sulfide ( λ 3130 A ) , nitrogen dioxide ( λ 3650 A and λ 4050 A ) , chlorine ( λ 3340 Â and λ 3650 A ) , as well as phosgene ( λ 2540 Â and λ 2300 A ) . The ozone concentration in air can be determined from ozone bands in the 2 5 0 0 - 3 0 0 0 A region [ 4 9 5 , 4 9 6 ] , the limit of detection being 2 · 10~6%. A round-the-clock automatic recorder was d e - veloped for this application.
Quantitative analysis based on absorption in the UV region may prove an important tool in studying the kinetics of chemical reactions, for example, the reactions of atomic gases [497].
Various analytical techniques have been developed for working in the vacuum region. Chubb and Friedman [498] determined the water vapor concentration in air on the basis of the absorption of the hydrogen line La (1215 A) in the λ 1220 A band (molecular nitrogen and molecular oxygen are almost transparent in this region). A photon counter sensitive within a very narrow region near 1216 A served as the detector, eliminating the need for a monochromator. According to the authors, this method is suitable for measurement of traces of molecular oxygen in rare g a s e s , nitrogen and hydrogen. Garton, Webb and Wildy [499] determined the water content of nitrogen, oxygen and carbon dioxide, on the basis of the La (1216 A ) absorption in the λ 1220 A band. The hydrogen line La was excited in an electrodeless discharge at 20 M c The absorption vessel had lithium fluoride windows, and the
radiation was detected by means of a tungsten-cathode photomul- tiplier sensitive in the range starting with 1400 Α.. Two absorption tubes 1 cm and 42 cm long were used. Sensitivity was improved by means of aluminum m i r r o r s , which caused the light to be r e - peatedly transmitted through the absorption cell. The limit of detection was 10~4% for nitrogen, 10 3 % for oxygen and 10~2% for C 02.
Oxygen analysis based on absorption in the Schumman region was described by Prugger and Ulmer [ 5 0 0 ] . The oxygen was d e - termined in the presence of nitrogen, carbon dioxide and water vapor, the oxygen content varying from 11 to 20%. Water vapor absorbs in the s a m e spectral region a s oxygen, which complicates the analysis. While this reduces the accuracy, the analysis is still feasible, since in one spectral region (1600-1350 A) oxygen absorbs m o r e intensively than does water vapor and, in addition, its concentration in the sample is several times higher. The method is thus suitable only for determining high concentrations of oxygen.
The accuracy of analysis is about 1%. The emitter (source) and absorption element a r e so selected that there will be no need for a monochromator. A hydrogen lamp with a thin quartz window p r o - vides a continuous spectral source, while the tungsten cathode acts as a selective pickup. The arrangement is adaptable to a continuous analysis; besides this is necessary because of rapid changes in the oxygen content of s a m p l e s .
F r o m the examples cited above it is evident that the vacuum UV region can be successfully used for determining the c o m p o s i - tion of gaseous mixtures.
Spectroscopic determinations in the UV can also be carried out with the aid of optico-acoustic analyzers [ 5 0 1 ] . The optico- acoustic effect in the UV region has been observed in nitrogen, oxygen and acetylene.