Chapter IV
METHODOLOGICAL PROBLEMS
15. RELATIONSHIP B E T W E E N LINE INTENSITY AND CONCENTRATION OF AN E L E M E N T IN A M I X T U R E
The objective of quantitative spectral analysis is to establish a relationship between line intensity and concentration of an element in a mixture. Existing analytical procedures are based for the most part on determination of the relative intensities of the lines of the element being analyzed and those of a comparison (refer- ence) element [ 2 5 , 3 1 5 ] . The comparison standard is either the principal constituent of the mixture or an element added for this purpose.
Two cases should be distinguished: when the ionization poten- tial of the admixture (or minor constituent) to be determined is greater than that of the principal component, and vice versa.
Let the principal component be denoted by A , the minor one by B, and their ionization potentials by VA and VB, respectively.
Consider the first case: VB> VA. If the concentration of Β is low, its changes will not affect the discharge conditions. Con- sequently, f(Te) = const and ne = const. Then from relationship
127
128 METHODOLOGICAL PROBLEMS
(1.7) we can write for the intensities of spectral lines A and Β
IA = aNA, IB — bNB, (4.1) where a and b are proportionality constant, while NA and NB are
the concentrations of normal atoms of the components in the m i x - ture. The value of NA can be considered constant, while NB is proportional to the concentration of element Β in the mixture ( CB) . Then
- ^ = * Cß, (4.2)
where α is a proportionality factor. Therefore, in this case the ratio of line intensities of the minor to the principal constituent varies linearly with the concentration of the minor constituent.
Next, consider the second case: VB < VA. Then the electron temperature cannot be assumed constant, since the concentration of the readily excited component varies (see Section 2 ) . Hence
ΙΒ =
ΝΒ/ΒΡ.).
lA = NAfA{TT), (4.3) where fß(Te) and fA(Te) are monotonically increasing functions ofthe electron temperature.
The electron temperature falls with a rise in concentration of the readily excited component. This causes an overall decrease in line intensities which is m o r e pronounced in the lines of the difficult-to-excite component. Thus, a higher ratio of line inten- sities of the minor and the primary constituent is due to two factors: a lower electron temperature and a higher concentration of the minor constituent. It follows that
^ = *f(NB)NB, (4.4)
where f(NB) is a montonically increasing function of the concen- tration of the atoms of the minor constituent (NB). Expressing NB
in terms of CB. , we have
LINE INTENSITY AND CONCENTRATION OF AN E L E M E N T 129
7 ^ - P / ( CB) CÄ. (4.5)
Here β is a proportionality factor, while f(CB) is a montonically increasing function of the concentration of B.
Thus the relative intensity of the lines of the minor and prin- cipal substances is no longer a linear function of the concentration of the minor constituent.
In isothermal sources the temperature, as a rule, does not vary appreciably with the concentration of the minor constituent.
Hence there is a linear relationship between the intensity of the line for that constituent and its concentration in the discharge, provided no re absorption is involved.
In order to make a judicious choice of operating conditions for a gas mixture analysis it is essential to determine the effect of the various discharge parameters on the ratio of line intensities of the two components in the gas mixture. Assuming one of the components to be easy to excite and the other difficult to excite, we shall first show how the above ratio varies with p r e s s u r e , current and tube diameter.
The electron temperature decreases with p r e s s u r e , which in turn decreases the line intensities of both components. If VA > VB, a decreasing temperature will cause a sharper decrease in the intensity of the line for A than in that for B. Hence the ratio
1 A /1 Β decrease with increasing p r e s s u r e . It follows that a high p r e s s u r e is necessary for determining a s m a l l quantity of a readily excited impurity in a difficult-to-excite primary substance.
Analogous considerations lead to the conclusion that a low pressure must be used for determining a s m a l l admixture of a difficult-to- excite component in a readily excited primary substance. Actually, some optimal intermediate p r e s s u r e is usually chosen; it should
130 METHODOLOGICAL P R O B L E M S
FIG. 60. Effect of the diam- FIG. 61. Effect of the discharge current eter of the discharge tube on on the relative line intensities for neon relative line intensities of and argon,
helium and argon.
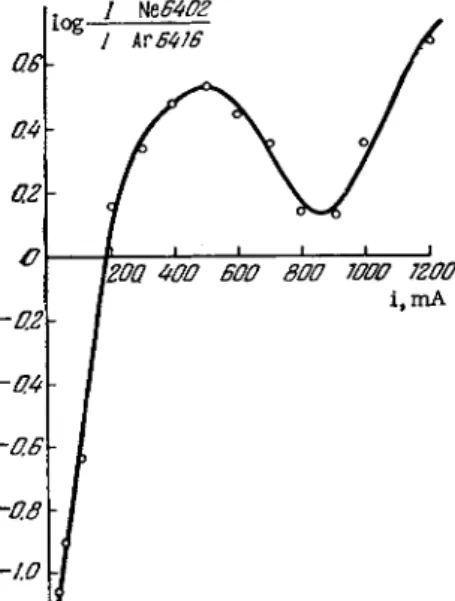
The effect of the current on the relative line intensities for neon ( λ = 6402 A) and argon ( λ = 6416 Â) is shown in Fig. 6 1 . The conditions were: tube diameter, 20 m m ; tube p r e s s u r e , 0.7 m m Hg; 10% argon in neon. The observed lack of monotonicity in the not be too low to avoid an excessive reduction of the total radiation intensity.
The electron temperature also drops with an increase in the discharge tube diameter [ 9 1 , 9 9 ] . The sensitivity of spectral anal- ysis for difficult-to-excite elements will thus improve in narrow discharge tubes. The effect of the discharge tube diameter on the relative line intensities o f h e l i u m ( X = 5876 Â ) a n d a r g o n ( X = 6416k) is shown in Fig. 60 [365]. For low currents the ratio of line inten- sities increases with the current up to saturation. In s o m e cases a further increase in the current may reduce the line intensity ratio.
LIGHT SOURCE AND ANALYSIS CONDITIONS 131 functional relationship is readily understood if we recall that even
the absolute intensity of a spectral line may decrease with increas- ing current [ 9 4 ] . The intensity decline varies in different lines, because the line intensity depends on both the electron concentra- tion and the electron temperature, as shown by Eq. (1.9).
16. LIGHT SOURCE AND ANALYSIS CONDITIONS
In an earlier chapter we discussed excitation processes in various light sources, as well as the effect of the discharge p a r a m - eters on the concentration of excited atoms and the line intensity.
A light source for spectral gas analysis can now be chosen with some understanding of the problems involved. These problems fall into two groups: those associated with the mechanism of spectrum excitation in gases and those related to changes in the composition of the mixture that take place during the discharge [ 3 6 5 - 3 6 9 ] .
P r o c e s s e s associated with the mechanism of spectrum excita- tion will be discussed first. Most light sources will tend to excite mainly that component of the gas mixture which has the lower critical potential. This is because the temperature of the source is determined by that mixture component which has the lower ionization potential. This was shown to be true for the positive column of a glow discharge by Dorgelo [102] and Zaytsev [101].
Analogous conditions exist in an arc discharge [ 2 5 ] . Because of the electron temperature drop, the lines of the element with the higher excitation potential do not appear in the spectrum.
In spectral analysis of metals and alloys (and of minerals and ores) we are confronted with a similar problem of mixtures whose constituents differ in critical potentials, but the situation is not quite the s a m e as before. For one thing, the difference between the excitation potentials is much s m a l l e r than in the case of gases.
132 METHODOLOGICAL P R O B L E M S
•See [209], table on p. 57.
Moreover, it is possible to use light sources in which the electron temperature is less affected by such differences. A s a result, the differences in the excitation potential of the constituents do not materially affect the sensitivity of analysis, and may not even be the decisive factor. For example, the sensitivity of determination of cesium is considerably lower than that for beryllium, even though the ionization potential of cesium is much lower than that of beryllium.* On the other hand, the ionization potentials of gases differ so greatly that at low current densities many light sources, m o r e specifically the positive column of a glow discharge, may fail to show a constituent even when the latter is present in large amounts (for example, 20-30% helium in nitrogen).
In order to improve the sensitivity of the determination of the difficult-to-excite component, analyses of these gas mixtures should be carried out in a low pressure discharge. Such light sources, however, contain nonisothermal p l a s m a s , and thus the excitation conditions may not always be advantageous for analysis.
Many experimenters have pointed out, for example, that the effect of a third component becomes very pronounced under these con- ditions and changes the ratio of line intensities of the minor and primary constituents. Thus the addition of nitrogen weakens helium lines [370], while the addition of argon affects both helium and neon lines [371]. Both electron temperature variations and colli- sions of the second kind may be responsible for such changes.
Analysis of gas mixtures involves further difficulties because the resonance lines of gases lie in the far ultraviolet, and con- sequently vacuum-type spectroscopic equipment is required for their recording. Today such equipment is readily available so that wavelengths below 2000 Â have been increasing in practical
LIGHT SOURCE AND ANALYSIS CONDITIONS 133
Kf2
importance. The large amount of work on the determination of g a s e s in metals carried out by Vodar et a l . [372] was confined to that spectral region.
In the analysis of gas mixtures, the vacuum offers a double advantage over the other regions in that it makes possible the utilization of both the resonance lines of atoms and the lines produced by multivalent ions. Gas analysis in the far ultraviolet is hampered by unavailability of materials which are transparent to spectra below 1000 Â . An experimenter working with conven- tional spectral equipment must therefore confine himself to less sensitive spectral lines.
Light sources characterized by a high electron temperature concentration are the most suitable for the determination of the
difficult-to-excite component. A high e l e c - tron temperature is needed so that a large fraction of the electrons can acquire suf- ficient velocity to produce excitation of the difficult component (a Maxwellian e l e c - tron velocity distribution is assumed).
When the electron concentration is high, the excitation process is stepwise. This is evident from the following example [367], Consider the case where the resonance line of a difficult-to-excite component v0i lies in the far ultraviolet region (Fig. 62). Given a high electron con- centration, the mechanism of excitation of line v2i, which lies in the visible portion of the spectrum and is suitable for analysis, may be stepwise and involve a s m a l l e r energy consumption VB than used in direct excitation, VB. Stepwise excitation becomes especially significant in cases where metastable atoms are present.
Stepwise excitation, furthermore, makes possible the simultaneous appearance of lines of ions of both components of the mixture. In
VM Metastable level
FIG. 62. Stepwise excitation of the various levels.
134 METHODOLOGICAL P R O B L E M S
s o m e instances (e.g., in the system nitrogen-argon), the ionization of both components greatly improves the sensitivity of the argon determination, because the excitation potentials of the nitrogen bands are considerably lower than those of argon, while the e x - citation potentials for the lines of ionized nitrogen differ very little from those for ionized argon.
We shall next consider the case of a gas mixture excited in a pulse discharge, where the electron concentration is high. By varying the discharge conditions, it is possible to excite the ion lines of the gas with the lower excitation potential, as well as the atom lines of the gas with the higher excitation potential. A requisite high electron temperature is obtained at a low p r e s s u r e , using a narrow discharge tube. A high electron concentration can also be produced in the cathode fall region of a glow discharge, especially inside a hollow cathode, as well as in narrow discharge tubes and in pulsed light sources.
It follows that s m a l l concentrations of a difficult-to-excite component must be determined at low p r e s s u r e s , either in a high- frequency glow discharge produced in a narrow capillary, or in a hollow cathode [367]. The selection of the pressure should then be based not only on the relative intensity of the lines of the minor and principal components of the system, but also on their absolute intensities. It is therefore not advisable to use e x c e s - sively low pressures since this results in an extremely faint glow. In any case, the optimum pressure must be determined experimentally. In determining s m a l l amounts of the difficult- to-excite component, one can also use pulsed sources, but the analysis should be carried out at high p r e s s u r e s (of the order of several m i l l i m e t e r s ) . This is because in a pulse discharge a higher pressure produces a greater brightness of the flash, and hence a higher sensitivity of the determination. The method of
LIGHT SOURCE AND ANALYSIS CONDITIONS 135 time-resolved spectra can be used to advantage in analyzing gas mixtures in pulsed sources. This method has s o m e clearly superior features and is now widely used in spectral analysis [273]. In analyses for s m a l l amounts of an easily excited component, a high sensitivity may be achieved by using the positive column of a high pressure glow discharge, as well as large-diameter tubes.
In many cases (see Chapter V) a narrow capillary rather than a large-diameter tube is used because this permits carrying out the analysis at near-atmospheric p r e s s u r e s . In addition, high current densities increase the total radition brightness.
Complete qualitative analysis of a system requires a light source capable of simultaneous excitation of all the components.
This is achieved in the four-electrode discharge tube of Frisch [373] (see Fig. 25b, p. 66). This tube is capable of producing three types of discharge. When electrodes 1 and 2 are interconnected and used together as the cathode, and electrode 3 is the anode, the discharge has properties resembling those obtained in a hollow cathode. With electrodes 3 and 4 one obtains an ordinary glow discharge, while the combination of electrodes 1 and 2 produces a glow discharge characteristic of closely spaced electrodes. The last type of discharge is m o s t suitable for analyzing mixtures containing equal amounts of e a s y - and difficult-to-excite gases.
The presence of internal electrodes is a disadvantage of this tube, since it can be used only for analysis of flowing g a s e s .
In s o m e cases it is convenient to install a set of various d i s - charge tubes on the vacuum spectrograph, and to use that tube which gives the highest sensitivity in the given application.
A capillary tube closed at one end and connected to a Topler pump (see Section 8) is also usable. In this tube the glow region can be excited over a broad p r e s s u r e range ( 1 0 -3- 6 x i œ2 m m Hg) by external electrodes coupled to a high-frequency generator.
136 METHODOLOGICAL PROBLEMS
Both the high-frequency glow discharge and the ring discharge are used in gas analysis. It was demonstrated [237] that conditions existing in a weak glow discharge are m o r e favorable for deter- mining the difficult-to-excite component. Considerable advantages are associated with a discharge with a frequency of the order of 102 - 1 03 M c / s , since in this frequency range the total brightness of the discharge increases, the sensitivity of determining the difficult-to-excite component is improved [241], and gas adsorption by the walls of the discharge tube is lower [240].
Let us now consider the second group of analytical difficulties, i.e., changes in the composition of a mixture occurring in the discharge process. Such changes result from different rates of adsorption of the components of the mixture by the walls and the electrodes of the discharge tube. The gas adsorption is strongly dependent on the history of the tube, i.e., the duration of previous discharges; therefore, material from the same gas sample may not give the same spectrum on repeated analysis. Phenomena of this type are difficult to control. Prolonged conditioning (repeated use) of the discharge tube is the only way to eliminate the effect of previous discharges. Chemically active gases are adsorbed far m o r e readily than inert g a s e s , and in addition they may react with the electrode material. Such processes are all the m o r e important since the m a s s of the gas is generally negligible c o m - pared with the m a s s of the walls and the electrodes.
To reduce gas adsorption during discharge, one must either work with a continuous flow of the gas being analyzed or use a light source operating with external electrodes. In such a source gas adsorption during the discharge is considerably reduced and the preliminary conditioning period of the tube is thus much shorter. The tube should be of a chemically stable, poorly adsorb- ing material. Fuzed quartz appears to offer many advantages
CALIBRATION C U R V E S AND S E L E C T I O N OF LINE PAIRS 137 over g l a s s , although glass tubes have been used in many cases with good results.
A high-power pulse discharge, probably because it is short and the electrode sputtering is slight, has little if any effect on the composition of the mixture, despite the presence of internal electrodes.
Connecting an auxiliary v e s s e l , filled with the s a m e gas m i x - ture, to the discharge tube helps to reduce the effect of gas adsorp- tion on the composition of the mixture, since the adsorption loss may be compensated by diffusion of fresh portions of the mixture into the tube.
Analysis of a specific mixture may require some specific p r o - cedures. For this reason, the optimum excitation source can only be determined experimentally. The critical excitation parameters are the discharge tube diameter (which determines the current density) and the p r e s s u r e . Some paradoxes do occur, however, because it has been found that the s a m e analytical problem may occasionally be solved either by using a narrow tube at high p r e s - sures or a large-diameter tube at low p r e s s u r e s .
17. CALIBRATION CURVES A N D SELECTION OF LINE PAIRS FOR ANALYSIS
The many methods of quantitative spectral analysis now avail- able [ 2 5 , 3 1 4 , 3 1 5 , 3 1 7 , 3 7 4 , 375] are all based on variation of intensity of a spectral line with the concentration of the element in the gas system. In most cases the concentration is determined from the relative intensities of the lines of the minor and primary
constituents. Indeed, quantitative analysis was not possible until the relative-intensity method came into use. Now that stable discharge conditions can be attained and photoelectric recording of spectra is standard, new techniques designed to measure absolute intensities
138 METHODOLOGICAL P R O B L E M S
are being considered. In s o m e cases analyses based on absolute intensities may indeed prove m o r e accuate than the relative intensity procedures [361]. Nevertheless, at present it is the relative intensities that are usually measured.
According to Eq. (4.2),
Ά
where IB is the line intensity of the minor component (admixture), I A is the line intensity of the principal component, CB is concen- tration of the Β, and α is a proportionality factor.
Taking the logarithm of this expression, we obtain
i o g - ^ = l o g Cß + a, (4.6)
1A
where a = log a. If Eq. (4.6) is plotted, with the logarithm of the ratio of the line intensities of the minor and principal constituents on the ordinate and the logarithm of the concentration of the desired element along the abscissa, the graph will be a straight line with a slope equal to one.
However, the intensity of a spectral line cannot always be assumed proportional to the concentration of the element in the mixture. Thus, at high concentrations, the effect of radiation r e - absorption must be taken into account (see Chapter I). In this case, the observed intensity of the spectral line is lower than the intensity of radiation emitted inside the light source because that radiation is partly reabsorbed before leaving the source. The highest reabsorption is observed in resonance lines and lines corresponding to transitions to metastable levels. Because of r e - absorption, the line intensity increases with concentration at slower rates than would be expected for a linear function. W e may take
CALIBRATION C U R V E S AND SELECTION OF LINE PAIRS 139
(4.7) where b < 1. The coefficient b characterizes the rate at which radiation is reabsorbed. When there is no reabsorption, 6 = 1. The value of b is constant only within relatively narrow ranges of concentrations (roughly, ± 500% around the mean value of the range). Reabsorption increases with higher concentration of ad- mixture, and the value of b thus decreases. Taking the logarithm of Eq. (4.7), we get
where a = log a'. The curve of log (fB/fA) as a function of log CB is called the rise curve. Over the narrow concentration range where the value of b is constant, the rise curve is a straight line with a slope equal to b [ 2 5 ] .
It follows that within a moderately broad concentration interval, in the case where the electron temperature is not dependent on the concentration of the element in the mixture, there exists a linear relationship between the logarithm of the ratio of line intensities and the logarithm of the concentration of the element. If there is no reabsorption, the straight line expressing log (! B/! A) as a func- tion of log CB has a slope of 1, and where reabsorption is involved, the slope is 6.
The relative intensities can be measured in several ways:
visually, photelectrically and by photographic photometry.
Calibration curves for photographic recording
When the image density values of both spectral lines (SB and SA) fall within the range of the straight-line section of the character- istic of the photographic plate, it can easily be shown that
log b\ogCB + a, (4.8)
LS = S (4.9)
140 METHODOLOGICAL PROBLEMS
where Δ 5 is the difference in image densities and γ is the contrast factor.
To obtain a comparison, one records on the s a m e plate the emission of both the standard and the analyzed mixtures. The e x - posure conditions for all spectra being compared must be absolutely identical. Assuming that these conditions are observed, one can then obtain a calibration curve, since within the confines of a single plate 7 is constant. The curve is plotted on AS and log CB a x e s . Then one measures the difference in image densities of the lines of the desired component and the reference in an unknown mixture.
The value of AS is computed from the calibration curve and the con- centration of the desired component is determined from these data.
In principle, the calibration curve should be a straight line.
However, the p r o c e s s e s occurring during excitaton of the spectrum are so complex that departures from linearity are quite possible (see Section 15). For this reason, at least three standard mixtures must be used for plotting a calibration curve, since at least three points are needed to determine whether the curve is linear. If it is not, a greater number of standard mixtures will be needed.
F r o m Eqs. (4.8) and (4.9) we can write
kS=ib log CB + d, (4.10)
where ci is a constant. The slope of this curve (γ6) is constant only for a particular plate, and will vary from one plate to another, depending on the type of plate and the development conditions.
This procedure is known as the method of three standards.
An alternative procedure for plotting calibration curves is the permanent-graph method. The values of A S / τ are plotted along the ordinate and the logarithm of the concentration values along the abscissa. Combining Eqs. (4.8) and (4.9), we get
CALIBRATION C U R V E S AND SELECTION OF LINE PAIRS 141
^ - = b log CB + d', (4.11)
where d' is a constant.
The calibration curve A S / T = / ( l o g CB)9 derived from one plate, can be used for analyzing mixtures whose spectra have been photo- graphed on a different plate, since the ratio AS/Ί does not depend on either the plate characteristics or the development conditions. In theory, a curve, once plotted, can be used for a long time; in practice, however, such curves are known to undergo parallel shifts with time [376]. It is therefore advisable, prior to using the permanent-graph method, to photograph one control standard [315], check the position of the calibration curve with it, and in- troduce the corrections which may become necessary should the position of the curve change (the control standard method).
To determine the value of γ an image density curve must be plotted for each plate or emulsion. The control standard method thus requires that each plate carry one photograph taken with a step reducer and at least two photographs of the control standard.
The rest of the photographs are of spectra of the mixtures to be analyzed.
We have not mentioned here the modifications of these two basic methods for plotting calibration curves [315]. The permanent- graph procedure is advantageous when a large number of analyses is required since the labor involved in plotting the graph is then compensated by time savings achieved in subsequent analyses.
However, the expenditure of this labor is not justified when only occasional analyses of a given range of compositions is required.
Graph distortions are often caused by the background effect, which 1) lowers the sensitivity of the analysis, 2) causes deviations of calibration graphs from linearity, and 3) increases the analyti- cal e r r o r .
142 METHODOLOGICAL P R O B L E M S
A s s u m e that lines A and Β appear against a fairly strong background and that the ratio of their intensities must be deter- mined. To account for the background, its density must be evalu- ated separately in the spectral region surrounding the lines A and B. If the intensity distribution of background lines is nonuni- form, its density should be measured on either side of the measured line and the results averaged. The intensities corresponding to the measured background densities are then found from the curve.
If we set I A and IB as the intensities of lines A, B; l\ and if as the background intensities in the vicinity of lines A and B, r e s p e c - tively; and IA + b and / B + b as the total intensities of each line plus the background, then the desired intensity ratio will be given by
Having determined the intensity ratio for two spectral lines, we can now take the logarithm of this ratio and plot the calibration curves in the usual way, allowing for the background.
The above methods for plotting calibration curves can be used only when the plate or film is equally sensitive to and provides the s a m e contrast for both the measured and the reference spectral lines.
In many types of work, including spectral analysis of gas mixtures, the spectral line intensities vary because not only the concentration of the elements of the mixture (including that of the desired component) changes, but also the discharge conditions vary (see Section 15). Then, from Eq. (4.5) and allowing for reabsorp- tion, we may write
(4.12)
-£ = Yf(CB)C%. (4.13)
CALIBRATION C U R V E S AND SELECTION OF LINE PAIRS 143 The exact form of the function f(CB) cannot be determined from theoretical considerations; however, within a narrow range of con- centrations it may be assumed, with a fair degree of accuracy, that
f(CB) = kCnB, (4.14)
where k is a proportionality factor and η is positive. Hence
l*- = k'C¥b. (4.15)
1A
Taking the logarithm of the above expression and rewriting it in the conventional form, we obtain
log 4*- = (n + b) log CB + a', (4.16) 'a
where a' is a constant. A s we compare this equation with (4.6) we note that the slope of the straight line described by (4.16) is steeper than that of (4.6), implying a higher analytical accuracy. Indeed, it has been repeatedly demonstrated that even when a higher con- centration of one of the components of the mixture alters the d i s - charge conditions, the calibration curve generally remains a straight line. This confirms the validity of the empirical equation (4.14). Because of this linearity, three standards suffice, as a rule, for plotting the calibration curve.
Plotting calibration curves when photoelectric recording is used
In photoelectric recording the intensity of a spectral line is measured by projecting its image directly onto the photocathode of the detector photocell or photomultiplier [25, 317, 3 4 8 ] . The photoelectric signal is amplified in a DC or A C amplifier, so that the current from the detector is a measure of the concentration
144 METHODOLOGICAL PROBLEMS
of a given element in the mixture.* In addition to being m o r e a c - curate and sensitive than photographic recording, the photoelectric method saves much time and labor and is therefore indispensable for quick analysis.
In general, calibration curves based on photoelectric intensity measurements are not plotted on a logarithmic scale and conse- quently are not linear. The calibration curve is prepared on the basis of standard mixtures. However, several points on it must always be rechecked right before the analysis. With photoelectric recording it does not matter whether the method of three standards or the permanent-graph method is used for preparing the curve.
Linear curves are obtained by replotting the data on logarithmic s c a l e s , or by restricting the calibration curves to very narrow concentration ranges when ordinary coordinates are used. The deviations from linearity of the curves caused by the presence of background radiation must be corrected, either by the methods specified in the case of photographic recording or by adjusting the detector output current to compensate for the current produced by the background. A method of photoelectric measurement where the background is automatically compensated for is described in [348].
The addition method
The addition method [209, 3 1 5 , 3 7 7 , 3 7 8 ] , now widely used when working at low concentrations, must be resorted to when standards cannot be prepared because the principal substance is not avail- able in spectral purity, or when the effect of a third-component must be compensated. There are many known modifications of this procedure. One of them, termed the method of successive approximations, is as follows. Let the content of the desired
* It is, of course, essential that the amplifier be linear.
CALIBRATION C U R V E S AND SELECTION OF LINE PAIRS 145
FIG. 63. Calibration curve obtained by the ad- dition method.
is obtained. At large η the initial concentration χ is negligibly small in comparison with Cn and the curve becomes a straight line (in Fig. 63, this happens at C4) . The linear section of the curve is then extended until it intersects the abscissa and is assumed to be the actual representation of the concentrations in the mixture which, together with the measured intensities, serves to determine the values of Cx + x, C2 + x, C3 + x. Knowing Cl9 C2 and C3., three values of χ can then be calculated and averaged. This averaged value is now added to each concentration C , and the calibration curve is replotted. If the new curve is linear, it proves that χ has been correctly determined. Should the curve depart from linearity in the range of low concentrations, a new correction is introduced, and the procedure is repeated until a satisfactory curve is obtained.
element in the starting sample be x%. A series of standards is then prepared, with the desired element added to each in quantities C\, C2, . . . , Cn (Ci < C2 < . . . < Cn) . The new concentrations thus will be C! + x, C2 + * , . . Cn + x.
In plotting a calibration curve based on the above standard m i x - tures the effect of the background must be eliminated. If log (ijiA) is plotted on the ordinate and the logarithms of the incremental concentrations along the abscissa, the curve shown in Fig. 63
146 METHODOLOGICAL PROBLEMS
A recent modification of the addition method that has been adopted in ore analysis is described in [379].
The addition method should find extensive application in analysis of gas mixtures because spectral purity gases are very difficult to prepare and, since the sensitivity of analysis keeps on increas- ing, the requirements for gas purity will become m o r e stringent.
The addition method may thus prove the only procedure suitable for determining low concentrations of impurities or for analysis of multicomponent gas mixtures.*
The addition method is applicable to photoelectric recording if only the calibrating curves are plotted on logarithmic scales.
Otherwise, the curve will deviate from linearity not only because of the presence of impurities in the starting gas mixture, but also because of the reabsorption of radiation, or because of other factors that invalidate the assumption that the line intensity is proportional to the concentration over a sufficiently wide range of C values.
Selecting analytical pairs
The accuracy and sensitivity of analysis depend to a large e x - tent on the choice of analytical lines. If the component to be determined is present in very low concentrations (that is, in con- centrations in the vicinity of the threshold of sensitivity) then o b - viously one has no choice and the best available analytical line is selected (sometimes only one line is available). If, however, the component is present in a concentration large enough to produce several good lines, then one should select the line that is most sensitive to changes in concentration, that is, the line whose
*A special modification of the addition method, useful in analysis of isotopes, was proposed by Ivanov [380],
CALIBRATION C U R V E S AND S E L E C T I O N OF LINE PAIRS 147 intensity varies most markedly with changes in concentration.
As was pointed out earlier, the slope of a calibration curve d e - c r e a s e s when reabsorption of radiation is present. Therefore, the sensitivity of the analysis can be improved by using weak lines, since they are l e s s subject to self-absorption. However, the use of weak lines is not altogether advantageous because background radiation then becomes an important factor, decreasing the slope of the calibration curve. It follows that the analytical line should be of medium intensity.
The reference line must satisfy the following requirements:
1) it must be homologous with the line of the component being sought; 2) its intensity should remain approximately constant over the range of concentrations involved and should not deviate greatly from that of the ''unknown*' line; and 3) its position in the spectrum must be sufficiently close to the unknown line.
Let us examine the first requirement in s o m e detail. Lines are considered homologous if they respond to an equal extent to changes in the discharge conditions. In the case of isothermal light sources, the lines that satisfy this requirement are those emitted by atoms that are ionized to the s a m e extent and whose excitation potentials do not differ greatly. The case of nonisothermal light sources involves one m o r e requirement: the peaks of the excitation functions of both spectral lines must correspond to the s a m e excitation potential.
In practice, however, analytical pairs are seldom selected on the basis of the theory. M o r e often than not, the extent of homology is tested experimentally. The discharge conditions (current and gas pressure) are varied without changing the gas composition, and the pair of lines whose intensity ratio varies the least is selected for the purposes of analysis. Occasionally one is lucky and able to choose a pair of lines whose relative intensities do not
148 METHODOLOGICAL P R O B L E M S
vary even with large changes in current and pressure. Spark lines should be avoided if possible, since under conditions of stepwise excitation their intensities vary directly as the square of the c u r - rent [ 6 3 ] , and thus even slight changes in the current produce large variations in line intensity. This is not the case with arc lines, which generally reach saturation at high current densities and whose intensity thus becomes independent of the current.
If the discharge conditions vary with the concentration of d e - sired component (for example, when determining s m a l l concentra- tions of an easily excited gas in a hard-to-excite gas), then the steepest slope of the calibration line is obtained with that line of the principal substance whose intensity exhibits the sharpest variations with changes of concentration of the minor component.
Therefore, this line should be selected as a reference.
It is very seldom, however, that all the stated requirements can be met under actual working conditions. A compromise must be made and that pair of lines selected which ensures the highest possible analytical accuracy. The final selection is based on results obtained by testing several pairs of lines.
Another technique that has proved useful is based on introducing into the sample a foreign reference element, e.g., a metal. If the light source employs internal electrodes, one of these e l e c - trodes is usually made of this metal. In the case of gas mixtures, the auxiliary reference component is a gas, which is introduced into the discharge tube in rigorously controlled quantities (see Section 2 4 ) . The lines produced by the auxiliary gas serve as reference lines. This technique is generally resorted to when the lines produced by the principal component of the mixture cannot be used as references, for example, when the principal component e x - hibits only a few lines in the desired spectral region, or when its ionization potential differs too greatly from that of the minor
ANALYSIS OF MULTICOMPONENT MIXTURES 149 components. Differences in ionization potentials result in p r o - nounced variations in the line intensity of the principal component with changes in concentrations of the minor ones. Thus, the lines of the principal component cannot be used as references in anal- ysis of multicomponent mixtures.*
18. ANALYSIS OF MULTICOMPONENT MIXTURES So far, we discussed methods pertaining to analysis of binary gas mixtures. W e have seen that even in that case the relative intensities of a pair of lines are not necessarily linear functions of concentration of the minor component. The relationships being even m o r e complex in multicomponent mixtures, the possibility of analyzing such mixtures with the excitation sources now in existence would s e e m to be precluded, at a first glance. This is because factors such as the strong dependence of the electric parameters of the discharge on the gas composition in the tube, the possibility of inducing uncontrollable reactions between components in the discharge, collisions of the second kind, etc., become important in that case. However, various analytical techniques have been d e - veloped specifically for work with complex multicomponent gas mixtures.
These techniques can be divided into two groups. The first is applicable in those cases where the analysis of a multicomponent mixture for each of its constituents can be reduced to the analysis of a binary mixture, i.e., where the effect of the other components on the relative intensities of a given pair of analytical lines can be virtually eliminated. This is achieved by stabilizing the excitation conditions. One of the simplest such techniques was proposed by
*In analyzing binary mixtures, on the other hand, a difference in ionization potentials between the unknown and the reference components is advantageous, since it tends to increase the slope of the calibration curve (see above).
150 METHODOLOGICAL P R O B L E M S
Duffendack and Wolfe in 1939 [381] for the analysis of an H2-N2-CO2-O2 mixture. The mixture was diluted with helium (at least 1:10) and then argon was added as an internal reference.
The dilution with helium greatly reduced the concentration of the various components so that the latter ceased to affect the discharge conditions. The same technique made it possible to analyze air without correcting for the effect of oxygen [382].
The excitation conditions can also be stabilized by introducing a component with an ionization potential lower than that of the d e - sired minor constituent [383]. However, this technique, which is widely used in conventional spectral analysis, occasionally lowers the sensitivity of the analysis.
In many cases the third component does not interfer if its con- centration is of the s a m e order as that of the other minor component.
This is the case in analysis for nitrogen and hydrogen in helium [384] (see Section 26).
The second group of methods consists of techniques which cope with the effect of the third and further components by means of sets of calibration curves [371] (see section 24).
The calibration curves of complex mixtures are shifted by comparison with curves for binary mixtures. The shift is caused by the component with the lowest excitation potential. Argon is such a component in an He-Ne-Ar mixture. The neon does not interfere with the determination of the argon. Therefore the argon concentration is determined by the conventional method. Then a set of calibration curves for neon intensity at various argon concentrations is prepared. This is a relatively simple case, because the third component may not only cause a parallel shift of the calibration curves, but may also change their slopes. A detailed description of specific procedures for analysis of multi- component mixtures is given in Chapter V.
MICROANALYSIS OF GASES 151 The addition method (see Section 17) may also be used: it
is sufficiently accurate and sensitive to determine the concentra- tions of all the constituents of a complex, multicomponent gas mixture. However, this analytical procedure is extremely laborious and time-consuming; hence its use is limited to a few cases. It is employed primarily in the preparation of standard mixtures con- taining an impure principal component. It is further used for check- ing standards.
19. MICROANALYSIS OF GASES
It is sometimes necessary to determine the composition of a s m a l l quantity of a gas mixture at a very low total p r e s s u r e . For example, such analyses may have to be performed when experi- menting with gases liberated by metals on heating or during chemical reactions. Similar problems are involved in analyzing gases desorbed from solids, or air samples from the upper at- mosphere. In such cases the analyst must work with minute quantities of the gas (of the order of hundredths of a m i l l i g r a m ) , and therefore the analytical procedure must be highly sensitive.
Analysis of such minute quantities is known a s microanalysis.
The methods of chemical microanalysis has been described in [385] and [386] ; they require at least 1 m m3 of the gas at atmospheric p r e s s u r e . In many c a s e s , however, the available sample consists of 1 m m3 at 1-2 m m H g and even l e s s , and the techniques of chemical microanalysis are not applicable. Such minute samples may be subjected to spectral analysis, but this involves overcoming s o m e difficulties. For example, the low p r e s s u r e sample is usually in a v e s s e l which cannot be used as a discharge tube; thus the gas must be transferred to such a tube, with all the attendant difficulties of such a procedure.
152 METHODOLOGICAL P R O B L E M S
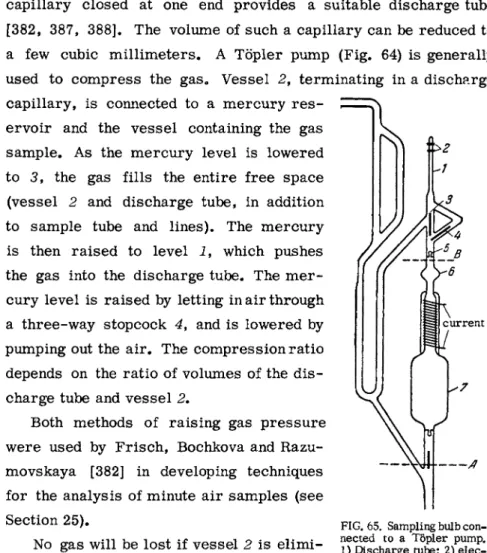
FIG. 64. Töpler pump for gas compression.
High analytical sensitivity requires that the p r e s s u r e in the high-frequency discharge tube be at least 0.1 m m Hg. This p r e s - sure is achieved by either of two methods. In the first the low p r e s s u r e sample is diluted with an inert gas so that the total p r e s s u r e is raised to the required level. Helium is the best diluent, because it tends to increase the electron temperature in the discharge and to improve the excitation conditions for all components of the mixture. The amount of the added helium is precisely controlled and the content of all components in the helium- diluted mixture is determined. It is then possible to back-calculate the concentrations and thus arrive at the composition of the sample prior to dilution. However, addition of an inert gas introduces a new component into the sample, which complicates the analysis.
The second method of mixture analysis involves compressing the gas in the discharge tube until the required pressure is reached.
The shape and size of the tube are selected to fit the specific problem. When the sample is very s m a l l , a quartz or glass
MICROANALYSIS OF GASES 153 capillary closed at one end provides a suitable discharge tube [ 3 8 2 , 3 8 7 , 3 8 8 ] . The volume of such a capillary can be reduced to a few cubic m i l l i m e t e r s . A Töpler pump (Fig. 6 4 ) is generally used to compress the gas. V e s s e l 2 , terminating in a discharge capillary, is connected to a m e r c u r y r e s -
ervoir and the v e s s e l containing the gas sample. A s the m e r c u r y level is lowered to 3, the gas fills the entire free space (vessel 2 and discharge tube, in addition to sample tube and lines). The m e r c u r y is then raised to level i , which pushes the gas into the discharge tube. The m e r - cury level is raised by letting in air through a three-way stopcock 4, and is lowered by pumping out the air. The compression ratio depends on the ratio of volumes of the d i s - charge tube and v e s s e l 2.
Both methods of raising gas p r e s s u r e were used by Frisch, Bochkova and Razu- movskaya [ 3 8 2 ] in developing techniques for the analysis of minute air samples (see Section 2 5 ) .
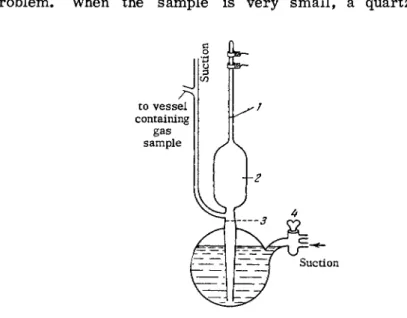
No gas will be lost if vessel 2 is e l i m i - nated and the gas sample tube is connected directly to the discharge tube. One such an
arrangement (see Fig. 6 5 ) was proposed by ? f samje^uib? A ? Ä Mirtov and is based on the break-seal valve tte touom Saitf É e 5 principle* [ 3 8 9 ] . The seals on the gas t a k i n g0u ^ r s?Ii°of
the bulb.
/J
FIG. 65. Sampling bulb con- nected to a Töpler pump.
1) Discharge tube; 2) elec- trodes; 3, 4)metalhammer and removable hammer support for breaking the bulb seal at the top; 5) up-
*See Brauer*s Handbook of Preparative Inorganic Chemistry, Second edition, vol. I, p. 63, Academic Press, New York-London, 1963.
154 METHODOLOGICAL P R O B L E M S
*It is not advisable to measure the pressure prior to analysis since this produces some loss of the sample.
sampling bulb can be broken on either side. All the connecting tubing is evacuated and the mercury column in the Töpler pump is raised to level A . At this the lower seal of the bulb is broken. The mercury is then raised to level Β and the upper seal of the bulb is broken. The entire gas sample is thus pushed into the capillary which serves as the discharge tube. The procedure which follows the transfer of the gas sample to the capillary (that is, the analysis proper) is virtually identical with the conventional analysis of large gas samples.
It is characteristic of spectral analysis of minute gas quantities that in most cases only one sample is available. Thus the standard mixtures and photographic conditions cannot be selected before the spectrum of the unknown mixture has been photographed. It is recommended that the first plate be used for photographing the spectrum of the analyzed mixture alone, under various excitation conditions, so that qualitative analysis can be performed. A second plate is then used to photograph the spectrum of the unknown mixture together with the spectra of the standard mixtures.
Another difficulty in microanalysis is that the p r e s s u r e in the sample bulb is not always known. In this case the gas should be compressed to the limit and an attempt made to fire the discharge.
If this is successful, the photographs are taken and only then is the pressure measured.* Once the p r e s s u r e of the unknown mixture is known, the spectra of the standard mixtures can be photographed at the same p r e s s u r e . If the pressure in the tube is too low and a discharge fails to take place, helium must be added in measured quantities until the pressure is sufficient for a discharge. The helium may be metered by means of a gasometer.
MICROANALYSIS OF GASES 155 When microquantities of gas are analyzed, the vacuum system must be especially clean, and greased vacuum stopcocks should be replaced with m e r c u r y valves [389]·
In general, microanalysis is somewhat less sensitive than the conventional analytical procedure, since it is not always possible to select optimal conditions when only a limited number of gas samples is available. The preliminary operations involved in compression of the gas also contribute to lower sensitivity.
A reasonable accuracy in microanalysis can only be achieved if all operations are performed with the utmost care and in the correct order. Since the gas sample is very s m a l l , the gas adsorption and desorption by the walls of the discharge tube become quite significant. Because of this, the correct time interval between switching on the discharge current and the recording of spectra should be strictly observed. Photoelectric recording considerably improves the accuracy, as does the excitation of the gas mixtures with ultra-high-frequency generators.
Microanalytical procedures for air samples from the upper atmosphere have been described in [382].
Smit and Smit [42] proposed the use of Hanle's electron gun [28] for analyzing trace quantities of monatomic gases (p = ΙΟ"3 - 1 0 "2 m m Hg). In an Hg-He mixture, variations of the m e r c u r y concentration do not affect the intensity of the helium lines. In such a mixture, therefore, the effect of the third component can be eliminated. For best results, single lines with broad excitation peaks should be used, since constant electron velocities are very difficult to maintain in the light source under these conditions. It would appear that only qualitative analysis is possible in this c a s e , since a quantitative measurement would be hampered by the huge bulk of metal of the electron gun, with its attendant absorption and liberation of g a s e s .
Ί56 METHODOLOGICAL P R O B L E M S
20. A N A L Y T I C A L ACCURACY AND SOURCES OF ERROR We will next discuss methods for evaluating measurement e r r o r s . A detailed description of such methods, as adapted to spectral analysis, will be found inpapers [390-394] and monographs [25, 2 0 9 , 315, 3 9 5 ] .
E r r o r s may be systematic and random. Systematic e r r o r s can be traced to some constant factor—usually defects in equipment—
and will tend to distort the results of a series of measurements in a single direction: the measured values will all be either too low or too high. Random e r r o r s , as the usual implies, may cause deviations in either direction, so that the values obtained may be either high or low. Random e r r o r s may be caused by current fluctuations in the discharge tube, a defective photographic plate, and so on.
Systematic e r r o r s can be evaluated only by comparing the r e - sults of spectral analysis with those of other procedures, such as chemical analysis. However, in s o m e types of work, such as the spectral analysis of g a s e s , sucha comparison is not always feasible.
Consider one such case: let us assume that a McLeod gage, used to measure pressure during preparation of the mixture, has been incorrectly calibrated. In that case, identical results from r e - peated measurements will not indicate that the value obtained is accurate. They will merely show that the measurement is r e - producible, i.e., that repeated analysis of the mixture yields the same data. Repeated tests provide the basis for determining the mean concentration C of a component in the mixture, which is taken to represent the true value of the desired quantity (which may possibly be distorted by systematic e r r o r s ) . The e r r o r s of single tests are then defined as deviations from the mean.
The criterion for evaluating a measurement method is not the magnitude of possible e r r o r s but, rather, the frequency of repetition
ANALYTICAL ACCURACY AND SOURCES OF ERROR 157 of e r r o r s of the same magnitude. At a sufficiently large number of measurements, the distribution of the random e r r o r s will be Gaussian (or normal) [396]; that is, the number of measurements with deviation in the range ε*—δε» to ε» + δε» will be given by the equation
where η is the total number of measurements, σ is the root mean square or standard deviation for the given set of measurements, and ε* is the e r r o r (deviation) of a single measurement.
From statistics, the standard deviation a is
where C is the (arithmetic) mean measured value and χ ι is the value yielded by a single measurement (i.e., ε* = C-x<).
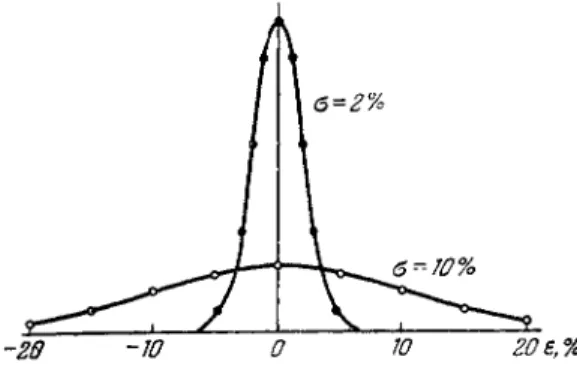
The distribution of e r r o r s for two values of σ [ 3 1 5 ] is shown in Fig. 66. It is seen that at a ο of 2% measurements with e r r o r s e x - ceeding 5% are virtually absent, while at a oof 10% the e r r o r of a single measurement may be as high as 15% or m o r e .
V2K9
(4.17)
(4.18)
2θε,%
FIG. 66. Random distribution of errors.
158 METHODOLOGICAL PROBLEMS
•This value may be termed the coefficient of variation [393],
The standard deviation may also be expressed as a percentage of the value to be determined
σ'=-£-100%.* (4.19) Alternative criteria for assessing the accuracy of a method are
the probable error
Γ = 0.67σ (4.20) and the arithmetic mean error
y - ^ l (4.21)
P Vn(n-\)
For a large number of measurements, the arithmetic mean e r r o r can be expressed in t e r m s of the standard deviation as follows:
Ρ~0.8σ. (4.22) The probable e r r o r r may be simply defined as follows: one half
of the total number of measurements will show deviations not e x - ceeding r.
Any one of above definitions of e r r o r can serve as a criterion of accuracy of an analytical method.
The most frequent criterion of accuracy used so far in spectral analysis is the probable e r r o r [391]. Nalimov [393] believes the standard deviation to be more convenient, since its determination requires only a few measurements; the e r r o r distribution in this case does not have to be normal. Hereafter, we shall evaluate the accuracy of results of spectral analysis of gas mixtures in t e r m s of this criterion.
In order to achieve higher accuracy, a measurement should be repeated several t i m e s . From theory of e r r o r s
A N A L Y T I C A L ACCURACY AND SOURCES OF ERROR
α (4.23)
where η is the number of measurements from which the mean r e - sult is calculated; on is the mean square e r r o r incurred when the result is taken as an average of η measurements; and a is the standard deviation of a single measurement. We see that an can be reduced by a factor of 1.7 if the analysis is performed in triplicate.
In recent years the methods of mathematical statistics have become increasingly popular. Mathematical evaluation of the results can improve the accuracy and sensitivity of analysis [ 3 9 5 , 3 9 7 ] . The method most widely used today is analysis of variance [ 3 9 5 ] , which is based on decomposition of the overall variance into a s e r i e s of components, each of them accounting for a factor of the overall random e r r o r incurred in spectral analysis. Bernshteyn, Nalimov and Fal'kova [392] evaluated the precision and accuracy of spectral procedures used in analysis of geological samples by expanding the overall random e r r o r into the following t e r m s :
1) E r r o r s of reproducibility cr caused by uncontrolled factors which vary rapidly with time;
2) e r r o r ot due to uncontrolled factors which vary slowly with time (e.g., calibration curve shifts, variations in the slit width);
it is assumed that when the tests are repeated, they are made on different days;
3) e r r o r as resulting from changes in the composition of the standard mixtures.
Bernshteyn et al. determined the overall e r r o r from the equation
If η tests are performed on the same day, the overall root- mean-square deviation will be
(4.24)
(4.25)
160 METHODOLOGICAL PROBLEMS
which implies that only the e r r o r in reproducibility, oT, is reduced by carrying out repeated tests during a single day.
In evaluating the extent to which the various component t e r m s contributed to the total e r r o r , Bernshteyn et al. concluded that the e r r o r s in reproducibility cr were less significant than the other two types of e r r o r ( ct andos ) . This indicated that checking the accuracy of analysis by repeated photography of spectra obtained for the same mixture was of little value if the photographs were all taken on the same day. Nor can the accuracy be appreciably improved by averaging the results of several successive tests.
Let us now discuss the e r r o r s involved in the photographic methods of spectral analysis [ 2 5 , 3 1 5 ] . H e r e , there are three sources of e r r o r s : 1) e r r o r s of photometry; 2) e r r o r s caused by changes in the discharge conditions; 3) e r r o r s caused by lack of uniformity in the emulsion or by differences in development.
Analysis of gas mixtures involves one further error—that due to absorption (or evolution) of gases on the walls of the tube (the history of the discharge tube).
A detailed study [390] revealed that photometry e r r o r s are minor and become negligible, in comparison with the other kinds of deviation, when the test is repeated. E r r o r s relating to the photographic plate itself are generally quite significant: even with high-grade plates and with strict observance of all instructions relating to photographic development they appear to reach 1.5-2%.
When regular (as opposed to high-grade) photographic materials are used, it is not possible to reduce these e r r o r s to below 3%.
E r r o r s associated with changes in the excitation conditions can be reduced by appropriate selection of analytical pairs (see Section 17). Irrespective of the excitation technique employed, the major discharge parameter, that i s , current, must be kept constant.
Voltage stabilizers in the line are thus desirable.