Photochemistry and Photobiology, 20**, **: *–*
Age-Related Absorption of the Human Lens in the Near-Ultraviolet Range
Viktor Pajer1† , Ferenc Rarosi2, Lajos Kolozsvari3, Bela Hopp1and Antal Nogradi*4
1Department of Optics and Quantum Electronics, Faculty of Science and Informatics, University of Szeged, Szeged, Hungary
2Department of Medical Physics and Informatics, Faculty of Medicine, University of Szeged, Szeged, Hungary
3Department of Ophthalmology, Faculty of Medicine, Albert Szent-Gy€orgyi Clinical Centre, University of Szeged, Szeged, Hungary
4Department of Anatomy, Faculty of Medicine, University of Szeged, Szeged, Hungary Received 22 May 2019, accepted 19 November 2019, DOI: 10.1111/php.13199
ABSTRACT
The purpose of the present study was to determine the age dependence of the ultraviolet (UV) absorption of the different parts of the human crystalline lens. Cryostat sections of human cadaveric lenses (60 lm) were cut. The UV absorbance of nine samples, derived from different parts of the lens, was deter- mined using a Shimadzu scanning spectrophotometer. The absorbance of the anterior and posterior lens capsules was mea- sured separately. The absorption coefficients were calculated from the measured absorbance and values taken at 280 as well as at 360 nm were compared statistically. ANCOVA analysis of the values taken at 280 and at 360 nm wavelengths shows that correlation between the absorption coefficients and age can be found only in the case of the posterior layers. These results sug- gest a differential age-dependent increase of the UV absorption of the posterior layers compared to the anterior ones and can be related to the differential protein expression in the anterior and posterior parts. Posterior crystalline lens capsules have higher absorption coefficients than the anterior ones regardless of age.
INTRODUCTION
The human lens has an effective capacity to absorb UV radiation (1–3) and along with the other parts of the eye, plays an impor- tant role in preventing the retina from ocular light damage. Sev- eral studies have provided evidence that higher UV exposure, as well as the age, increase the prevalence of certain eye diseases (4–7), especially that of different types of cataract (8–13). The age dependence of light absorption by the human crystalline lens has been the center of interest for a long time. Weale (1) found a systematic age-dependent increase in the absorbance both in the visible light and near-UV range. In accordance with this, trans- mission spectra of human lenses (3,14) of different ages show that the older lenses transmit less amount of light of wavelengths longer than 300 nm. Since the lens grows continuously, higher absorption can be caused by the longer light path, but
physiological yellowing of the older lens can also contribute to the increased absorbance (15).
It is known that the various parts of the lens absorb UV light differentially, that is, absorbance increases in anteroposterior direction (2,16,17). On the other hand, studies on age-related changes do not provide an explanation how this absorption gra- dient varies with age. Moreover, very little is known about the absorption capacity of the lens capsules and their age-related changes (18).
Therefore, the aim of the present study was to determine the age dependence of the UV absorption of the different parts of the human crystalline lens.
MATERIALS AND METHODS
Cryostat sectioning.A total of 38 human lenses, from the age of 7 to 81 years, were used for measuring the age-related changes of the UV absorbance of the human lens. The human lenses were used with the approval of the Human Ethics Committee of University of Szeged, Albert Szent-Gy€orgyi Clinical Centre and the study was conducted in accordance with the provisions of Declaration of Helsinki for experimentation involving human tissue. Lenses were obtained with a postmortem delay of 6 h and were stored at70°C until used.
Only those lenses which showed no cataract formation upon post- mortem examinations were used for measurements. To determine the absorption of the various parts of the lens, the same procedure was used as reported in our earlier paper (17). Briefly, 60-µm thick consecutive sections were cut in a cryostat (Leica 1850 CM) at18°C. Before sec- tioning, the anterior and posterior lens capsules were removed and stored in physiological saline separately. During this process, some of the cap- sules were damaged and could not be used for measurements, thus alto- gether 19 anterior and 27 posterior capsules were examined. During cryostat sectioning a total of nine sections were kept for measurements in an anteroposterior order: two samples from the anterior cortex (sample 1 and 2),five samples from the nucleus (samples 3–7) and two samples from the posterior cortex (samples 8 and 9), for further details see Fig. 1 and our earlier work (17).
As a result of the sectioning method, samples 4–7 always derived from the juvenile nucleus (19–21), thus the age-related changes of the sections taken from the nucleus are comparable, despite the fact that the thickness of the full lens increases with age.
Following UV measurements, cryostat cross sections were cut from the anterior and posterior capsules to determine the thickness of the cap- sules. Thickness of the anterior capsules varied from 21 to 26lm, whereas that of the posterior ones were relatively constant in the range of 8 and 11lm.
Spectrophotometric measurements. The dependence of the UV absorbance of the samples as function of wavelength was measured by a scanning spectrophotometer (model UV-2101PC UV- VIS; Shimadzu,
*Corresponding author email: nogradi.antal@med.u-szeged.hu (Antal Nogradi)
†Current address: ELI-ALPS, Szeged, Hungary
©2019 The Authors.Photochemistry and Photobiologypublished by Wiley Peri- odicals, Inc. on behalf of American Society for Photobiology
This is an open access article under the terms of the Creative Commons Attribution License, which permits use, distribution and reproduction in any medium, provided the original work is properly cited.
1
Kyoto, Japan) at room temperature. The absorbances and the absorption coefficients of the samples were determined as reported in our earlier work (17). The round 2 mm beam used for spectrophotometric measurements made it possible to measure only the central regions of the samples (Fig. 1). The investigated wavelength range was 240–400 nm, as in the range below 240 nm, the absorbance values often approached or reached the upper limit of the device.
Statistical analysis. Descriptive statistics were calculated for each layer separately. Continuous variables were expressed as meanSD.
The tendency between age and absorption coefficients at 280 nm as well as at 360 nm was characterized with Pearson correlation coefficients and significance tests for correlation for each layer separately. Analysis of covariance (ANCOVA) model with factor layer and covariate age was used for further statistical analysis. AP-value<0.05 was considered to be statistically significant. The calculations were computed through the use of IBM SPSS version 24.
RESULTS
Absorption spectrum of lens sections
The UV absorption of the lenses was examined in seven differ- ent age groups: 7–19 (n=3), 20–29 (n=3), 30–39 (n=6), 40–
49 (n=10), 50–59 (n=9), 60–69 (n=4) and 70–81 (n=3) years. There was only one lens younger than 10 years old avail- able so the age range of thefirst group was extended to include this sample. Due to the lack of samples, a similar expansion of the 70–81 years age group was performed. For statistical analy- sis, the age was considered as a continuous value and no age groups were formed. Figure 2 shows the averaged absorption coefficients of the nine sample layers as function of wavelength in three different age groups. The absorption spectrum slightly increases toward the shorter wavelengths and has a maximum at the wavelength of 280 nm. It can be seen that value of the maxi- mum absorption increases in the anteroposterior direction, except in the case of the youngest group (7–19 years), in which the
increasing tendency is not explicit and the samples 4–7 have almost equal absorption capacity.
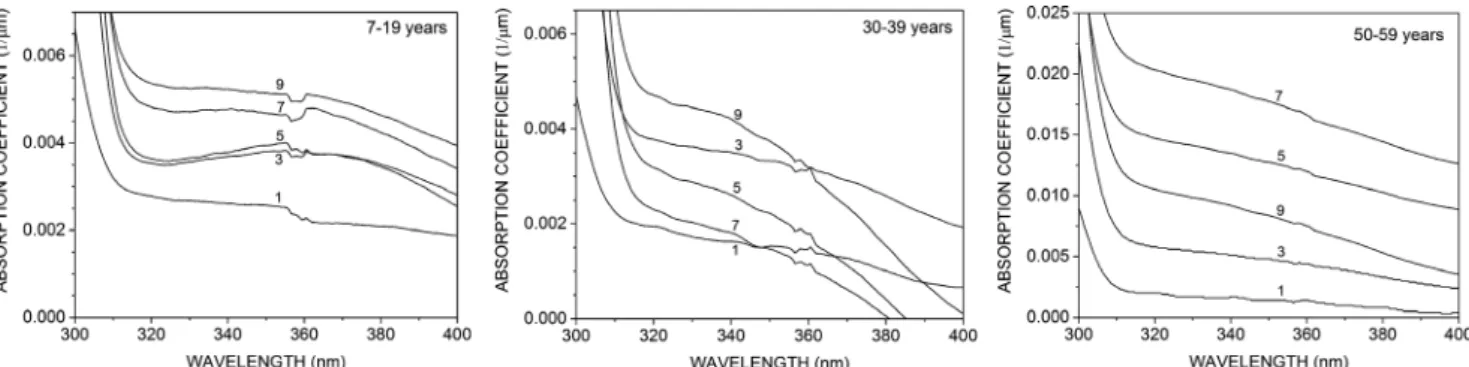
The reported absorbance spectra of the human lens show another absorption peak around 360 nm (1,2,22). Figure 3 pre- sents the averaged absorption coefficients of three age groups in the 300–400 nm wavelength range. For clarity, data related to Samples 1, 3, 5, 7 and 9 only are shown. The posterior layers have higher absorption capacity, but the increasing tendency is not as explicit as in the case of the peak at 280 nm. It is also noticeable that only the spectra of the youngest lenses show a small peak around 360 nm meanwhile the absorption is slightly decreased at 320 nm. As the detection limit of the spectropho- tometer was calibrated in a way to measure the peak at 280 nm, the absorbance in the UV-A range presumably could have been detected with lower precision. Therefore, the fine absorption changes are visualized to a lesser extent compared with the pre- viously published results.
Age-dependent changes of absorption
Although UV radiation at wavelengths shorter than 300 nm is presumably absorbed by the cornea, the 280-nm wavelength, where the absorption spectrum has a maximum, offers a plausi- ble way to visualize accurately the age-related changes of the UV absorption of the lens. On the other hand, as the cornea is not able to fully absorb the UV radiation longer than 320 nm, it is physiologically also relevant to investigate the age-related changes in the UV-A range. The averaged absorption coefficients at 280 nm as well as at 360 nm of the anterior and posterior cor- tex and that of the nucleus were calculated in the following way:
average of the values of samples 1 and 2 provided the absorption coefficient of the anterior cortex that of the nucleus was calcu- lated from the data of layers 3–7, and the average of the spectra Figure 1. Schematic view of sections’position inside the lens (left) and the calculated position from the lens center (right). Different regions of an aged nucleus are indicated (j.n.: juvenile nucleus, a.n.: adult nucleus) based on literature data.
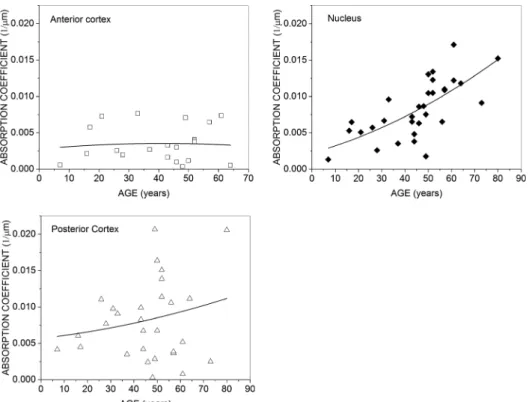
of samples 8 and 9 resulted in the absorption spectra of the pos- terior cortex. These calculations were performed on every single lenses. The averaged values of the absorption coefficient at 280 nm as function of age are shown in Fig. 4. The second order polynomial fit clearly shows that the age-related changes of the posterior cortex are the most pronounced compared to the other two parts. The absorption increases until the age of 60 where it reaches a plateau and slightly decreases after the age of 70.
Averaged absorption coefficients taken at 360 nm are pre- sented in Fig. 5. Both the nucleus and posterior cortex show
increasing absorption capacity with age but changes of the nucleus are the most noticeable.
To determine exactly how the age affects the absorption prop- erties of the different layers and whether this effect is significant, statistical analysis was performed. Values of the absorption coef- ficients taken at 280 nm of the nine sample layers of every sin- gle lens were collected. The ANCOVA model revealed a borderline significant interaction between age and layer (P=0.057). This result is significant at 10% level, with respect to the moderate sample size, this suggests that the effect of age depends on the layer. Changes of coefficient values as function of age were examined for each layer. Table 1 shows the correla- tion coefficients between age and the absorption coefficients at 280 nm and the results of significance tests for each layer. It can be seen that the correlation was significant in layers 6 (R=0.371, P=0.022), 7 (R=0.49, P=0.002) and 9 (R=0.363,P=0.041).
Figure 6 shows the values of the absorption coefficients taken at 280 nm of samples 6, 7 and 9 as function of age. Indeed, these results demonstrate a weak, but significantly increasing ten- dency of absorption.
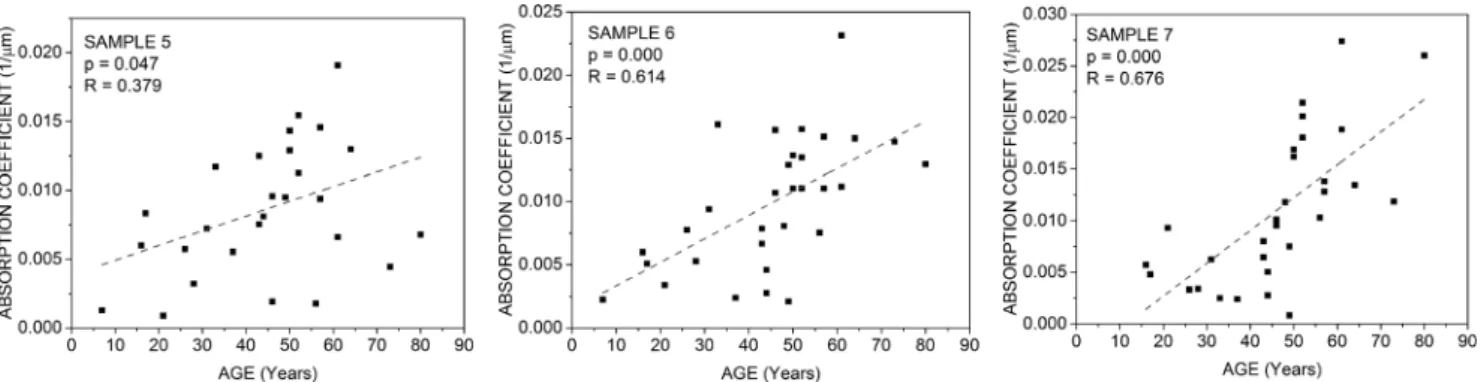
In the case of absorption coefficients taken at 360 nm, the ANCOVA statistical model revealed a significant interaction between age and layer (P<0.01), showing that the effect of age depends on the layer position in the UV-A range. Table 2 dis- plays the correlation coefficient values between age and the absorption coefficient. The correlation proved to be significant in layers 5 (R=0.379,P=0.047), 6 (R=0.614,P=0.000) and 7 (R=0.676, P=0.000). In Fig. 7, the absorption coefficients taken at 360 nm of samples 5, 6 and 7 as function of age are presented. Indeed, the values show the increased absorption capacity of the nuclear region of the aged lenses.
Figure 2. Averaged absorption coefficients of the nine sample layers as function of wavelength in three different age groups.
Figure 3. Averaged absorption coefficients offive sample layers as function of wavelength in three different age groups, in the 300 to 400 nm range.
Figure 4. Averaged values of absorption coefficients taken at 280 nm as function of age. Solid lines show the second order polynomialfit. Age- related changes of the posterior cortex are the most noticeable.
Photochemistry and Photobiology 3
Figure 5. Averaged values of absorption coefficients taken at 360 nm as function of age. Solid lines show the second order polynomialfit. Age-related changes of the nucleus are the most pronounced.
Table 1.TestP-values of the ANOVA analysis related to the absorption coefficients taken at 280 nm.
Sample layers 1 2 3 4 5 6 7 8 9
R 0.056 0.16 0.158 0.136 0.215 0.371 0.49 0.096 0.363
P-values 0.737 0.337 0.343 0.414 0.207 0.022 0.002 0.582 0.041
Values<0.05 were considered to be statistically significant (bold-faced values).
Figure 6. Absorption coefficients at 280 nm of the three age-dependent sample layers are shown as function of age. SignificantR andP-values are indicated.
Table 2.TestP-values of the ANOVA analysis related to the absorption coefficients taken at 360 nm.
Sample layers 1 2 3 4 5 6 7 8 9
R 0.16 0.32 0.129 0.337 0.379 0.614 0.676 0.195 0.261
P-values 0.480 0.165 0.547 0.079 0.047 0.000 0.000 0.311 0.266
Values<0.05 were considered to be statistically significant (bold-faced values).
Absorption of the lens capsules
Owing to the small number of the samples, the averaged absorp- tion coefficients of the lens capsules were calculated only infive different age groups: 7–19 years, 20–39 years, 40–49 years, 50– 59 years and above the age of 60. Again, for statistical analysis, the age was considered as a continuous value and no age groups were formed. Regardless of age, we found that the posterior cap- sules show higher absorption than the anterior ones (Fig. 8) but further statistical analysis (ANCOVA) showed that this differ- ence is not significant (P=0.198). The age showed no signifi- cant effect on absorption coefficients at 280 nm (P=0.18).
DISCUSSION
We examined the age-related UV absorption changes of the vari- ous parts of the human lens in an expanded age range (7–
81 years), and it was found that there is an age-independent absorption gradient in the anteroposterior direction inside the lens. Only the youngest lenses showed slightly different tendency in the UV-C range which can be explained by the remodeling of the lens in this age (20) when the aspect ratio significantly changes and the primary fiber cell shortening happens. The results of the statistical analysis showed a significant correlation between the absorption coefficient taken at 280 nm and the age
only in the case of the posterior layers 6 (R=0.371,P=0.022), 7 (R=0.49, P=0.002) and 9 (R=0.363, P=0.041). At 360 nm, significant correlation was found between age and absorption of nuclear layers 5 (R=0.379, P=0.047), 6 (R=0.614,P=0.000) and 7 (R=0.676,P=0.000). The ante- rior capsules have lower absorption coefficients than the posterior ones in each age groups; however, this difference is not signifi- cant and no age-related changes were found in these cases. This indicates that the age has no effect on the absorption properties of the lens capsules.
Most studies treat the cortex as a whole, since the anterior and posterior sides consist of the same elongated fibers. How- ever, several results suggest that there is a difference in protein expression levels along the visual axis. Spectroscopically obtained Carr-Purcell-Meiboom-Gill data suggest spatial and age-dependent variations in crystallin content (23). Water content in the posterior pole is lower than in the anterior pole (24), indi- cating higher protein concentration in the posterior part. Levels of alpha-crystallin A and beta-crystallin B1 chains are higher in the posterior layers of the lens (17). The concentration of alpha- crystallin also increases with age at the expense of beta- and gamma-crystallins (25). These findings suggest that the age-re- lated changes of the absorption at 280 nm are strongly related to the age-dependent protein expression levels. The water soluble protein fraction decreases after middle age, resulting in decreased Figure 7. Absorption coefficients at 360 nm of the three age-dependent sample layers are shown as function of age. SignificantRand P-values are indicated.
Figure 8. Averaged absorption coefficients of the capsules as function of wavelength. The curves are related to the indicated age groups.
Photochemistry and Photobiology 5
These age-dependent changes of 3OHKG are in agreement with the enhanced absorption of the lenses older than 50 years (Figs. 5 and 6) and can explain the significant correlation.
The age-related results found in the literature are taken from the entire lens or lens homogenates, except the study of Gaillard et al.(2). To determine the UV transmission of the whole lens, the averaged cumulative absorbance was calculated in each age groups. The absorption values of the discarded segments were considered to be equal to the absorbance values of the samples taken in front of the unused sections. The measured absorbance resulted from the absorption and scattering processes together.
Although the samples were placed between quartz plates in a drop of isotonic saline, the amount of light scattering through the lens sections is presumably still higher than in the case of the measurements related to the whole lens. When the cumulative absorbance is calculated, the effect of a relatively small differ- ence in the scattering process can be highly enhanced due to the large number of lens sections (n=60–70 with 60lm thickness).
In order to take into account this process, 2% of the incoming radiation was considered as scattered light in each step and the absorbance was reduced according to this. Then the transmission was calculated using the following formula:
T¼10010ðAbscÞ
where T is the percent transmission and Absc is the corrected cumulative absorbance.
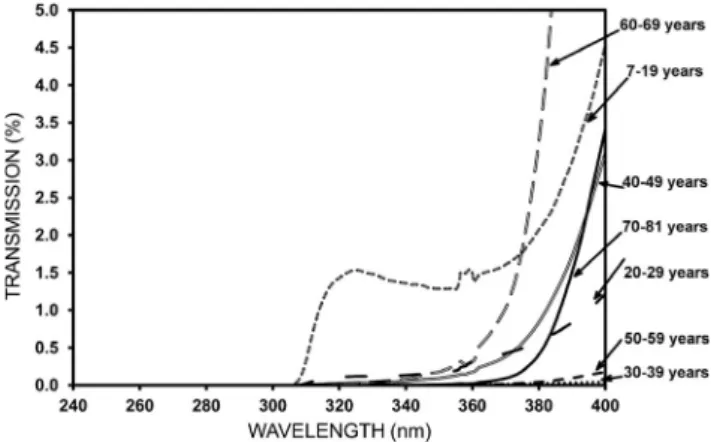
Figure 9 shows the transmission of the whole lens without the capsules in the case of seven different age groups. It can be seen that the youngest lenses transmits about 2% of the incoming light above 310 nm, while the older lenses allow very little trans- mission (approximately 0.1%) in the near-UV range. These absorption changes in the UV-B range is presumably caused by the age-dependent concentration of UV-filter molecules (27,28) and are in agreement with the data found in the literature (3,29,30). It can be also noticed that transmission of the lenses in the 7–19 years old age group shows afine peak at wavelength of 320 nm. This corresponds to the local minimum in the absor- bance spectrum of young lenses (1 and 2). The transmission of lenses with different age shows similar features (30). Both Gail- lardet al. (2) and Cooper and Robson (22) found that the peak at 360 nm shifts toward the shorter wavelengths with age and the minimum vanishes which can explain the above phenomena.
transmission of the lens is always increased around 320 nm, independently of age. This discrepancy could be due to either the different measurement techniques (absorbance of lens sec- tions compared to the transmission of the whole lens) or the detection limit of the spectrophotometer which was calibrated to the 280 nm peak value.
The averaged transmission curves are in good agreement with the data found in literature (3,30). On the other hand, the mea- sured transmission of individual lenses shows high variability.
These differences shall be reflected by the absorbance of the lens sections too. Both in the 7–19 and 50–59 years age groups, the layers derived from individual lenses with the same age have sig- nificantly different absorption capacities (see Figure S2). Stan- dard deviation (SD) values of absorption coefficients taken at 280 nm as well as at 360 nm also confirm that the variability is relatively high within the groups, especially that of the anterior layers at the longer wavelength. The SD values together with the means are presented in Tables S1 and S2.
Averaged transmission of lens capsules was calculated as well but no compensation was made for light scattering. In Fig. 10, it can be seen that below 300 nm, the anterior and posterior cap- sules absorb approximately 30–40% and 20% of the incident UV
Figure 9. Calculated transmission of the full lens as function of the wavelength. Note the increased transmission of very young lenses at wavelength above 310nm. The older lenses possess very low capacity to transmit near UV light.
Table 3.TestP-values of the ANOVA analysis related to the absorption coefficients taken at 320 nm.
Sample 1 2 3 4 5 6 7 8 9
R 0.092 0.042 0.033 0.422 0.044 0.720 0.706 0.247 0.119
P-value 0.692 0.853 0.091 0.020 0.018 0.000 0.000 0.197 0.586
Values<0.05 were considered to be statistically significant (bold-faced values).
light, respectively. Older anterior capsules are able to transmit less light, presumably due to their increased thickness (31).
As the lens grows continuously, it is evident that the absor- bance of the whole lens becomes higher with age. On the other hand, here, we demonstrated the age-dependent changes of the absorption coefficient which is a more characteristic parameter.
The statistical analysis showed that the age affects significantly the absorption properties of the posterior layers while the changes of the anterior ones are less notable. Previously, it was found that the greater UV absorption in the posterior cortex is accompanied by higher levels of Alpha-crystallin A and Beta- crystallin B1 chains (17) and alpha-crystallin was suggested to responsible for the greater UV absorbance in the posterior layers.
As alpha-crystallin is a major target for UV irradiation due to its higher protein unfolding and as the unfolding increases with age (32), alpha-crystallin may play an important role in the signifi- cant correlation between absorption and age in the case of poste- rior lens sections. At longer wavelengths, only posterior nuclear layers showed age-dependent changes. These are presumably associated with the increased level of the bound UV-filters in the old nucleus.
These results suggest that the absorbance of the old lens is higher not only due to its greater thickness but also the increased absorption capacity of the posterior layers. Although the capsules show no age-related changes, the thicker anterior capsule also increases the total absorbance of the aging lens. These findings could help better understand the process of the age-related or UV-induced cataract formation. Data related to the absorption of lens capsules could be also important in cataract surgery and add considerable information to the design of intraocular lenses.
Acknowledgements—This study was supported by the European Union and the State of Hungary, cofinanced by the European Social Fund within the framework of EFOP-3.6.1-16-2016-00008.
SUPPORTING INFORMATION
Additional supporting information may be found online in the Supporting Information section at the end of the article:
Figure S1. Absorption coefficient of lens sections derived from a young (16 years old) and from an older lens (52 years old) in the UV-A and -B ranges. The absorption spectrum of the young lens presents a local minimum at 320 nm (left).
Figure S2.Absorption coefficients of individual lens sections.
Note the high variability of the spectra of lenses with the same age.
Table S1.Standard deviation of absorption coefficients taken at 280 nm together with mean values in three age groups.
Table S2.Standard deviation of absorption coefficients taken at 360 nm together with mean values in three age groups.
REFERENCES
1. Weale, R. A. (1988) Age and the transmittance of the human crys- talline lens.J. Physiol.395, 577–587.
2. Gaillard, E. R., L. Zheng, J. C. Merriam and J. Dillon (2000) Age- related changes in the absorption characteristics of the primate lens.
Invest. Ophthalmol. Vis. Sci.41, 1454–1459.
3. Artigas, M. A., A. Felipe, A. Navea, A. Fandino and C. Artigas (2012) Spectral transmission of the human crystalline lens in adult and elderly persons: Color and total transmission of visible light.
Invest. Ophthalmol. Vis. Sci.53, 4076–4084.
4. Zigman, S., T. Paxhia, T. McDaniel, M. F. Lou and N. T. Yu (1991) Effect of chronic near-ultraviolet radiation on the gray squirrel lens in vivo.Invest. Ophthalmol. Vis. Sci.32, 1723–1732.
5. Zigman, S. (1993) Ocular light damage.Photochem. Photobiol.57, 1060–1068.
6. Merriam, J. C. (1996) The concentration of light in the human lens.
Trans. Am. Ophthalmol Soc.94, 803–918.
7. Varma, S. D., S. Kovtun and K. R. Hegde (2011) Role of UV irradi- ation and oxidative stress in cataract formation. Medical prevention by nutritional antioxidants and metabolic agonists. Eye. Contact.
Lens.37, 233–245.
8. Hollows, F. and D. Moran (1981) Cataract–the ultraviolet risk fac- tor.Lancet2, 1249–1250.
9. Bochow, T. W., S. K. West, A. Azar, B. Munoz, A. Sommer and H.
R. Taylor (1989) Ultraviolet light exposure and risk of posterior sub- capsular cataracts.Arch. Ophthalmol.107, 369–372.
10. Cruickshanks, K. J., B. E. Klein and R. Klein (1992) Ultraviolet light exposure and lens opacities: The beaver dam eye study.Am. J.
Public. Health.82, 1658–1662.
11. Dolin, P. J. (1994) Ultraviolet radiation and cataract: a review of the epidemiological evidence.Br. J. Ophthalmol.78, 478–482.
12. Klein, B. E. K., R. Klein and K. E. Lee (1998) Incidence of age-re- lated cataract.Arch. Ophthlamol.116, 219–225.
13. AREDS Research Group (2001) Risk factors associated with age-re- lated nuclear and cortical cataract.Ophthalmology108, 1400–1408.
14. Boettner, E. A. and J. M. Wolter (1962) Transmission of the ocular media.Invest. Ophthalmol. Vis. Sci.1, 776–783.
15. Mellerio, J. (1987) Yellowing of the human lens: Nuclear and corti- cal contributions.Vision. Res.27, 1581–1587.
Figure 10. Calculated transmission of the lens capsules in four age groups. Number of available samples in the related group are indicated in brackets.
Photochemistry and Photobiology 7
20. Augusteyn, R. C. (2010) On the growth and internal structure of the human lens.Exp. Eye. Res.90, 643–654.
21. Rosen, A. M., D. B. Denham, V. Fernandez, D. Borja, A. Ho, F.
Manns, J. P. Parel and R. C. Augusteyn (2006) In vitro curvatures and dimensions of human lenses.Vision. Res.46, 1002–1009.
22. Cooper, G. F. and J. G. Robson (1969) The yellow colour of the lens of men and other primates.J. Physiol.203, 411–417.
23. Moffat, B. A. and J. M. Pope (2002) The interpolation of multi-ex- ponential water proton transverse relaxation in the human and por- cine eye lens.Magn. Reson. Imaging.20, 83–89.
24. Siebinga, I., G. F. J. M. Vrensen, F. F. M. De Mul and J. Greve (1990) Age-related changes in local water protein content of human eye lenses measured by Raman microspectroscopy. Exp. Eye. Res.
53, 233–239.
lenses.Invest. Ophthalmol. Vis. Sci.48, 1718–1723.
29. Lerman, S. (1987) Chemical and physical properties of the normal and aging lens: spectroscopic (UV, fluorescence, phosphorescence, and NMR) analyses.Am. J. Optom. Phys. Opt.64, 11–22.
30. Ambach, W., M. Blumthaler, T. Sch€opf, E. Ambach, F. Katzgraber, F. Daxecker and A. Daxer (1994) Spectral transmission of the opti- cal media of the human eye with respect to keratitis and cataract for- mation.Doc. Ophthalmol.88, 165–173.
31. Krag, S. and T. T. Andreassen (2003) Mechanical properties of the human posterior lens capsule.Invest. Ophthalmol. Vis. Sci.44, 691– 696.
32. Liang, J. N., S. K. Bose and B. Chakrabarti (1985) Age-related changes in protein conformation in bovine lens crystallins.Exp. Eye.
Res.40, 461–469.