DFT Study of Structure, IR and RAMAN Spectra for Betulinic Acid Solvatomorphs
IMIRELA NICOLOV1#, DOINA GEORGESCU1#, EMILIANA LAURA ANDREICI EFTIMIE2*, SIMONA CINTA PINZARU3, ROXANA ROMAN2, IONUT LEDETI1,,RITA AMBRUS4, ADELINA CHEVERESAN2*, NICOLAE M. AVRAM1,5
1Victor Babes University of Medicine and Pharmacy, Faculty of Pharmacy, 2 Sq. E. Murgu , 300041, Timisoara, Romania
2 West University of Timisoara, Faculty of Physics, 4 V. Parvan Str., 300223, Timisoara, Romania
3Babes-Bolyai University, Biomolecular Physics Dept., 1 Kogalniceanu Str., 400084 Cluj-Napoca, Romania
4 University of Szeged, Institute of Pharmaceutical Technology and Regulatory Affairs, Szeged H-6720, Eotvos u. 6, Hungary
5Academy of Romanian Scientists, 54 Independentei Str., 050094, Bucharest, Romania
Combined experimental and theoretical studies on molecular structure of the betulinic acid solvatomorph of ethanol, 2-butanol and isopropyl alcohol solvents, grown by recrystallization method, are reported.
Theoretical investigations, in the frame of DFT, are done using the new method of the betulinic acid solvatomorph molecule extraction from the corresponding molecular crystal, based on typical fragmentation scheme and chemical connectivity. For all electrons, a localized basis set of Gaussian type functions TZVP and local gradient corrected functional BP86 were used. Good correlation was found between the calculated and experimental data. Slight differences in the lattice modes spectral range (0-200 cm-1) from experimental Raman spectra suggest slight differences in the crystalline network and highlight the powerful Raman approach in evidencing BA pseudo-polymorphs or solvatomorphs. Data obtained suggest that incorporated solvents to the solvates generaly induced changes in crystal symmetry, intermolecular arrangements, stoichiometry and hydrogen bonding interactions of the analysed solvatomorphs.
Keywords: betulinic acid solvatomorphs, harmonic vibrational modes, FT-IR, FT-Raman, DFT vibrational calculation.
Betulinic acid [systematic name: 3β-hydrozy-lup- 20(29)-en-28-oic acid, C30H48O3] (BA) is a natural pentacyclic lupane type triterpenoid present in many plant species, like Triphyophyllum peltatum, Ancistrocladus heyneanus, Ziziphi fructus, etc. [1]. BA is a natural product obtained from barks or core extraction of some plant species mainly from Betula pubescenes or by synthetic processes using the betulin (alcohol triterpene) as a synthetic intermediate or by biological fermentation with betulin [2,3].
As exhaustively reviewed [4, 5] on BA and its derivatives possess important biological properties and activities such as anti-cancer [6],anti-malarial [7], anti-HIV [8], anti- bacterial [9] and antioxidant [10]. The important morphological modiûcations of the BA take place during crystallization via different organic solvents [11]. The role of solvent molecules is essential to form crystal and stabilize crystal lattices by fostering hydrogen bonds. Also, the solvents change the crystal symmetry of solvated crystal, hydrogen-bonding, intermolecular interactions, and stoichiometry. There are a lot of solvatomorphism forms of BA reported in the literature [12,13]. Betulinic acid dimetyl sulfoxide solvate (BA-DMSO), with the orthorhombic P212121 space group, was ûrst reported by Boryczka et al. [12]. Wang et al. [13], proves the existence of five more crystalline forms of BA solvatomorphs with sulfoxide (BA-DMSO), methanol (BA-MeOH), ethanol (BA- EtOH), isopropyl alcohol (BA-IPA) and 2-butanol (BA-2BUT) respectively. During last years, the combining experimental and theoretical methods of infrared and Raman spectroscopy have been used, as very efficient and non- destructive analytical approach for understanding complex molecular structures or transition metal complexes [14]
and correct interpretation of their experimental data. Based
on such approach, reliable characterization of BA and its derivatives has been reported [15-20].
Our previous study [15] has presented new results on BA solvatomorph of methanol (BA-MeOH) grown, normal modes characterization and calculation of vibrational wavenumbers and their vibrational assignment.
In this paper, we provide a deeper insight, compared with the reports of Wang et al (2014) [13], into the recrystallization grown (another experimental method for obtaining the crystals), molecular structure of BA-EtOH, BA- IPA, BA-2BUT solvatomorphs along the pure BA and complete theoretical and experimental study of their vibrational FT-IR and FT-Raman spectra.
Experimental part
In each experiment BA was dissolved in the solvent (≈1- 3 mL) close to the boiling temperature of each solvent and the mixture was stirred until BA was completely dissolved. The mixture was cooled down slowly to room temperature and the crystals were obtained within few days.
BA and the solvents (ethanol, isopropyl alcohol and 2 butanol) analytical pure were acquired from Merck and Sigma Aldrich (Germany), respectively. The details of recrystallization grown and characterization of betulinic acid solvatomorph crystals are given in [15] and [21].
FT-IR spectra were recorded in mid-infrared 4000-400 cm-1 spectral range with a resolution of 2 cm-1 using a JASCO 670+ after KBr pelleting.
FT-Raman spectra of the powdered solid, polycrystalline solvatomorphs have been recorded with a Bruker Equinox 55 FT-IR spectrometer with an integrated FRA106S Raman module. Detection was accomplished with a Ge detector operating at the liquid nitrogen temperature. A Nd: YAG
* email: andreicilaura@yahoo.com; adedent73@gmail.com # Authors with equal contribution
laser emitting the 1064 nm line was used for excitation.
The output power was set to 350 mW and 500 scans were co-added. Data acquisition and processing was achieved with the OPUS 2.0 and Origin 6.1 software respectively.
Computational methods
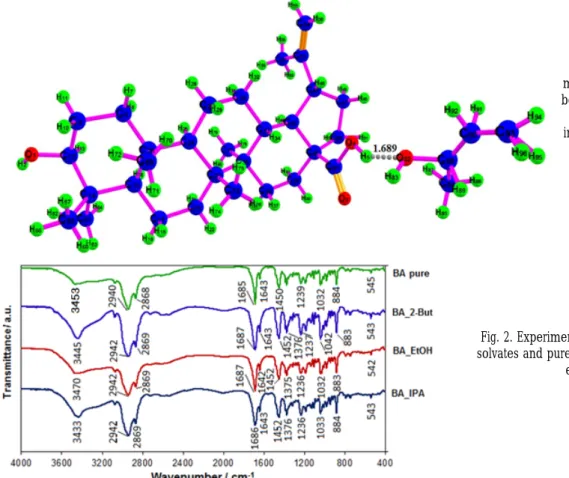
The analysis of solvatomorphs are consistent with the crystallography structure with the space group P22121 (number 18 in International Tables for Crystallography [22]) for BA-2BUT and P212121 (number 19 in International Tables for Crystallography [22]) for BA-IPA and BA-EtOH, with four molecules in the unit cell, confirming the results of Wang et al. [13], regarding the crystals symmetries. In all cases, the host molecule BA (solvates) interacts with the included solvents, making them essential components of the host lattices. Therefore, the solvent molecules in all solvates belong as integral part of the corresponding crystal’s unit cell, with a certain stoichiometric ratio to host molecules, bonded to the crystal lattice by hydrogen bonding, which improve the stability of the corresponding lattice. For each molecular crystal studied, the geometric structures of the corresponding molecules have been obtained according to the method presented in [15] and then the conformational analysis had been done. Figure 1 presents the geometry of the BA-2BUT molecule (for sake of brevity the conformational analysis for the other molecules is not given here).
The structure of the BA-2BUT molecule confirms five membered –rings with 10 chiral centers and solvent bonded on the mother structure of BA by a hydrogen bond of 1.689 Å between H5 and O82. In the case BA-IPA and BA-EtOH the hydrogen bonding correspond to a distance of 1.709 Å between H1 and O4, respectively 1.893 Å between H49 and O1 for BA-EtOH.
The method of extraction solvatomorph BA molecule from the corresponding molecular crystal [15], has been applied.
In the frame of this method the BA-2BUT, BA-IPA, BA and BA-EtOH molecules are extracted from corresponding
molecular crystal based on typical fragmentation scheme that treat each individual molecule as a distinct, non- overlapping fragment, taken into account chemical connectivity defined by the sum of the covalent radii.
From space group of each molecular cr ystal we extracted the geometry of corresponding molecule within the MO-LCAO framework using CRYSTAL 14 code [23]. All computations have been done using for all electrons a localized basis set of Gaussian type functions Triple-zeta valence TZVP with quality for solid state calculations [24]
and BP86 hybrid functional [25,26]. Once the geometry of the molecules is obtained they should be optimizing in order to obtain more precisely wavenumbers values. This was made with the ORCA 3.0.3. Software [27, 28] using Ahlrichs-TZVP basis set [29], auxiliary bases sets def2/JK [30], BP86 functional [27,28] and RIJCOSX approximation [31,32] to speed up the Hessian calculation. Due to low symmetry of all four analyzed molecules, their calculated harmonic wavenumbers corresponds to nondegenerate values. All frequencies values of normal mode are real, confirming that the used geometry of samples corresponds to the equilibrium positions.
The harmonic vibrational wavenumbers of BA-2BUT, BA- IPA, BA and BA-EtOH molecules were obtained based on the numerical calculation of the second derivative of the energy with respect of nuclear position [28]. Thus, wavenumbers of all normal modes were calculated for each molecule: BA (C30H48O3-237 normal modes); BA-EtOH (C30H48O3.C2H5OH-264 normal modes); BA-2BUT (C30H48O3.C4H9OH-282 normal modes); BA-IPA (C30H48O3.C3H7OH-273 normal modes).
Results and discussions Vibrational analysis a)FT-IR spectra
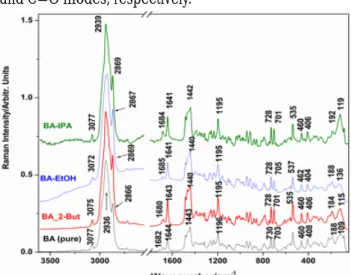
Experimental FT-IR spectra for three solvates of betulinic acid compared with pure betulinic acid spectrum, is given in figure 2.
Fig. 1. Geometry of BA-2BUT molecule illustrating the hydrogen bonding of the BA carboxylic group
with the 2-BUT solvent. (For interpretation of the references to
color in this figure legend, the reader should refer to the web
version of this article)
Fig. 2. Experimental FT-IR spectra of the three solvates and pure betulinic acid, as indicated on
each spectrum.
The main experimental FT-IR harmonic wavenumbers and their corresponding calculated values, as above presented, with tentative of their assignments, are collected in the table 1.
The FT-IR experimental and theoretical spectra of BA and its solvatomorphs presents in figure 2 and table 1 shows dominant IR absorption bands in the high wavenumber interval 3400 -3600 cm-1 coresponding to the streching vibration of O-H - a hydroxyl groups involved in hydrogen bond. The bands between 3000-2800 cm-1 are assigned to the C-H stretching modes. The wavenumbers and intensities from finger print region from 1800 to 400 cm”1 give very sofisticated informations about the new created molecule and required detailed spectroscopic calculations - through the analysis of normal coordinates. The key bands involving the carboxylic group C=O at 1687 in BA-EtOH and BA-2BUT, 1686 in BA-IPA, respectively 1685 cm-1 in the pure BA and C=C stretching modes at 1642and 1643 cm-1 were observed in all the experimental FT-IR spectra of solvatomorphs. The values of C=O modes are slightly different from those reported by Wang et al [13] in the FT- IR spectra of BA solvatomorphs. They reported FT-IR bands attributable to the C=O in the 1683-1678 cm-1 range. The higher wavenumbers of the C=O mode observed in the spectra of the present solvatomorphs suggest less involvement of the carboxylic group in hydrogen bonding interaction, which could be a consequence of the different preparation method.
FT-IR spectra present dominant bands around 1450 and 1377 cm”1 due to the CH3 bending modes , 1320 due to the CH2 bending modes, 882 due to the CH2 wagging modes and many other bands of medium to weak intensity. It can see from Table 1 that all main wavenumbers of absorption bands of pure BA are also present in the BA solvatomorphs systems spectra. Moreover, the calculated values of normal
wavenumbers for all the analyzed solvatomorphs are in good agreement with the corresponding measured ones.
b) FT-Raman spectra
Raman spectra of BA and its monosolvate systems are presented in the figure 3 in the 3600-0 cm-1 spectral range.
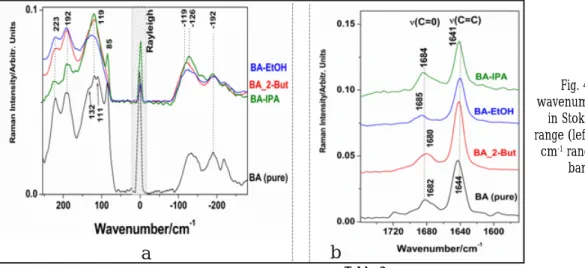
Key details are highlighted in the Figure 4 a,b for the low wavenumbers range (0-200) both in Raman Stokes and anti-Stokes and the 1550-1760 cm-1 range, bearing the C=C and C=O modes, respectively.
Table 1
EXPERIMENTAL FT-IR MAIN WAVE NUMBERS (EXP) AND CORRESPONDING CALCULATED (CAL) VALUES (ALL IN cm-1) FOR BA-EtOH, BA-2BUT, BA-IPA AND BA MOLECULES WITH THEIR TENTATIVE ASSIGNMENTS
Fig. 3. FT-Raman spectra of the solid, polycrystalline BA-EtOH, BA- 2BUT, BA-IPA compared to the spectrum of pure BA, as indicated.
Note that the highest intensity presents the normalized BA-IPA spectrum, followed by BA-2BUT and BA-EtOH respectively. The observed differences suggest slightly different Raman scattering cross section due to the different crystalline network.
The main experimental Raman harmonic wavenumbers and corresponding calculated values, as
they are presented in this paper, for BA-EtOH, BA-2BUT, BA-IPA and BA with tentative of their assignments, are collected in table 2.
From experimental point of view the FT-Raman data provided richer information than FT-IR analysis by including the low wavenumber range (0-200) cm-1. Due to low symmetry group of molecules, the vibrational modes are both IR and Raman active. The main bands of BA are observed in all solvatomorphs spectra with small differences in the peak positions (table 2). The differences between theoretical and measured of some wavenumbers could be due to the anharmonicity of some vibrational modesand overestimated the calculated force constants by used quantum method. In the high wavenumber region, a complex shaped band over the 2829-2992 cm-1 range, centered around 2940 cm-1 (activity 29.21 and de-
oplarization 0.10) has been observed. The weak band at 3070 cm-1 is characteristic for the aromatic C-H stretching.
In the ûngerprint region, the characteristic modes of lupanes keleton of the pentacyclic triterpene are observed as complex shaped Raman bands at 1685 (C=O) 1647 (C=C), 1440 (CH2,3 bend), 1258 (CH2 bend), 1198 (C-H bend), 947 (C-C bend), 881 (CH2 wag), 544, 412 (complex bendings involving C-O, O-H), 183, 119 cm”1 (lattice modes).
The most relevant changes on passing from the pure BA spectrum to the solvatomorphs are consistent with the change in the carboxylic and hydroxyl group modes wavenumbers due to the hydrogen bonding. As the employed solvents are polar protic, intermolecular hydrogen bonds are formed between carboxylic and hydroxyl groups of adjacent molecules in the crystalline network, in
Fig. 4. a). Details of the low wavenumbers FT-Raman spectra both
in Stokes and anti-Stokes spectral range (left). b). Detail of the 1550-1750
cm-1 range, characteristic for the key bands (C=C, C=O) (right)
Table 2
EXPERIMENTAL FT-RAMAN MAIN WAVE NUMBERS (Exp) AND CORRESPONDING CALCULATED (CAL) VALUES (ALL IN cm-1) FOR BA-EtOH, BA-2BUT, BA-IPA AND BA MOLECULES WITH THEIR TENTATIVE ASSIGNMENTS.
a b
agreement with the previous crystallography data reported by Wang et al (2014) [13]. Thus, as a consequence of the O-H…O hydrogen bonding, the characteristic C=O Raman mode position is changed from 1682 cm-1 (pure BA) to 1680 cm-1 (BA_2BUT), 1685 cm-1 (BA-EtOH) and 1684 cm-
1 (BA-IPA), respectively (fig.4 and table 2). As highlighted in the figure 4, the subtle differences of the lattice modes between the pure BA (85, 111, 119, 132, 192 cm-1) and the three solvatomorphs, clearly observable in the anti-Stokes range, show the crystalline matrix differences between BA-EtOH (the most similar with the pure BA) and the other two solvatomorphs. Our first report [16] on Raman signal of pure BA excited with the 514.5 nm line of an argon laser, revealed the weak band attributable to C=O mode at 1690 cm-1 while the stronger C=C mode at 1646 cm-1. Obviously, from these data, it is evident that either different Stokes of the commercially available BA or the solvatomorphs are subject of small differences in crystalline structure and consequently, in the emerged properties (purity, melting point, solubility, microcrystalline morphology) and further, in pharmaceutical formulation and bioavailability.
Conclusions
In this paper we have presented the experimental and theoretical investigations on the betulinic acid solvatomorph of ethanol, 2-butanol and isopropyl alcohol solvents. The obtained experimental FT-IR and FT-Raman spectra of the crystals, grown by recrystallization method, have been completely assigned based on the DFT method.
The calculation of harmonic vibrational wavenumbers of the BA and its solvatomorphs extracted from the corresponding molecular crystal has been achieved. The extraction is based on a fragmentation scheme, used in our previous paper, that treat each individual molecule as a distinct, non-overlapping fragment, taken into account their chemical connectivity. For all four types of molecules the harmonic vibrational wavenumbers are calculated, after geometry optimization of each molecule. The obtained results of calculations are compared with measured data and the agreement is quite satisfactory.
From analysis of the experimental and calculated spectra it appears that the BA solvatomorph products present characteristic features of both pure BA and solvents suggesting the formation of new molecules. The solvent molecules in all solvates form an integral part of the corresponding cr ystal’s unit cell, with a certain stoichiometric ratio to host molecules, bounded to the crystal lattice by hydrogen bonding, which improve the stability of the corresponding lattice.
This study demonstrates that DFT calculations at BP86/
TZVP level is a powerful tool for investigation the vibrational spectra of complex structures like BA and its derivatives.
Normalized, background subtracted Raman spectra of the solvatomorphs showed excellent consistency in terms of bands position and relative intensity with the Raman signal of the pure BA. Further, vibrational analysis correlates well with the data of the BA solvatomorphs slight crystalline differences.
Acknowledgment: This paper is a contribution to the Integrated Action Program Romania - France, GRANT no. 791/2
References
1. QIAN K., KIM S.Y., HUNG H.Y., HUANG L., CHEN C.H., LEE K.H., Bioorganic & Medicinal Chemistry Letters, 17, 2011, p.5944.
2. TANG W., CHEN N. H., LI G.Q., WANG G.C., LI Y. L., Acta Cryst., E70, 2014, p.1242.
3. ALAIDE B. S., GLAUCIO F.D., CLAUDIA C.D.C.N.H., CAROLINA LUNA S., BRUNO D.M.L., D.S.F. CARINE D.B.S., LEANDRO, ANA C.F., ANTONIO S.C., Academic Journal Biotechnology, 1, 2013, p.021.
4. LEE S. Y., KIM H. H., PARK S. U., EXCLI Journal, 14, 2015, p.199.
5. PERUMAL Y., SRIRAM D., Current Medicinal Chemistry, 24, 2005, p.657.
6. PERIASAMY G., TEKETELEW G., GEBRELIBANOS M., SINTAYEHU B., GEBREHIWOT M., KARIM A. , GEREMEDHIN G., Archives of Applied Science Research, 6, 2014, p.47.
7. M.S. DE SA , COSTA J.F., KRETTLI A.U. , ZALIS M.G. , MAIA G.L.
SETTE I.M., CAMARA C.A. , FILHO J.M. , GIULIETTI-HARLEY A.M., R. RIBEIRO DOS SANTOS , SOARES M.B., Parasitol Res., 105, 2009, p.275.
8. T. FUJIOKA , Y. KASHIWADA , R.E. KILKUSKIE , L.M. COSENTINO L.M. BALLAS, J.B. JIANG , W.P. JANZEN , I.S. CHEN , K.H. LEE, J.
Nat. Prod., 105, 243 (2009).
9. M. GHAFFARI MOGHADDAM, F. BIN, H. AHMAD AND A. SAMZADEH- KERMANI, Pharmacology & Pharmacy, 3, 119 (2012).
10. J. K. Adesanwo, O. O. Makinde, C. Obafemi, J. Pharm. Res., 6, 903 (2013).
11. Y. CHENG, Y.D.SHAO AND W.D.YAN, J. Chem Eng Data, 56, 4587 (2011).
12. S. BORYCZKA, E. BEBENEK, M.JASTRZEBSKA, J. KUSZ, M. ZUBKO, Z. Kristallogr., 227, 379 (2012).
13. X. WANG, N. GONG, S.YANG, G.DU AND Y. LU, J. Pharm. Sciences, 103, 2696 (2014).
14. K. FURIC, I. KODRIN, B.-M. KUKOVEC , Z. MIHALIC, Z. POPOVIC, Spectrochim. Acta A, 101, 273 (2013).
15. E-L. ANDREICI, R. ROMAN, M. NICOLOV, I. LEDETI, Z. SZABADAI AND N. M. AVRAM, AIP Conf. Proc., 1796, 030012 (2016).
16. S. C. PINZARU, N. LEOPOLD, W. KIEFER, Talanta, 57, 625 (2002).
17.A. FALAMAS, S.CINTA PINZARU, V.CHIS AND C. DEHELEAN, J. Mol.
Structure 993, 297 (2011).
18. A. FALAMAS, S. CINTA PINZARU, C. A. DEHELEAN, C. I. PEEV, C.
SOICA, J. Raman Spectrosc. 42, 97 (2011).
19. S. CINTA- PINZARU, C. A. DEHELEAN, C. SOICA, M. CULEA AND F.
BORCAN, Chem. Centr. J. 6, 67 (2012).
20. W. TANG, N. H. CHEN, G.Q. LI, G. C. WANG AND Y. L. LI, Acta Cryst., E70, 1242 (2014).
21. NICOLOV, M., DUSE, A.D., GEORGESCU, D., BORCAN, F., VELEA, P., Rev. Chim (Bucharest) 67, 2016, p. 1411.
22. HAHN T., Ed. International tables for crystallography, Vol. A, Springer, Berlin, 2005.
23. DOVESI R., ORLANDO R., ERBA A., ZICOVICH-WILSON C. M., CIVALLERI B., CASASSA S., MASCHIO L., FERRABONE M., DE LA PIERRE M., D’ARCO P., NOEL Y., CAUSA M., RERAT M., KIRTMAN B., Int. J.
Quantum Chem. 114, 2014, p.1287.
24. PEINTINGER M. F., VILELA OLIVIERA D., BREDOW T., J. Comput.
Chem., 34, 2013, p.451.
25. BECKE A. D., Phys. Rev., A38, 1988, p.3098.
26. PERDEW J. P., Phys. Rev. B33, 1986, p.8822.
27. NEESE F., The ORCA program system, Wiley Interdiscip. Rev.:
Comput. Mol. Sci. 2, 2012, p.73.
28. ORCA-An ab initio, DFT and semiempirical SCF-MO package-Version 3.0.3 (Manual), F. Neese-Design and Scientific Directorship, F.
Wennmohs-Technical Directorship, Max Plank Institute for Chemical Energy conversion, 2014.
29. SCHAFER A., HUBER C., AHLRICHS R., J. Chem. Phys. 100, 1994, p. 5829.
30. WEIGAND F, Phys. Chem. Chem. Phys., 8, 2006, p.1057 31. IZSAK R., NEESE F., J. Chem. Phys., 135, 2011, p.144105 32. NEESE F., WENNMOHS F., HANSEN A., BEKKER U., Chem. Phys., 56, 2009, p.98.
Manuscript received: 15.06.2018