Supporting Information
The dissolution kinetics of raw and mechanochemically treated kaolinites in industrial spent liquor – The effect of the physico-
chemical properties of the solids
Eszter Kása
a,b, Márton Szabados
a,b, Kornélia Baán
c, Zoltán Kónya
c,d, Ákos Kukovecz
c, Bence Kutus
b,e, István Pálinkó
a,b, Pál Sipos
b,f*aDepartment of Organic Chemistry, University of Szeged, Dóm tér 8, Szeged, H-6720 Hungary
bMaterial and Solution Structure Research Group, Institute of Chemistry, University of Szeged, Aradi Vértanúk tere 1, Szeged, H-6720 Hungary
cDepartment of Applied and Environmental Chemistry, University of Szeged, Rerrich B. tér 1, Szeged, H-6720 Hungary
dMTA-SZTE Reaction Kinetics and Surface Chemistry Research Group, University of Szeged, Rerrich B. tér 1, Szeged, H-6720 Hungary
eDepartment of Molecular Spectroscopy, Max Planck Institute for Polymer Research, 55128 Mainz, Ackermannweg 10, Germany
fDepartment of Inorganic and Analytical Chemistry, University of Szeged, Dóm tér 7, Szeged, H-6720 Hungary
*Correponding author.
E-mail address: sipos@chem.u-szeged.hu (P. Sipos)
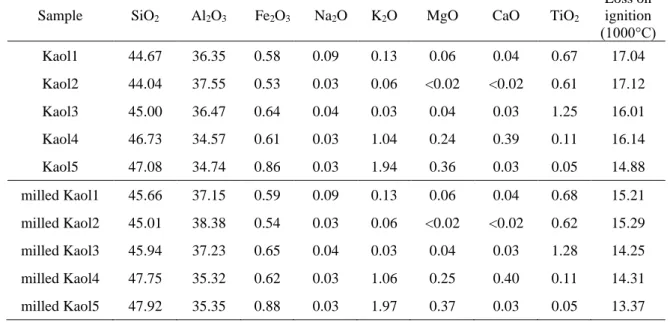
Table S1 Chemical compositions of the raw and 60 min milled kaolinites in mass%.
Sample SiO2 Al2O3 Fe2O3 Na2O K2O MgO CaO TiO2
Loss on ignition (1000°C)
Kaol1 44.67 36.35 0.58 0.09 0.13 0.06 0.04 0.67 17.04
Kaol2 44.04 37.55 0.53 0.03 0.06 <0.02 <0.02 0.61 17.12
Kaol3 45.00 36.47 0.64 0.04 0.03 0.04 0.03 1.25 16.01
Kaol4 46.73 34.57 0.61 0.03 1.04 0.24 0.39 0.11 16.14
Kaol5 47.08 34.74 0.86 0.03 1.94 0.36 0.03 0.05 14.88
milled Kaol1 45.66 37.15 0.59 0.09 0.13 0.06 0.04 0.68 15.21 milled Kaol2 45.01 38.38 0.54 0.03 0.06 <0.02 <0.02 0.62 15.29 milled Kaol3 45.94 37.23 0.65 0.04 0.03 0.04 0.03 1.28 14.25 milled Kaol4 47.75 35.32 0.62 0.03 1.06 0.25 0.40 0.11 14.31 milled Kaol5 47.92 35.35 0.88 0.03 1.97 0.37 0.03 0.05 13.37
4000 3600 3200 28001800 1600 1400 1200 1000 800 600
1640 975
915
Kaol1 Kaol2 Kaol3 Kaol4 Kaol5
Absorbance (a.u.)
Wavenumber (cm−1)
530 3695
3620 690
1005 1115
1030 1390
1140
3400 660
615
Fig. S1 FT-IR spectra of the solid products (mixtures of kaolinite and DSP phase) of the dissolution tests obtained by using various raw kaolinite samples and separated at the end of the kinetic runs from the reaction mixtures.
Table S2 The phase distribution of the raw kaolinites before and those of the DSP containing solids after the dissolution tests.
Crystal phase distribution (mass%)
Sample Kaolinite TiO2 SiO2 Muscovite DSP Before dissolution
Kaol1 88.4 <1 9.5 <1 − Kaol2 92.3 <1 4.6 <1 −
Kaol3 90.7 1.4 6.5 <1 −
Kaol4 84.2 <1 11.6 2.1 − Kaol5 84.5 <1 10.5 3.4 −
After dissolution
Kaol1 5.3 1.2 2.7 3.2 86.0
Kaol2 7.1 1.2 1.3 3.1 85.6
Kaol3 9.9 3.9 1.4 2.7 80.4
Kaol4 22.8 <1 7.2 9.4 58.3 Kaol5 47.1 <1 9.5 12.3 29.1
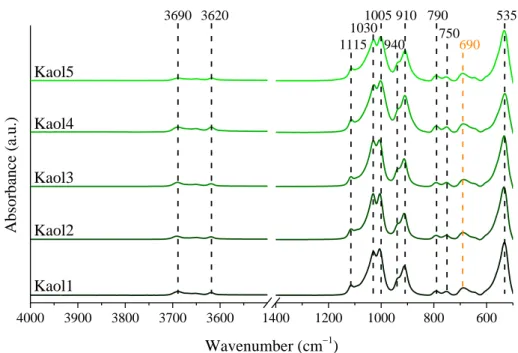
4000 3900 3800 3700 3600 1400 1200 1000 800 600 750
Kaol1 Kaol2 Kaol3 Kaol4
Absorbance (a.u.)
Wavenumber (cm−1) Kaol5
910 535
3690 3620 790
690 1005
1115 1030
940
Fig. S2 The FT-IR spectra of the raw kaolinite samples.
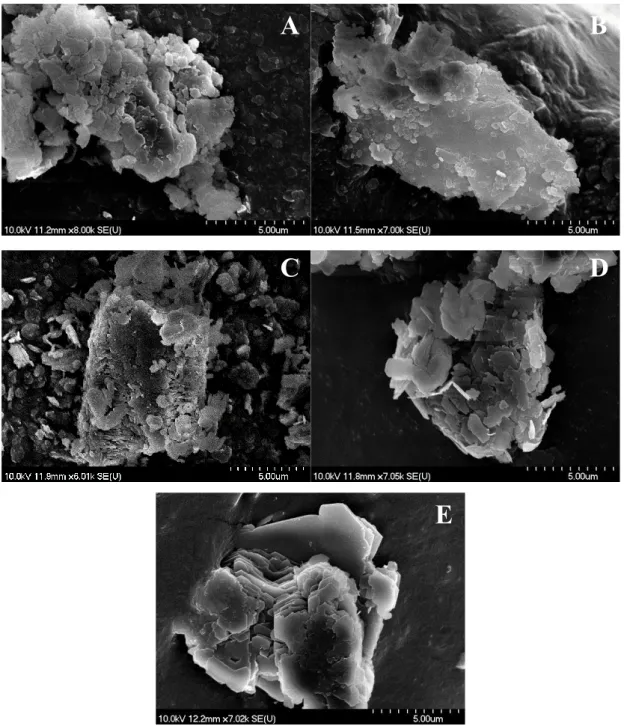
Fig. S3 SEM photos of the raw kaolinite solids: Kaol1 (A); Kaol2 (B); Kaol3 (C); Kaol4 (D);
Kaol5 (E).
0.0 0.2 0.4 0.6 0.8 1.0
0 20 40 60 80
Quantity adsorbed gas (cm3 /g STP)
Relative pressure (p/p0)
Adsorption
Desorption Kaol1
0.0 0.2 0.4 0.6 0.8 1.0
0 10 20 30 40 50 60 70
Quantity adsorbed gas (cm3 /g STP)
Relative pressure (p/p0) Kaol2
Adsorption Desorption
A B
C D
E
0.0 0.2 0.4 0.6 0.8 1.0 0
5 10 15 20 25 30 35 40
Quantity adsorbed gas (cm3 /g STP)
Relative pressure (p/p0) Kaol3
Adsorption Desorption
0.0 0.2 0.4 0.6 0.8 1.0
0 10 20 30 40 50 60
Quantity adsorbed gas (cm3 /g STP)
Relative pressure (p/p0) Kaol4
Adsorption Desorption
0.0 0.2 0.4 0.6 0.8 1.0
0 5 10 15 20 25 30 35
Quantity adsorbed gas (cm3 /g STP)
Relative pressure (p/p0) Kaol5
Adsorption Desorption
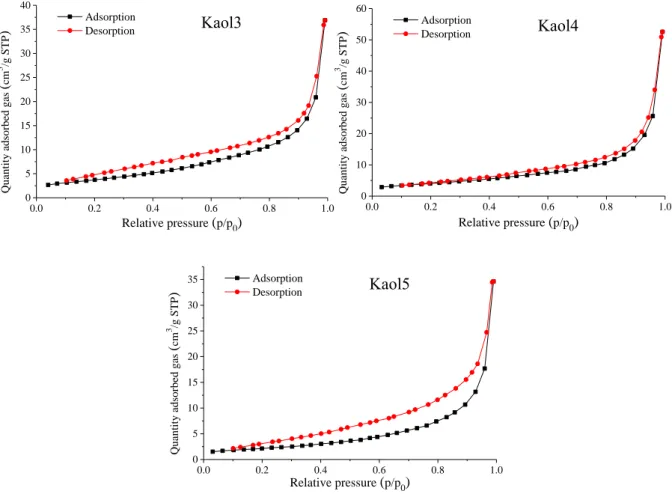
Fig. S4 The N2 adsorption-desorption isotherms of the various raw kaolinite samples.
100 1000
0 10 20 30 40
Intensity (%)
Hydrodynamic diameter (nm)
Kaol1 Kaol2 Kaol3 Kaol4 Kaol5 310
310
480 580
730
Fig. S5 The intensity-weighed size distribution curves of the raw kaolinite samples obtained from DLS measurements.
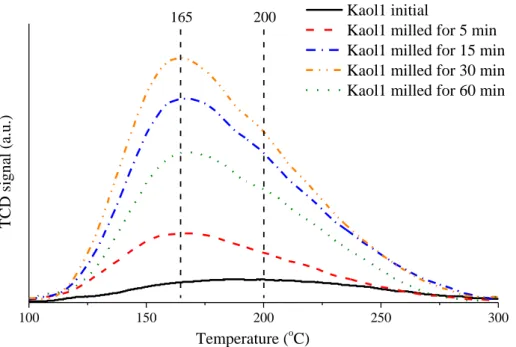
100 150 200 250 300
Temperature (oC)
TCD signal (a.u.)
Kaol1 initial
Kaol1 milled for 5 min Kaol1 milled for 15 min Kaol1 milled for 30 min Kaol1 milled for 60 min
165 200
Fig. S6 The NH3 temperature-programmed desorption curves of the raw and mechanically treated Kaol1.
100 150 200 250 300
TCD signal (a.u.)
Temperature (oC)
Kaol2 initial
Kaol2 milled for 60 min Kaol3 initial
Kaol3 milled for 60 min Kaol4 initial
Kaol4 milled for 60 min Kaol5 initial
Kaol5 milled for 60 min 170
Fig. S7 The TPD-NH3 patterns of the different raw and mechanochemically treated kaolinites.
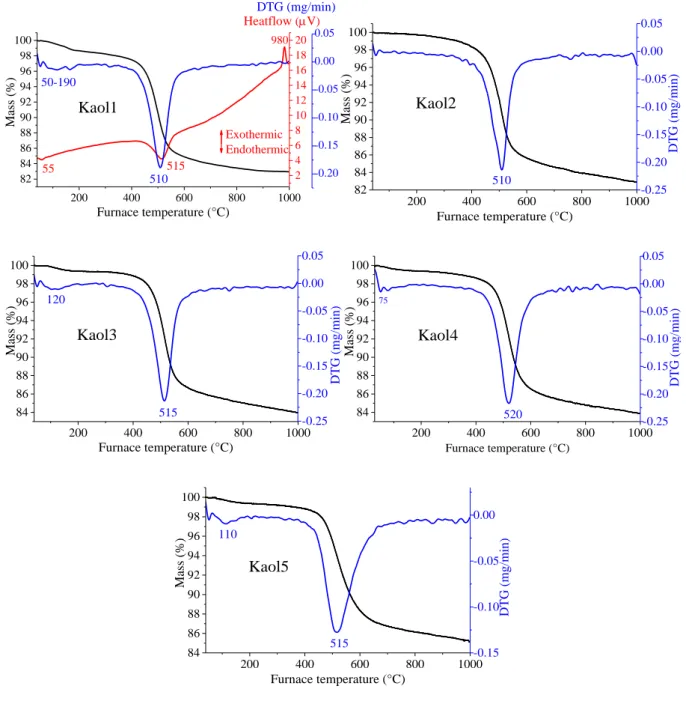
200 400 600 800 1000 82
84 86 88 90 92 94 96 98 100
Kaol1
980
55 50-190
Exothermic Endothermic
Heatflow (V)
Mass (%)
Furnace temperature (°C) 515 510
DTG (mg/min)
2 4 6 8 10 12 14 16 18 20
-0.20 -0.15 -0.10 -0.05 0.00 0.05
200 400 600 800 1000
82 84 86 88 90 92 94 96 98 100
Kaol2
DTG (mg/min)
Mass (%)
Furnace temperature (°C)
510 -0.25
-0.20 -0.15 -0.10 -0.05 0.00 0.05
200 400 600 800 1000
84 86 88 90 92 94 96 98 100
515 120
-0.25 -0.20 -0.15 -0.10 -0.05 0.00 0.05
Kaol3
Mass (%) DTG (mg/min)
Furnace temperature (°C)
200 400 600 800 1000
84 86 88 90 92 94 96 98 100
520
75
-0.25 -0.20 -0.15 -0.10 -0.05 0.00 0.05
Kaol4
DTG (mg/min)
Mass (%)
Furnace temperature (°C)
200 400 600 800 1000
84 86 88 90 92 94 96 98 100
Kaol5
515
DTG (mg/min)
Furnace temperature (°C)
Mass (%) 110
-0.15 -0.10 -0.05 0.00
Fig. S8 Thermogravimetric curves of the raw kaolinite samples.
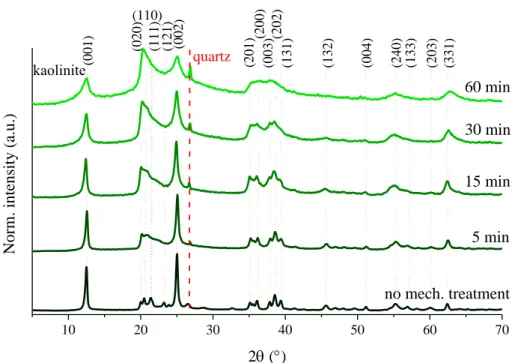
10 20 30 40 50 60 70
(331)
kaolinite (131)
(111)
Norm. intensity (a.u.)
2 ()
(110)
(201) (202) (240) (203)(003)(200)
quartz
(002)
(020)
5 min 15 min
no mech. treatment 30 min 60 min
(001) (121) (132) (004) (133)
Fig. S9 The XRD patterns of the Kaol1 samples milled for various times.
4000 3900 3800 3700 3600 1480 1110 740
60 min
30 min
15 min
5 min
Absorbance (a.u.)
Wavenumber (cm−1) no mech. treatment
3690 3620
750
910 790 535
690 1005
1115 1040
940
Fig. S10 The FT-IR spectra of the raw and mechanochemically treated Kaol1.
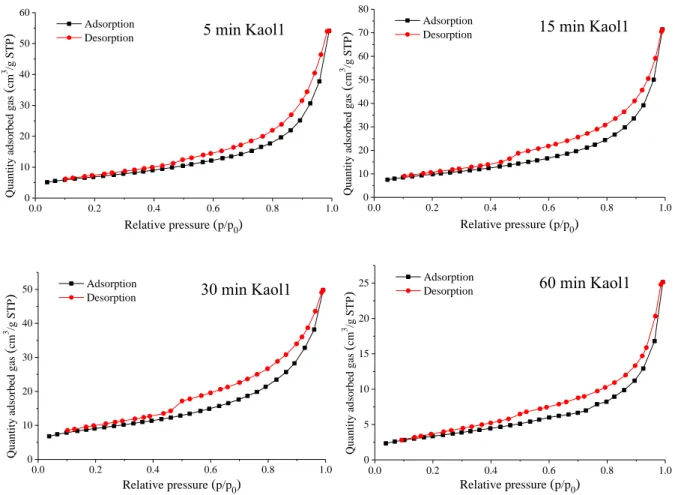
0.0 0.2 0.4 0.6 0.8 1.0 0
10 20 30 40 50 60
Adsorption Desorption
Quantity adsorbed gas (cm3 /g STP) 5 min Kaol1
Relative pressure (p/p0)
0.0 0.2 0.4 0.6 0.8 1.0
0 10 20 30 40 50 60 70 80
Adsorption Desorption
Quantity adsorbed gas (cm3 /g STP) 15 min Kaol1
Relative pressure (p/p0)
0.0 0.2 0.4 0.6 0.8 1.0
0 10 20 30 40 50
Quantity adsorbed gas (cm3 /g STP) Adsorption
Desorption 30 min Kaol1
Relative pressure (p/p0)
0.0 0.2 0.4 0.6 0.8 1.0
0 5 10 15 20 25
Quantity adsorbed gas (cm3 /g STP)
Adsorption
Desorption 60 min Kaol1
Relative pressure (p/p0)
Fig. S11 The N2 adsorption-desorption isotherms of the mechanochemically treated Kaol1.
100 1000
0 5 10 15 20 25 30
1170 760
160 200
1250 865
900 570
600 445
Intensity (%)
Hydrodynamic diameter (nm)
initial 5 min 15 min 30 min 60 min
Fig. S12 The intensity-weighed size distribution curves of the raw and mechanically treated Kaol1 obtained from DLS measurements.
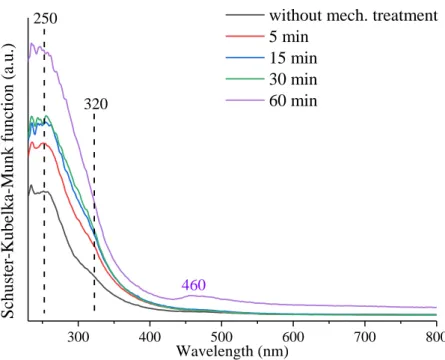
300 400 500 600 700 800 320
Schuster-Kubelka-Munk function (a.u.)
Wavelength (nm)
without mech. treatment 5 min
15 min 30 min 60 min
460 250
Fig. S13 The UV-Vis diffuse reflectance spectra of the raw and mechanochemically treated Kaol1.
200 400 600 800 1000
84 86 88 90 92 94 96 98 100
-0.20 -0.15 -0.10 -0.05 0.00
505
5 min
Mass (%) DTG (mg/min)
Furnace temperature (°C) 90
200 400 600 800 1000
86 88 90 92 94 96 98 100
15 min
Mass (%)
Furnace temperature (°C)
DTG (mg/min)
100
500
-0.15 -0.10 -0.05 0.00
200 400 600 800 1000
84 86 88 90 92 94 96 98 100
30 min
-0.15 -0.10 -0.05 0.00
Mass (%)
Furnace temperature (°C)
DTG (mg/min)
115
495
200 400 600 800 1000
84 86 88 90 92 94 96 98 100
60 min
Mass (%)
Furnace temperature (°C)
DTG (mg/min)
125
475 -0.08
-0.06 -0.04 -0.02 0.00 0.02
Fig. S14 Thermogravimetric curves of the mechanically treated Kaol1 samples.
10 20 30 40 50 60 70
2 ()
Norm. intensity (a.u.)
Kaol5 Kaol4
Kaol3 Kaol2 Kaol1 muscovite
quartz kaolinite
anatase
Fig. S15 The XRD patterns of the mechanochemically treated kaolinites (1 hour milling time).
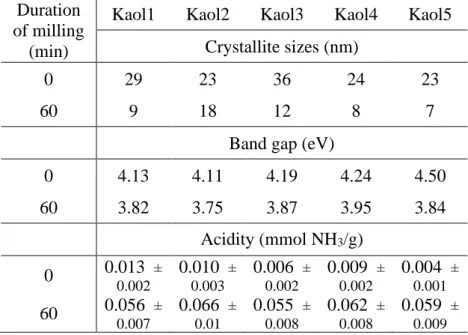
Table S3 Crystallite size, band gap and acidity values of the raw kaolinites before and after 1 hour milling.
Duration of milling
(min)
Kaol1 Kaol2 Kaol3 Kaol4 Kaol5 Crystallite sizes (nm)
0 29 23 36 24 23
60 9 18 12 8 7
Band gap (eV)
0 4.13 4.11 4.19 4.24 4.50
60 3.82 3.75 3.87 3.95 3.84
Acidity (mmol NH3/g) 0 0.013 ±
0.002
0.010 ± 0.003
0.006 ± 0.002
0.009 ± 0.002
0.004 ± 0.001
60 0.056 ± 0.007
0.066 ± 0.01
0.055 ± 0.008
0.062 ± 0.008
0.059 ± 0.009
Table S4 Chemical compositions of the obtained desilication products from the dissolution tests of raw and 60 min milled kaolinites in mass%.
Sample SiO2 Al2O3 Fe2O3 Na2O K2O MgO CaO TiO2 SO2
Loss on ignition (1000°C) Kaol1 - DSP 40.22 30.35 0.44 14.66 0.11 0.09 <0.02 0.61 4.30 8.82 Kaol2 - DSP 38.70 30.41 0.59 14.20 0.08 <0.02 0.02 0.58 3.81 11.03 Kaol3 - DSP 39.75 30.22 0.60 13.94 0.05 0.02 0.04 1.53 3.39 9.70 Kaol4 - DSP 42.92 28.77 0.57 11.51 0.23 0.21 0.34 0.19 3.15 11.34 Kaol5 - DSP 52.53 26.75 0.73 6.23 1.29 0.24 0.02 0.07 2.01 10.47 milled Kaol1 -
DSP 39.36 29.39 0.48 14.41 0.08 0.06 <0.02 0.58 3.89 11.20 milled Kaol2 -
DSP 40.04 30.59 0.64 14.38 0.03 0.03 0.02 0.64 3.93 9.41 milled Kaol3 -
DSP 39.78 30.11 0.58 14.09 0.02 0.05 0.03 1.39 3.16 10.50 milled Kaol4 -
DSP 40.15 29.39 0.46 13.97 0.19 0.15 0.28 0.17 3.78 10.95 milled Kaol5 -
DSP 40.70 30.78 0.76 13.73 0.65 0.22 0.03 0.08 2.84 9.65