Applied Clay Science 203 (2021) 105994
0169-1317/© 2021 The Author(s). Published by Elsevier B.V. This is an open access article under the CC BY-NC-ND license
(http://creativecommons.org/licenses/by-nc-nd/4.0/).
Research Paper
The dissolution kinetics of raw and mechanochemically treated kaolinites in industrial spent liquor – The effect of the physico-chemical properties of the solids
Eszter K ´ asa
a,b, M ´ arton Szabados
a,b, Korn ´ elia Ba ´ an
c, Zolt ´ an K onya ´
c,d, Akos Kukovecz ´
c, Bence Kutus
b,e, Istv ´ an P ´ alink ´ o
a,b, P ´ al Sipos
b,f,*aDepartment of Organic Chemistry, University of Szeged, D´om t´er 8, Szeged H-6720, Hungary
bMaterial and Solution Structure Research Group, Institute of Chemistry, University of Szeged, Aradi V´ertanúk tere 1, Szeged H-6720, Hungary
cDepartment of Applied and Environmental Chemistry, University of Szeged, Rerrich B. t´er 1, Szeged H-6720, Hungary
dMTA-SZTE Reaction Kinetics and Surface Chemistry Research Group, University of Szeged, Rerrich B. t´er 1, Szeged H-6720, Hungary
eDepartment of Molecular Spectroscopy, Max Planck Institute for Polymer Research, 55128 Mainz, Ackermannweg 10, Germany
fDepartment of Inorganic and Analytical Chemistry, University of Szeged, D´om t´er 7, Szeged H-6720, Hungary
A R T I C L E I N F O Keywords:
Kaolinite Dissolution kinetics Mechanochemistry Bayer process Spent liquor Desilication
A B S T R A C T
Using industrial spent Bayer-liquor solution and 95 ◦C temperature, the dissolution and desilication products formation kinetics of five raw kaolinite samples obtained from different sources were found to display profound differences. It was hypothesized that these differences were connected to the physico-chemical properties of the solids. The solids were characterized by powder X-ray diffractometry, N2 adsorption-desorption isotherms, temperature-programmed NH3 desorption, infrared and ultraviolet–visible diffuse reflectance spectroscopies, scanning electron microscopy connected with energy dispersive X-ray analysis, dynamic light scattering and thermal analysis. The detailed structural study of the as-received samples was supplemented by exploring the effect of mechanochemical treatment. It was found that beside specific surface area and pore volume, the amount of the Lewis acid sites proved to be the most important factors, and the picture was found to be modulated by the degree of aggregation of the primary particles. On mechanochemical treatment (60 min milling in a mixer mill), the number of the acid sites increased significantly (from 0.004–0.013 to 0.055–0.066 mmol/g), and largely as a result of this, the dissolution of all raw kaolinites became practically instantaneous and source-independent.
1. Introduction
Kaolin is one of the most widespread clays formed by the weathering of aluminous minerals. There is wide variability in the composition and other properties depending on the weathering processes and the degree of crystallinity. In general, these minerals consist mainly kaolinite with the mixture of quartz, mica, but contain other minerals as impurities too.
Kaolinite has a well-known chemical composition (Al4Si4O10(OH)8) and it crystallizes in triclinic structure. Kaolinite is constructed from tetra- hedral and octahedral sheets with hydroxyl groups coordinated to Al(III) cations. These sheets are interconnected by weak bonds, which lead to a large number of possibilities of different positions between the layers (Singh and Gilkes, 1992; Zbik and Smart, 1998).
The Bayer process is a well-established method used by the alumina industry to obtain Al2O3 from bauxite. The first step of the process is crushing, grinding and roasting the aluminum-bearing bauxite ore. Af- terward, the bauxite is digested in a hot solution of sodium hydroxide solution containing aluminate (spent liquor that is), which leaches aluminum from the other mineral constituents of bauxite, such as iron-, titanium- and silica-containing compounds. In the next step, aluminum is precipitated in the form of Al(OH)3, then it is calcined to form Al2O3
(Sidrak, 2001; Ruys, 2019).
In the bauxite, beside the aluminum-bearing constituents, several other components are present. One of them is kaolinite, which is known to be a source of several technological problems, such as scaling in the heat exchangers, or caustic loss (Roach and White, 1988). Although
* Corresponding author at: Material and Solution Structure Research Group, Institute of Chemistry, University of Szeged, Aradi V´ertanúk tere 1, Szeged H-6720, Hungary.
E-mail address: sipos@chem.u-szeged.hu (P. Sipos).
Contents lists available at ScienceDirect
Applied Clay Science
journal homepage: www.elsevier.com/locate/clay
https://doi.org/10.1016/j.clay.2021.105994
Received 23 September 2020; Received in revised form 13 January 2021; Accepted 17 January 2021
these are huge problems of alumina processing, the considerable num- ber of studies in the field of kaolinite dissolution were largely performed under conditions, which were far from those typical in the Bayer industry.
A large fraction of the published works on kaolinite dissolution ki- netics is concerned with acidic or neutral media (Polzer and Hem, 1965;
Chin and Mills, 1991; Ganor et al., 1995; Okada et al., 1998; Belver et al., 2002; Zhu et al., 2014; Komadel, 2016). In the alkaline end, Carroll- Webb and Walther (1988) presented experimental and theoretical potentiometric titrations of kaolinite at 25 and 60 ◦C. At both temper- atures, a correlation was found between the pH and the dissolution rate of Al and Si. In a subsequent study, they suggested silicon detachment as the rate-limiting step at high pH (Carroll and Walther, 1990). Xie and Walther (1992) proposed that the SiO− surface groups had greater in- fluence on the surface charge below pH 11, while the AlO− surface groups dominated the surface charge above pH 11, at room temperature.
Aldabsheh et al. (2015) studied the dissolution behavior of three clay- rich raw materials (one of them was the kaolinite) in NaOH and KOH solutions at 25 ◦C. Beside the concentration of dissolved silicon and aluminum, they characterized the applied solids as well. They found that precipitation also needed to be taken into account owing to competition with concurrent dissolution of aluminum and silicon compounds.
As it was shown, the temperature, pH, concentration of the media and stirring rate exert important effects on the dissolution rate of kao- linites. In addition, the physico-chemical properties of the solid phase also significantly influences these processes. This aspect is largely un- charted though.
Mechanochemical treatments by high-energy milling have received increasing attention due to the induced characteristic modifications of the textural properties, the morphology, the internal structure of solid materials and the numerous easily available, moderately priced and simple-to-set-up devices (rolling-, mixer- or planetary mills) making them suitable for lab-scale or even industrial applications (Juhasz and Opoczky, 1990). It is relatively well-established that grinding of kaolinite results in crystallinity loss or even delamination and hence modifies its physico-chemical characteristics (Miller and Oulton, 1970;
Gonzalez Garcia et al., 1991; Kristof et al., 1993; Juhasz, 1998; Sanchez- Soto et al., 2000; Frost et al., 2001; Temuujin et al., 2001; Horvath et al., 2003; Frost et al., 2004; Valaskova et al., 2011; Hamzaoui et al., 2015;
Balczar et al., 2016). The effects of mechanochemical treatments on the dissolution behavior are rarely investigated. Juhasz (1980) treated mechanically kaolin samples by a vibration mill, then performed solu- bility test in hydrochloric acid. He concluded that in dilute acids the milled kaolin was more soluble than the well-crystallized one. Tang et al.
(2010) observed similar changes, moreover, it was concluded that the dissolution became less sensitive to temperature after mechanical acti- vation. Rescic et al. (2011) carried out extraction tests with using various solutions, and made observations similar to those given above.
They found that the increase in solubility changed with the grinding time in non-linear way. It was explained in terms of the low hardness of the clays, which facilitated the formation of amorphous kaolinite (this will be called hereafter amorphization). Mako et al. (2006) demon- strated that the mechanochemical treatment could be an effective way to create porous silica from the milled kaolinites by selective leaching of the highly deformed, amorphized moieties. By using an oscillating mill, Aglietti et al. (1986) concluded that some degree of bond cleavage and activation of the surface sites of the kaolinites might take place. This resulted in improved reactivity both in cation exchange and in dissolu- tion measurements, however, the overall stoichiometric ratio of kao- linites was found unchanged after the mechanical treatment.
In the studies published in the open literature, for the dissolution studies, NaOH or KOH solutions were used as alkaline media and the temperature range covered 25–80 ◦C. In the aluminum industry, spent liquor, which is a recycled supersaturated sodium aluminate solution, is in contact with the kaolinite being present in the bauxite and the operation temperature is 95 ◦C. Up to now, only a few works have been
published on the kinetics of kaolinite dissolution in such spent liquors (Roach and White, 1988; Barnes et al., 1999; Peng et al., 2018). In these studies, the properties of the initial (as well as the precipitated) solid materials were not studied systematically.
In this experimental work, five raw kaolinite specimens from different sources were examined with the aim of finding correlation between the various properties of the solids and their dissolution behavior under conditions relevant to the Bayer process. At first, the dissolution kinetics of these samples were determined under conditions resembling the industrial one using supersaturated sodium aluminate solution ([NaOH]T =4.5 M, [Al(III)]T =1.9 M) at 95 ◦C. The starting and final compositions, internal structures, thermal and textural properties, sizes and morphologies of the solid materials were characterized by several techniques. In addition, the physicochemical properties of the raw kaolinite samples were modified by using mechanochemical treat- ment with various durations and extended to kaolinites from different sources. The ultimate goal was to identify the key parameter or pa- rameters that exert the most significant impact on the dissolution ki- netics of raw kaolinite under conditions relevant to the Bayer process.
This has the potential of practical application, providing a toll for pre- dicting and possibly manipulating the dissolution behavior of kaolinite components present in bauxite.
2. Experimental 2.1. Materials
Irregular aluminum shots (99.9%, Alfa Aesar) and sodium hydroxide (initial concentration 9 M) solutions were used to prepare the sodium aluminate stock solution, from which the Bayer solutions with compo- sition typical to a spent liquor were prepared (see below). Anhydrous sodium sulfate (99.92%, Molar Chemicals) and anhydrous sodium car- bonate (99.9%, VWR) were used as received. The NaOH used for pre- paring the spent liquor was diluted from a 50 mass% NaOH solution, prepared by dissolving NaOH pellets (a. r. grade, VWR) in continuously stirred MilliQ water (Merck Millipore Milli–Q) applying a reflux equipped with a CO2 trap. The resulted liquor was filtered through 0.45 μm PTFE membrane while CO2 trap was used. Appropriate portions of the caustic solution were diluted to obtain ca. 1 M NaOH stock solutions, which were standardized by HCl solution. The 1 M stock solutions of the acid were made by volumetric dilution of ≈37 mass% HCl (a. r. grade, VWR), and they were standardized with KHCO3 solution (Kutus et al., 2018).
During the measurements, five high-grade natural and commercially available raw kaolinite (Al2Si2O5(OH)4) samples from different sources were used. Hereafter, the following acronyms will be used: Kaol1 (Eckalite1 from Imerys Minerals Ltd.), Kaol2 (Alfa Aesar, batch number:
P01E055), Kaol3 (Georgia KGa–1B), Kaol4 (Zettlitz/Sedlec) and Kaol5 (Sigma–Aldrich, batch number: BCBV6863). By energy-dispersive X-ray, Inductively Coupled Plasma-Optical Emission Spectrometry (ICP-OES), and thermogravimetric analysis measurements, the as-received mate- rials had the following Si/Al molar ratio: Kaol1 1.04, Kaol2 0.99, Kaol3 1.05, Kaol4 1.15, and Kaol5 1.15, and the chemical composition of them was detailed in Table S1 (S′′is the notation used in the Electronic Sup- porting Information, ESI).
2.2. Dissolution study
An equipment was designed and implemented in which the samples for obtaining the kinetic data were prepared. These kinetic tests were performed in a 280 mL polytetrafluoroethylene (PTFE) vessel and the temperature of the Bayer liquor was 95 ◦C (using silicon oil bath). The PTFE vessel was placed in a custom made, jacketed hard glass jar, in which the heat transfer was facilitated by glycerol. The target temper- ature was found to be reached within an hour, and it was constant within
±0.5 ◦C for several hours. After a period of 6 h, the evaporation loss was
checked gravimetrically, and it was found to be ca. 1%.
In order to study the kinetics of the dissolution, a model spent liquor was prepared with the following composition (hereafter the subscript T denotes total or analytical concentrations, their estimated uncertainty was ±2%): [NaOH]T =4.50 M, [Al(III)]T =1.90 M, [Na2SO4]T =0.05 M, [Na2CO3]T =0.20 M. The initial concentration of the added kaolinite was 23 g/L. These experiments were performed in triplicate, and each took 360 min. Recording the time commenced after 1 min of initial mixing the spent liquor with the solid. Samples for characterization were withdrawn in every 20 min during the first three hours, then one sample per hour for the remaining 180 min. The dissolved Si(IV) concentration of the liquid samples was determined by ICP-OES. The solid products obtained by the end of the experiments (after 360 min) were separated from the mother liquor on 0.45 μm filters, washed with distilled water and dried at 80 ◦C.
2.3. Mechanochemical and thermal treatment of the kaolinite samples The raw kaolinite samples were dry-milled in a Retsch MM 400 mixer mill at various grinding times (between 5 and 60 min). The grinding frequency (12 Hz) and ball/sample mass ratio (100) were held constant during the experiments. The mill had two stainless steel grinding jars (50 cm3 inner volume) and grinding balls (8.2 cm3 volume and 25 mm diameter). The jars moved in radial oscillations along the horizontal axis, and inside, the balls impinged from the rounded ends of the jars, which resulted in partially different deformations to those, which appear in the planetary ball or vibrating mills (Balaz, 2008).
2.4. Apparatus and equipment for characterization
ICP-OES with radial configuration (Thermo Scientific iCAP 7400 ICP-OES DUO spectrometer) was used for the determination of the chemical composition of the raw, milled kaolinites and the desilication products (DSP, the precipitate collected from the reaction vessel after completing the dissolution experiment, see below) and silica concen- tration in the Bayer liquor samples (with yttrium as internal standard) diluted and acidified with HCl prior to the measurements. The dissolu- tion of the solids from different sources were aided by microwave digestion.
Powder X-ray diffraction (XRD) patterns of the kaolinites as well as those of the desilication products were registered on a Rigaku Miniflex II instrument instrument (operating at 30 kV and 15 mA, with Ni foil Kβ filter and scintillation detector) in the range of 2θ =4–70◦with 4◦/min scanning rate (in continuous mode with step width of 0.02◦2θ), using CuKα (λ =1.5418 Å) radiation. The reflections were assigned with the help of the JCPDS− ICDD (Joint Committee of Powder Diffraction Standards − International Centre for Diffraction Data) database. The average crystallite sizes were calculated and compared by the Scherrer equation from the first reflection (001) of the raw/milled kaolinites (Awad et al., 2018) applying 0.9 shape factor and Si (111) standard reflection.
The structure of the solids were also studied by Fourier-transform infrared spectroscopy, FT–IR (JASCO FT/IR–4700 spectrophotometer).
The applied resolution was 4 cm−1, and 256 scans were accumulated for each spectrum. The spectrometer was equipped with a DTGS detector and ZnSe ATR accessory. The FT-IR spectra were recorded in the 4000–500 cm−1 wavenumber range, and were subsequently normalized with respect to the most intense absorption band.
The textural parameters of the raw and milled kaolinites were mapped by N2 adsorption-desorption measurements on a Quantachrome NOVA 3000e instrument. The solids were degassed at 300 ◦C for 1 h in vacuum to remove surface adsorbates. The specific surface areas were determined by the Brunnauer-Emmett-Teller (BET) equation from the adsorption branches. To calculate the total pore volumes, the Bare- tt− Joyner− Halenda (BJH) method was applied by using the desorption branches.
The morphologies of the raw/milled kaolinite samples and the DSP materials were examined by scanning electron microscopy (SEM, Hita- chi S–4700 type II) at various magnifications and acceleration voltages.
A few nm of conductive gold–palladium alloy film was sublimed onto the surface of the samples in order to avoid charging. The microscope was equipped with energy dispersive X-ray analysis (EDAX) detector (R¨ontec QX2 spectrometer with Be window) for estimating the elemental composition.
A Malvern NanoZS dynamic light scattering (DLS) instrument oper- ating with a 4 mW helium‑neon laser light source (λ =633 nm) was applied to map the heterogeneity in the particle diameters in solution (due to various degrees of aggregation) and hydrodynamic diameters of the raw and milled kaolinites at room temperature. The measurements were performed in back-scattering mode at 173◦, and the samples were dispersed in distilled water (0.05 g/L dispersion concentration). Sample pretreatment included 1 h ultrasonic irradiation prior to measurements.
In order to collect information about the thermal attributes of raw/
milled kaolinites (TG, DTG and DTA), the samples were analyzed in a Setaram Labsys derivatograph working under air at 5 ◦C/min heating rate. For the measurements, 25–30 mg of the samples were used in alumina crucibles.
The NH3 temperature-programmed desorption (TPD) was carried out by a BELCAT-A catalyst analyzer. Before the measurements, the solids were degassed in helium flow at 300 ◦C for 60 min to ensure clean surface. The samples were saturated with NH3 at 90 ◦C and heated at constant heating rate of 20 ◦C/min up to 300 ◦C. The NH3 desorption was detected by thermal conductivity detector.
The UV–Vis spectra of some of the solids were measured by diffuse reflectance spectroscopy (DRS) on an Ocean Optics USB4000 spec- trometer equipped with DH-2000-BAL light source. The reflectance spectra were registered in the 230–800 nm range against a BaSO4 white reference sample at room temperature. The spectra were transformed by the Schuster-Kubelka-Munk function to analyze the absorption profiles of the samples. The optical energy gaps were calculated from the extrapolation of the straight section of modified Schuster-Kubelka-Munk function plotted as a function of the energy of the incident light (Tauc- plot).
Fig. 1.The dissolution of raw kaolinites from different sources followed by the precipitation of DSP: the variation of the dissolved Si concentration (expressed in terms of [SiO2]T in g/L) as a function of time. Initial concentrations:
[NaOH]T =4.5 M, [Al(III)]T =1.9 M, [Na2SO4]T =0.05 M, [Na2CO3]T =0.20 M, added kaolinite: 23 g/L, T =95 ±0.5 ◦C. Until t =0 min, ca. 1 min mixing was allowed for the kaolinite in the spent liquor.
3. Results and discussion
3.1. Dissolution study on the kaolinite samples
Under conditions used by the Bayer industry (95 ◦C, supersaturated sodium aluminate solution), it could be observed, that kaolinite disso- lution was accompanied by the precipitation of the DSP (Fig. 1). When the dissolved Si(IV) concentration (expressed in g SiO2/L of solution) was plotted as a function of time, a curve with a maximum was obtained.
This maximum is the so-called trigger point, which means that from this concentration, the precipitation of DSP removed more Si(IV) from the solution, than the Si(IV) stemming from the dissolution of kaolinite.
That is, the formation of DSP was faster than the dissolution of the kaolinite. After the trigger point, the total concentration of dissolved Si gradually decreased and asymptotically approached a limiting value;
this was accompanied with DSP formation (Roach and White, 1988;
Peng et al., 2018).
From Fig. 1, it is striking, that the dissolution kinetics dramatically differed from sample to sample. The trigger point of the Kaol1 solid appeared at around 40 min, while it was shifted up to 100 min for Kaol4 and 160 min for Kaol5. The maximum concentrations of dissolved silica were also found to change systematically. To understand the underlying chemical reasons of the different dissolution behaviors, the starting raw kaolinite samples as well as the DSP materials formed were investigated in detail.
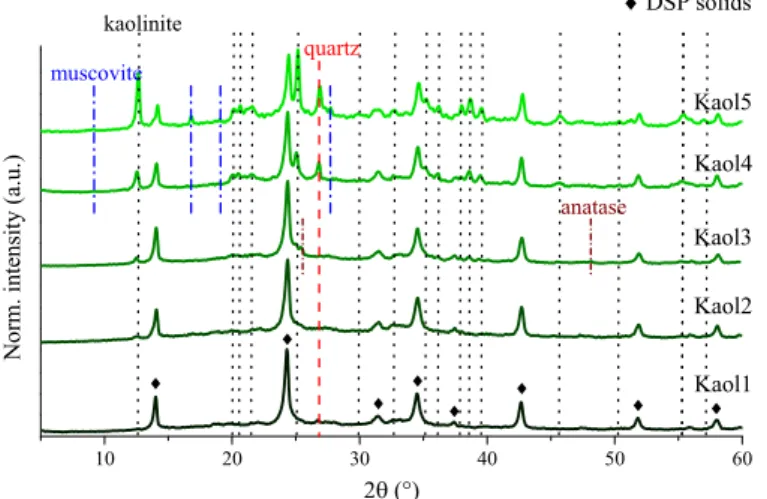
On the basis of the X-ray diffractograms (Fig. 2) and the FT-IR spectra (Fig. S1), the formation of a mixture of hydroxide-, sulfate- and carbonate-containing sodalites, Na8(AlSiO4)6(OH)2(H2O)2 – hydroxy- sodalite, Na8(AlSiO4)6SO4 − lazurite and Na8(AlSiO4)6CO3 − carbonate- nosean, respectively, (JCPDS card no. 01-076-1639 and 01-077-1702, 01-089-0843, respectively) could be identified as the desilication products (Peng et al., 2018; Vogrin et al., 2020). However, the incom- plete transformation/dissolution of the raw kaolinites could also be observed, the typical reflections of kaolinite traces (Al2Si2O5(OH)4, JCPDS card no. 01-089-6538) around 12◦, 21◦, 25◦and 38◦2θ could be clearly identified beside the reflection of the quartz (SiO2, JCPDS card no. 01-085-0457), muscovite (KAl2(AlSi3O10)(OH)2, JCPDS card no. 01- 082-0576) and anatase (TiO2, JCPDS card no. 01-071-1166) phases.
These patterns confirmed the results obtained from the dissolution tests:
for Kaol4 and Kaol5, remarkably longer (more than 360 min) digestion time was needed for the total dissolution of raw kaolinite and trans- formation into DSP. The relative contributions of the DSP and kaolinite phases were calculated from the comparison of the intensities of the corresponding reflections (Hubbard et al., 1976). Data thus obtained showed less than 10 mass% unreacted raw kaolinite for Kaol1, Kaol2 and Kaol3, while around 25 mass% for Kaol4 and 50 mass% for Kaol5 (Table S2). The FT-IR spectra (Fig. S1) further confirmed the XRD findings: several absorption bands assigned to the kaolinite phase were observed (Fig. S2). Between 3695 and 3620 cm−1 internal and external (Al − OH) stretching vibrations, at 1115, 1030 and 1005 cm−1, the Fig. 2. Powder XRD patterns of the solid products (mixtures of kaolinite and DSP) of the dissolution tests obtained by using various raw kaolinite samples and separated at the completion of the kinetic runs from the reaction mixtures.
Fig. 3. Powder XRD patterns of the raw kaolinite samples from different sources.
signal of symmetric and asymmetric absorption bands of Si − O are seen.
The strong shoulder-type sign around 940/915 cm−1 and the bands under 800 cm−1 were attributed to the deformation mode of (Al − OH) and the Si − O − Al, respectively, with the weak signals of Si − O bonds in the quartz phase around 690 cm−1 (Hamzaoui et al., 2015; Albach et al., 2019; Kloprogge, 2019). These signs were merged with those of the DSP phases, the broad band of crystalline water hydroxyl groups in hydrogen bonding network around 3400 cm−1, bending vibrations of water molecules at 1640 cm−1 and the band of tetrahedral (Si, Al) − O at 975 cm−1. The weak signs at 660/1390 and 615/1140 cm−1 could be attributed to the vibrations of carbonate and sulfate anions, respectively (Kloprogge et al., 2002; Vaiciukyniene et al., 2009). Nevertheless, in the spent liquor applied, the molar amount of the hydroxide and tetrahy- droxoaluminate anions were significantly larger than those of the sulfate and carbonate anions, therefore the formation of the DSP solids with incorporated OH−/Al(OH)4− anions is extremely likely; this explains the low absorption bands of the carbonate and sulfate anions (Vogrin et al., 2020).
3.2. Physico-chemical characterization of the raw kaolinite samples from different sources
The DSP solids formed during the kinetic runs were chemically indistinguishable. Accordingly, it was hypothesized that the signifi- cantly different dissolution behavior of the raw kaolinite samples is associated with some physico-chemical property (or properties) of the as-received compounds. To reveal and better understand this, the solids were investigated systematically by various characterization techniques.
Using the XRD patterns (Fig. 3), the crystal phase distribution of the raw kaolinite particles were estimated (Table 1 and Table S2) using known literature procedures (Hubbard et al., 1976). This, together with the EDAX/ICP-OES (Table S1) results confirmed that only kaolinite, quartz and in some cases muscovite and anatase were present in every sample.
The measured K2O contents (presumably all originated from the muscovite phase) were the highest (1.04, 1.94 mass%) for the Kaol4 and Kaol5 solids (showing the slowest dissolution rates), therefore it can be stated that the presence of the muscovite phase might have influence on the weathering kinetics, however, the rest of the raw kaolinites had similarly low K2O contents (between 0.03 and 0.13 mass%), but showed significantly different dissolution patterns. Moreover, the XRD patterns of the DSP solids prepared from Kaol5 and Kaol4 samples attested the presence/integrity of the muscovite phase indicating their partially inertness in the applied alkaline environment. While, the amount of the muscovite and anatase phase was relatively negligible and was detect- able only for the Kaol3, Kaol4 and Kaol5 samples, respectively, the contribution of quartz was found to vary between 5 and 12%. The
calculated mass% values showed that there was no correlation between the crystal phase distribution and the dissolution rate, for example, the
“fastest” (Kaol1) and the “slowest” (Kaol5) raw kaolinite samples had similar kaolinite − quartz phase compositions.
In principle, the crystallinity of the materials highly influences their dissolution. The Hinckley indices are well-known from the literature of kaolinites, and are used for characterizing crystallinity. The Hinckley index is calculated on the basis of the intensities of the characteristic reflections of kaolinite phase on XRD patterns (Plancon et al., 1988).
Neither the Hinckley indices nor the average crystallite sizes (obtained from the XRD via the Scherrer equation) correlated with the kinetics of the dissolution of the clay minerals (Table 1). Moreover, the SEM images of the raw kaolinites showed highly-crystalline and plate-like morphology typical for these clay minerals (Bohor and Hughes, 1971) without significant visually detectable differences (Fig. S3).
From the N2 adsorption measurements, the specific surface areas and the total pore volumes were also determined (Table 1). The samples can be characterized with similar textural features having Type IV isotherms with H3 hysteresis loops by the IUPAC classification (Sing et al., 1985);
these are most likely originated from slit-shaped pores (Fig. S4). The textural parameters just partially reflected the differences seen in the dissolution rates: Kaol5 with the smallest specific surface area dissolved the slowest and the faster dissolving raw kaolinites had the largest specific surface areas and total pore volumes. However, Kaol2 and Kaol4 do not fit entirely into this series.
The intensity-weighed size distribution values obtained from the DLS measurements are also shown in Table 1. The predominant hydrody- namic diameters follow reasonably well the sequence noticed in the solution tests: the increasing sizes are accompanied with slower disso- lution rates. Here, the only outlier is the Kaol1 (Fig. S5). The obtained size distribution range of Kaol2 was the widest (from 90 to 900 nm, Table 1), while that of Kaol3 and Kaol4 were found to be sharper (150–600 and 300–850 nm, respectively). The polydispersity indices (not shown) were found to be relatively large, between 0.5 and 0.7. This is more or less predictable, as mined solids are not expected to be monodisperse (Kretzschmar et al., 1998).
The NH3 − TPD was measured to characterize the acidity of the raw kaolinite samples, which could explain the different dissolution kinetics.
At low temperature (around 200 ◦C), ammonia bonded with weaker coordinative desorbed suggested to be the Lewis acid sites (Figs. S6–7).
These centers were composed of partially dehydroxylated Al(III) and Si (IV) ions. The acidity was also depended on the Al(III):Si(IV) ratio in the raw kaolinite samples (Al Sawalha et al., 2011; Kumar et al., 2013). As it could be seen in Table 1, the acidity (changing from 0.004 to 0.013 mmol NH3/g) changed more or less in parallel with the specific surface area and the total pore volume. Hence, with the larger specific surface Table 1
Various physico-chemical parameters of the as-received kaolinite specimens.
Sample Kaolinite − quartz content1 (mass%)
Hinckley
index2 Average crystallite
sizes3 (nm) Specific surface
area4 (m2/g) Total pore volume5
(cm3/g) Hydro-dynamic
diameter6 (nm)
Acidity7 (mmol
NH3/g) Second mass loss8 (%)
Kaol1 88–10 1.24 29 15.6 ±0.9 0.053 ±0.008 300–1000 0.013 ±0.002 15.3
Kaol2 92–5 0.56 23 16.2 ±1.2 0.047 ±0.006 90–900 0.010 ±0.003 16.5
Kaol3 91–7 0.90 36 13.7 ±1.1 0.032 ±0.006 150–600 0.006 ±0.002 15.3
Kaol4 84–12 0.85 24 14.6 ±0.7 0.040 ±0.005 300–850 0.009 ±0.002 15.2
Kaol5 85–11 0.93 23 7.8 ±0.6 0.027 ±0.003 500–1200 0.004 ±0.001 14.1
1Estimated on the basis of the XRD patterns.
2Calculated according to Plancon et al., 1988.
3Calculated on the basis of the Scherrer equation.
4Obtained from the BET absorption isotherms.
5Calculated by using the BJH method for the desorption branches.
6Obtained from dynamic light scattering (DLS).
7Obtained from temperature programmed NH3 desorption (TPD).
8Corresponding to the departure of structural water at ca. 500 ◦C.
area the NH3 molecules were able to be bond to more metal atoms, and/
or the silica to aluminum ratio was higher on the surface of the solids.
Interestingly, the acidity values obtained parallel well with the disso- lution rates, here, the exception is the Kaol4 sample.
Thermal analysis of the kaolinites between 40 and 1000 ◦C resulted in the TG-DTG-DTA curves shown Fig. S8. The thermal behavior of the samples is fairly similar, almost identical. The heat flow curves (shown only for Kaol1) uniformly indicated two endothermic transformations:
the removal of the physisorbed water from the external surface up to 200 ◦C, and departure of the structural hydroxyl groups up to 1000 ◦C (maxima around 515 ◦C). The only exothermic peak (at 980 ◦C) is related to the formation of the Al–Si spinel phase (Zhang et al., 2019).
In all cases, the sum of the second mass losses were around 15 mass%
(Table 1) indicating the absence of significant differences in the dehy- dration of aluminum hydroxide component.
From the observations listed above, it can be concluded, that the significantly different dissolution behavior of the five raw kaolinite samples, which were obtained from different sources cannot be ratio- nalized in terms of only one predominant physico-chemical property. To explain these differences in kinetics, an interplay between these features needs to be taken into consideration. Most probably, the specific surface area, together with the total pore volume, the Lewis site amount and the hydrodynamic diameter together are most likely to exert direct influ- ence on the rate of dissolution. The other parameters determined seem to be much less significant.
To gain detailed further information about the role of the textural, acidity and size characteristics regarding the dissolution of raw kaolin- ites in industrial environment, mechanochemical transformations were carried on these materials.
3.3. The effect of the mechanochemical treatment on Kaol1
As common reference kaolinite in the industry (Eckalite that is), this part of the project commenced with the Kaol1. The as-received solids were milled for 5, 15, 30 and 60 min before the dissolution tests, to examine the effect of grinding time on the structural modifications of raw kaolinites and DSP formed in view of the dissolution rates obtained.
The mechanical activation exerted large effect on the kinetics, the trigger point was gradually decreased, and after 15 min of grinding, the dissolution was found to be practically instantaneous. In addition, the maxima of the dissolved silica concentrations were also found to in- crease with increasing milling time (Fig. 4). Interestingly, using heat treatments between 500 and 600 ◦C, Peng et al. (2018) found similar tendency; increased silica concentrations and shifted, but not dis- appeared trigger point.
The XRD patterns of the milled kaolinites attest significant (but not complete) structural amorphization (Fig. S9). While most of the re- flections (especially the intense (001) and (002) ones) gradually weak- ened with increasing grinding time, the merger of the (020), (110) and (111) reflections reflects the formation of highly disordered, Fig. 4.The dissolution of pre-milled Kaol1 followed by the precipitation of DSP: the variation of the dissolved Si concentration (expressed in terms of [SiO2]T in g/L) as a function of time. Pre-milling times are shown in the graph. Experimental conditions: [NaOH]T =4.5 M, [Al(III)]T =1.9 M, [Na2SO4]T =0.05 M, [Na2CO3]T = 0.20 M, added kaolinite: 23 g/L, T =95 ±0.5 ◦C.
Table 2
Various physico-chemical parameters of the mechanically treated Kaol1.
Duration of
milling (min) Average crystallite
sizes1 (nm) Specific surface
area2 (m2/g) Total pore volume3
(cm3/g) Band gap4
(eV) Predomi- nant hydro- dynamic diameter5 (nm)
Acidity6 (mmol
NH3/g) 1st mass loss7 (%) 2nd
mass loss8 (%)
0 29 15.6 ±0.8 0.053 ±0.008 4.13 570 0.013 ±0.002 1.4 15.3
5 27 24.5 ±1.5 0.058 ±0.006 4.05 450 0.031 ±0.007 1.9 14.8
15 23 34.4 ±3.6 0.077 ±0.012 3.95 860, 1250 0.090 ±0.011 1.7 12.2
30 14 31.7 ±2.1 0.059 ±0.011 3.83 760, 900 0.102 ±0.018 4.5 11.2
60 9 12.2 ±0.6 0.026 ±0.006 3.82 600 0.056 ±0.007 7.2 7.7
1Calculated on the basis of the Scherrer equation.
2Obtained from the BET absorption isotherms.
3Calculated by using the BJH method for the desorption branches.
4Calculated from the diffuse reflectance spectra (DRS) of the samples.
5Obtained from dynamic light scattering (DLS).
6Obtained from temperature programmed NH3 desorption (TPD).
7Corresponding to the departure of physisorbed water at ca. 100 ◦C.
8Corresponding to the departure of structural water at ca. 500 ◦C.
mechanochemically amorphized kaolinite particles with XRD patterns similar to that of metakaolinite (anhydrous form of the kaolinite) phase (Balczar et al., 2016). The presence of the largely intact quartz particles is also detectable. As a result of the previously mentioned merging ef- fect, the Hinckley indices of the solids thus obtained could not be calculated. However, the calculated average crystallite sizes (Table 2), as it was expected, systematically decreased with the milling time.
The SEM images also attest the structural disordering of raw kao- linites as a result of milling (Fig. 5). The plate-like morphology completely disappeared after 60 min milling, only fragmented amor- phous features (between 200 and 800 nm diameter) without any specific morphological pattern could be observed. The DSP solids showed the well-defined ball of yarn-type lepispherical structures (Pahlevi et al.,
2018) even after the mechanochemical treatments. The enhanced dissolution rates could result in the higher number of nuclei and, as a result, the formation of DSP particles with smaller sizes (these are 600–2000 nm from unmilled raw kaolinite, 400–1000 nm from raw kaolinite milled for 60 min).
The FT-IR spectra of the solids confirmed the partial dehydration of the raw kaolinites and presumably the formation of some metakaolinite particles or a phase similar to metakaolinite (Fig. S10). With increasing grinding times, the bands of the internal and external (Al − OH) stretching vibrations at 3690 and 3620 cm−1 disappeared, while the adsorption bands of Si − O bonds (1115, 1040 and 1005 cm−1) and the deformation mode of (Al − OH) (940 and 910 cm−1) were shifted and gradually weakened. Under 800 cm−1, the lattice vibrations showed Fig. 5. SEM images of the raw (unmilled) Kaol1 (A); Kaol1 milled for 60 min (B); DSP obtained at the end of the dissolution test starting from unmilled Kaol1 (C, C1) and from Kaol1 milled for 60 min (D, D1).
slight changes verifying only marginal deformations of the internal framework of the raw kaolinites.
As can be expected, the specific surface area values also increased with the milling time, because the solids disintegrated into smaller particles (Table 2), and the isotherms showed widening hysteresis loops at higher P/P0 regions indicating that the shape of pores were modified (Fig. S11). Although, when the raw kaolinites were milled for more than 15 min, the aggregation and/or the cold-welding tendency of the par- ticles became predominant, the specific surface area and the total pore volume decreased (Juhasz, 1980). The change of the hydrodynamic diameter was similar, the largest sizes were measured after 15 and 30 min mechanochemical treatment (Table 2). On the other hand, the milling resulted in wider intensity-weighed size distribution curves, i.e., higher polydispersity indices and fragmented particles with <300 nm hydrodynamic radii were also observed (Fig. S12).
The diffuse reflectance spectra (DRS) for the solids are shown in Fig. S13 and are plotted as the Schuster-Kubelka-Munk function. Under 400 nm, the merged peaks around 250 and 320 nm can be ascribed to the O2− → Al3+and O2− → Si4+charge transfer transitions, respectively (Scheinost et al., 1999; Visinescu et al., 2013). By increasing the grinding times, these bands gradually strengthened, presumably due to the dehydroxylation of the Al − OH moieties. After 1-h milling, the visible d − d transition of the Fe3+ions (originated from the iron oxide, iron hydroxide contaminations) could be clearly observed around 460 nm in every milled kaolinite sample (not shown) (Townsend et al., 2011). The band gap values shown in Table 2 decreased with the milling time, which confirms that the mechanochemical treatment results in significant disordering in the structure of raw kaolinites (Vasile et al., 2012; Pietzsch et al., 2015).
The thermogravimetric analysis provides with quantitative (or at least semi-quantitative) data (Table 2) about the mechanochemically induced dehydration/dehydroxylation process (Fig. S14). The mass loss due to the departure of the physisorbed water (and presumably some of them were coordinated to the active sites of the surface) increases, while that of the removal of structural hydroxyl groups decreases progres- sively with increasing milling times. The sum of the two mass losses were largely constant indicating that the released structural water remained in the samples like surface adsorbed/coordinated water.
Similar observation was made by Horvath et al. (2003) and Hamzaoui et al. (2015) using planetary ball mills.
The NH3 − TPD profiles of the milled kaolinite samples attested that on increasing milling time the amount of the desorbed NH3 molecules increased. The shift of temperature in the maxima from 200 to 165 ◦C is most probably associated with the weakening of the strength of binding
to the Lewis acid sites (Fig. S6). The acidity was found to grow with the milling time up to 30 min, then it decreased, in parallel with the specific surface area, pore volume and hydrodynamic diameter (Table 2).
Similarly to the observation made for the raw kaolinites from different sources, the acid character of the samples seems to be a key factor (or at least one of them) in explaining their dissolution behavior in spent liquor.
3.4. Mechanochemical treatment of raw kaolinites from various sources The dissolution behavior of the Kaol1 solid proved to depend strongly on the duration of the pre-milling. Therefore, the effect of the mechanochemical treatment on the dissolution kinetics was also inves- tigated for the rest of raw kaolinite samples. All solids were milled for 60 min. As a result, the “source-dependent” kinetics of dissolution (Fig. 1) disappeared, and all the samples practically instantaneously were dis- solved in the spent liquor. Compared to the dissolution of the unmilled solids, the measured maxima of dissolved silica concentrations also increased (Fig. 6).
The XRD patterns of the milled samples (Fig. S15) attested significant amorphization as well as decrease in the average crystallite sizes (Table S3). The milling process did not result in iron contamination stemming from the stainless steel grinding bodies, the chemical composition of the milled samples were similar to the initial solids respecting only the observed slightly decreased mass loss until 1000 ◦C (Table S1). The composition of the DSP solids showed largely unchanged Fe2O3, MgO, CaO and TiO2 contents indicating their inertia in the dissolution process, only the amounts of the potassium oxide showed some decrease (Table S4). However, the XRD measurements (Fig. 2.) clearly displayed the presence of the muscovite phase in the DSP solids;
presumably, a part of them may have dissolve in the alkaline environ- ment and were washed out from the obtained powders. The band gap values obtained from the DRS measurements become also smaller than those of the unmilled samples (Table S3), indicating indirectly the for- mation of the disorders and defects in the particles (Vasile et al., 2012;
Pietzsch et al., 2015). As possible indirect evidence for proving the metakaolinite formation, the XRD patterns of the DSP solids taken after 5 min and 30 min dissolution were recorded. Instead of the formation of the zeolite LTA (evolving from the metakaolinite particles (Peng et al., 2018)) the reflections of the sodalites were registered, indicating a sig- nificant difference between the dissolution of the metakaolinite particles formed by thermal treatments and the mechanochemically highly amorphized kaolinite particles. However, the most remarkable change caused by milling was found in the acidity of the kaolinite solids. The Fig. 6. The dissolution of mechanochemically treated kaolinites followed by the precipitation of DSP: the variation of the dissolved Si concentration (expressed in terms of [SiO2]T in g/L) as a function of time for raw kaolinites obtained from various sources pre-milled before the kinetic tests for 60 min. Experimental conditions:
[NaOH]T =4.5 M, [Al(III)]T =1.9 M, [Na2SO4]T =0.05 M, [Na2CO3]T =0.20 M, added kaolinite: 23 g/L, T =95 ±0.5 ◦C.
amount of desorbed NH3 was found to vary over a wide range (from 0.004 to 0.013 mmol/g, see Table 1) for the unmilled raw kaolinites.
Upon milling, these values increased significantly for all specimens, and were found to fall between 0.055 and 0.066 mmol/g (Fig. S7 and Table S3). These observations further confirmed that milling resulted in an increase in the amount of the Lewis acid centers of raw kaolinites and that this parameter plays an important role in the dissolution of kao- linites in industrial spent liquor.
4. Conclusions
Raw kaolinites from different sources were studied in terms of the materials properties, which may be responsible for the differences in dissolution kinetics observed in highly alkaline environment. Accord- ingly, a range of morphological, structural and textural properties were determined and compared for these solids, with the aim of finding correlation between them and the kaolinites’ dissolution behavior. It can be concluded that one single property could not describe the kinetic differences observed. However, it is suggested, that an interplay be- tween the textural parameters (specific surface area, total pore volume) and the acidity properties (number of the Lewis acid centers) exerted the most significant influence. The picture is further modulated by the ag- gregation of the primary particles.
The mechanochemical treatment of the raw kaolinites prior to dissolution was found to significantly modify the dissolution kinetics.
Pre-milling for various durations resulted in the formation of mecha- nochemically amorphized and partially a phase similar to metakaolinite with a progressive increase in Lewis acidity. It is suggested that the change in these two parameters led to faster dissolution of the kaolinite phase as well as the shift of the trigger point. Moreover, the intense milling proved to be suitable to make the kinetic behavior of raw kaolinite dissolution uniform, that is, independent of the source of them.
Declaration of Competing Interest
The authors declare that they have no known competing financial interests or personal relationships that could have appeared to influence the work re- ported in this paper.
Acknowledgement
The authors are grateful to Mikl´os Cs´ati for accurately performing the ICP-OES measurements, to Phil Fawell and Michael Davis for helping us to access to a standard ECKALITE 1 sample, and to L´aszl´o Nagy for donating the non-commercial kaolinite samples. The authors thank to Ilona Halasi for her technical assistance. EO thanks for the support of the NTP-NFTO scholarship (NTP_NFT¨ O-19-B-0018). This work was financed ¨ partly by the National Research, Development and Innovation Office (Hungary, Grant No. NKFIH 124265) and partly by Emirates Global Aluminium, Abu Dhabi, United Arab Emirates.
Appendix A. Supplementary data
Supplementary data to this article can be found online at https://doi.
org/10.1016/j.clay.2021.105994.
References
Aglietti, E.F., Porto Lopez, J.M., Pereira, E., 1986. Mechanochemical effects in kaolinite grinding. I. Textural and physicochemical aspects. Int. J. Miner. Process. 16, 125–133.
Al Sawalha, M., Roessner, F., Novikova, L., Bel’chinskaya, L., 2011. Acidity of different Jordanian Clays characterized by TPD-NH3 and MBOH Conversion. Int. J. Chem.
Mol. Nuc. Mat. Metal. Eng. 5, 570–574.
Albach, B., Vianna dos Santos, P.H., da Silveira Rampon, D., Barbosa, R.V., 2019. An evaluation of modified Kaolinite surface on the crystalline and mechanical behaviour of polypropylene. Polym. Test. 75, 237–245.
Aldabsheh, I., Khoury, H., Wastiels, J., Rahier, H., 2015. Dissolution behaviour of Jordanian clay-rich materials in alkaline solutions for alkali activation purpose. Part I. Appl. Clay Sci. 115, 238–247.
Awad, M.E., Lopez-Galindo, A., Sanchez-Espejo, R., Sainz-Diaz, C.I., El-Rahmany, M.M., Viseras, C., 2018. Crystallite size as a function of kaolinite structural order-disorder and kaolin chemical variability: Sedimentological implication. Appl. Clay Sci. 162, 261–267.
Balaz, P., 2008. Mechanochemistry in Nanoscience and Minerals Engineering. Springer, Berlin.
Balczar, I., Korim, T., Kovacs, A., Mako, E., 2016. Mechanochemical and thermal activation of kaolin for manufacturing geopolymer mortars – Comparative study.
Ceram. Int. 42, 15367–15375.
Barnes, M.C., Addai-Mensah, J., Gerson, A.R., 1999. The kinetics of desilication of synthetic spent Bayer liquor and sodalite crystal growth. Colloids Surf. A Physicochem. Eng. Asp. 147, 283–295.
Belver, C., Munoz, M.A.B., Vicente, M.A., 2002. Chemical activation of a kaolinite under acid and alkaline conditions. Chem. Mater. 14, 2033–2043.
Bohor, B.F., Hughes, R.E., 1971. Scanning electron microscopy of clays and clay minerals. Clay Clay Miner. 19, 49–54.
Carroll, S.A., Walther, J.V., 1990. Kaolinite dissolution at 25◦, 60◦, and 80◦C. Am. J. Sci.
290, 797–810.
Carroll-Webb, S.A., Walther, J.V., 1988. A surface complex reaction model for the pH- dependence of corundum and kaolinite dissolution rates. Geochim. Cosmochim. Acta 52, 2609–2623.
Chin, P.-K.F., Mills, G.L., 1991. Kinetics and mechanisms of kaolinite dissolution: effects of organic ligands. Chem. Geol. 90, 307–317.
Frost, R.L., Mako, E., Kristof, J., Horvath, E., Kloprogge, J.T., 2001. Mechanochemical treatment of kaolinite. J. Colloid Interface Sci. 239, 458–466.
Frost, R.L., Horvath, E., Mako, E., Kristof, J., 2004. Modification of low- and high-defect kaolinite surfaces: implications for kaolinite mineral processing. J. Colloid Interface Sci. 270, 337–346.
Ganor, J., Mogollon, J.L., Lasaga, A.C., 1995. The effect of pH on kaolinite dissolution rates and on activation energy. Geochim. Cosmochim. Acta 59, 1037–1052.
Gonzalez Garcia, F., Ruiz Abrio, M.T., Gonzalez Rodriguez, M., 1991. Effects of dry grinding on two kaolins of different degrees of crystallinity. Clay Miner. 26, 549–565.
Hamzaoui, R., Muslim, F., Guessasma, S., Bennabi, A., Guillin, J., 2015. Structural and thermal behaviour of proclay kaolinite using high energy ball milling process.
Powder Technol. 271, 228–237.
Horvath, E., Frost, R.L., Mako, E., Kristof, J., Cseh, T., 2003. Thermal treatment of mechanochemically activated kaolinite. Thermochim. Acta 404, 227–234.
Hubbard, C.R., Evans, E.H., Smith, D.K., 1976. The reference intensity ratio, I/Ic, for computer simulated powder patterns. J. Appl. Crystallogr. 9, 169–174.
Juhasz, Z., 1980. Mechano-chemical activation of kaolin minerals. In: Acta Minerologica- Petrographica, Supplementum Proceedings of the 10th Kaolin Symposium, pp. 121–145.
Juhasz, A.Z., 1998. Aspects of mechanochemical activation in terms of comminution theory. Colloids Surf. A Physicochem. Eng. Asp. 141, 449–462.
Juhasz, A.Z., Opoczky, L., 1990. Mechanical Activation of Minerals by Grinding, Ellis Horwood, Chichester. Akad´emiai Kiad´o, Budapest.
Kloprogge, J.T., 2019. Spectroscopic Methods in the Study of Kaolin Minerals and their Modifications. Springer, Switzerland.
Kloprogge, J.T., Wharton, D., Hickey, L., Frost, R.L., 2002. Infrared and Raman study of interlayer anions CO32−, NO3−, SO42− and ClO4− in Mg/Al-hydrotalcite. Am. Mineral.
87, 623–629.
Komadel, P., 2016. Acid activated clays: Materials in continuous demand. Appl. Clay Sci.
131, 84–99.
Kretzschmar, R., Holthoff, H., Sticher, H., 1998. Influence of pH and humic acid on coagulation kinetics of kaolinite: a dynamic light scattering study. J. Colloid Interface Sci. 202, 95–103.
Kristof, E., Juhasz, A.Z., Vassanyi, I., 1993. The effect of mechanical treatment on the crystal structure and thermal behaviour of kaolinite. Clay Clay Miner. 41, 608–612.
Kumar, S., Panda, A.K., Singh, R.K., 2013. Preparation and characterization of acids and alkali treated kaolin clay. Bull. Chem. React. Eng. Catal. 8, 61–69.
Kutus, B., Dudas, C., Peintler, G., Palinko, I., Sipos, P., 2018. Configuration-dependent complex formation between Ca(II) and sugar-carboxylate ligands in alkaline medium: Comparison of L-gulonate with D-gluconate and D-heptaguconate.
Carbohyd. Res. 460, 34–40.
Mako, E., Senkar, Z., Kristof, J., Vagvolgyi, V., 2006. Surface modification of mechanochemically activated kaolinites by selective leaching. J. Colloid Interface Sci. 294, 362–370.
Miller, J.G., Oulton, T.D., 1970. Prototropy in kaolinite during percussive grinding. Clay Clay Miner. 18, 313–323.
Okada, K., Shimai, A., Hayashi, S., Yasumori, A., 1998. Preparation of microporous silica from metakaolinite by selective leaching method. Microporous Mesoporous Mater.
21, 289–296.
Pahlevi, N.D., Guo, B., Sasaki, K., 2018. Immobilization of selenate in cancrinite using a hydrothermal method. Ceram. Int. 44, 8635–8642.
Peng, H., Vaughan, J., Vogrin, J., 2018. The effect of thermal activation of kaolinite on its dissolution and re-precipitation as zeolites in alkaline aluminate solution. Appl.
Clay Sci. 157, 189–197.
Pietzsch, A., Nisar, J., Jamstorp, E., Grasjo, J., Arhammar, C., Ahuja, R., Rubensson, J.E., 2015. Kaolinite: defect defined material properties – A soft X-ray and first principles study of the band gap. J. Electron Spectrosc. 202, 11–15.
Plancon, A., Giese, R.F., Snyder, R., 1988. The Hinckley index for kaolinites. Clay Miner.
23, 249–260.
Polzer, W.L., Hem, J.D., 1965. The dissolution of kaolinite. J. Geophys. Res. 70, 6233–6240.
Rescic, S., Plescia, P., Cossari, P., Tempesta, E., Capitani, D., Proietti, N., Fratini, F., Mecchi, A.M., 2011. Mechano-chemical activation: an ecological safety process in the production of materials to stone conservation. Procedia Ing. 21, 1061–1071.
Roach, G.I.D., White, A.J., 1988. Dissolution kinetics of kaolin in caustic liquors. Light Met. 1, 41–47.
Ruys, A., 2019. Alumina Ceramics. Elsevier, Woodhead Publishing Series in Biomaterials, pp. 2–21.
Sanchez-Soto, P.J., Jimenez de Haro, M.C., Perez-Maqueda, L.A., Varona, I., Perez- Rodriguez, J.L., 2000. Effects of dry grinding on the structural changes of kaolinite powders. J. Am. Ceram. Soc. 83, 1649–1657.
Scheinost, A.C., Ford, R.G., Sparks, D.L., 1999. The role of Al in the formation of secondary Ni precipitates on pyrophyllite, gibbsite, talc, and amorphous silica: A DRS study. Geochim. Cosmochim. Acta 63, 3193–3203.
Sidrak, Y.L., 2001. Dynamic simulation and control of the bayer process. a review. Ind.
Eng. Chem. Res. 40, 1146–1156.
Sing, K.S.W., Everett, D.H., Haul, R.A.W., Moscou, L., Pierotti, R.A., Rouquerol, J., Siemieniewska, T., 1985. Reporting physisorption data for gas/solid systems. Pure Appl. Chem. 57, 603–619.
Singh, B., Gilkes, R.J., 1992. Properties of soil kaolinites from South-Western Australia.
J. Soil Sci. 43, 645–667.
Tang, A., Su, L., Li, C., Wei, W., 2010. Effect of mechanical activation on acid-leaching of kaolin residue. Appl. Clay Sci. 48, 296–299.
Temuujin, J., Burmaa, G., Amgalan, J., Okada, K., Jadambaa, T.S., MacKenzie, K.J.D., 2001. Preparation of porous silica from mechanically activated kaolinite. J. Porous.
Mater. 8, 233–238.
Townsend, T.K., Sabio, E.M., Browning, N.D., Osterloh, F.E., 2011. Photocatalytic water oxidation with suspended alpha-Fe2O3 particles - effects of nanoscaling. Energy Environ. Sci. 4, 4270–4275.
Vaiciukyniene, D., Baltakys, K., Kantautas, A., 2009. Hydrosodalite ion exchange in saturated Ca(OH)2 solution. Mater. Sci-Poland. 27, 417–426.
Valaskova, M., Barabaszova, K., Hundakova, M., Ritz, M., Plevova, E., 2011. Effects of brief milling and acid treatment on two ordered and disordered kaolinite structures.
Appl. Clay Sci. 54, 70–76.
Vasile, O.R., Andronescu, E., Ghitulica, C., Vasile, B.S., Oprea, O., Vasile, E., Trusca, R., 2012. Synthesis and characterization of nanostructured zinc oxide particles synthesized by the pyrosol method. J. Nanopart. Res. 14, 1269.
Visinescu, D., Papa, F., Ianculescu, A.C., Balint, I., Carp, O., 2013. Nickel-doped zinc aluminate oxides: starch-assisted synthesis, structural, optical properties, and their catalytic activity in oxidative coupling of methane. J. Nanopart. Res. 15, 1456.
Vogrin, J., Santini, T., Peng, H., Vaughan, J., 2020. The anion effect on sodium aluminosilicates formed under Bayer process digestion conditions. Hydrometallurgy 192, 105236.
Xie, Z., Walther, J.V., 1992. Incongruent dissolution and surface area of kaolinite.
Geochim. Cosmochim. Acta 56, 3357–3363.
Zbik, M., Smart, R.S.C., 1998. Nanomorphology of kaolinites: comparative SEM and AFM studies. Clay Clay Miner. 46, 153–160.
Zhang, X., Liu, H., Xing, H., Wang, G., Deng, H., Hu, H., Li, X., Yao, H., 2019. Correlation between the sodium adsorption capacity and the thermal behaviour of modified kaolinite during the combustion of Zhundong coal. Fuel 237, 170–177.
Zhu, P., Zeng, W., Xu, X., et al., 2014. Influence of acid leaching and calcination on iron removal of coal kaolin. Int. J. Miner. Metall. Mater. 21, 317–325.
![Fig. 1. The dissolution of raw kaolinites from different sources followed by the precipitation of DSP: the variation of the dissolved Si concentration (expressed in terms of [SiO 2 ] T in g/L) as a function of time](https://thumb-eu.123doks.com/thumbv2/9dokorg/966981.57454/3.892.465.836.85.341/dissolution-kaolinites-different-precipitation-variation-dissolved-concentration-expressed.webp)