The kinetics of the precipitation of gypsum, CaSO
4·2H
2O, over a wide range of reactant concentrations
Sz. Ziegenheim1 · G. Peintler2 · I. Pálinkó3 · P. Sipos1
Received: 5 June 2020 / Accepted: 13 August 2020 / Published online: 3 September 2020
© Akadémiai Kiadó, Budapest, Hungary 2020
Abstract
In this work, the precipitation kinetics of gypsum was studied over a wide range of degree of supersaturation at 25 °C in the reaction Na2SO4(aq)+CaCl2(aq)+2 H2O→2 NaCl(aq)+CaSO4⋅2 H2O(S) with the aim of constructing a comprehensive kinetic model for CaSO4·2H2O(s) formation that is valid from the lowest (0.04 M) to the highest (0.20 M) feasible initial reactant con- centration. To monitor the variation of reactant concentrations during the precipita- tion reaction, conductometry was employed. For reasonably slow reactions (where the establishment of the equilibrium potential on the indicator electrode was pos- sible), the measurements were supplemented by a Ca-ion-selective electrode. The structure and morphology of the precipitating solids was characterized by XRD and SEM. The induction period was found to decrease about two orders of magnitude with the increasing reactant concentration. It was experimentally established that the influence of the so-called wall effect is of secondary importance. Using the data col- lected, a kinetic model have been suggested that can describe the entire precipitation process of gypsum simultaneously, incorporating nucleation and crystal growth, in a wide concentration range. Our calculations strongly suggest that the inclusion of the CaSO4(aq) ion pair is necessary for the appropriate kinetic description of gypsum precipitation.
Keywords Gypsum · Kinetics · Precipitation · Nucleation · Crystal growth
* P. Sipos
sipos@chem.u-szeged.hu
1 Department of Inorganic and Analytical Chemistry, University of Szeged, Dóm tér 7, Szeged 6720, Hungary
2 Department of Physical Chemistry and Material Sciences, University of Szeged, Rerrich B. tér 1, Szeged 6720, Hungary
3 Department of Organic Chemistry, University of Szeged, Dóm tér 8, Szeged 6720, Hungary
Introduction
The precipitation of sparingly soluble solids from supersaturated solutions is a common phenomenon in nature and is also present in a range of industrial pro- cesses [1–3]. In several instances, it is necessary to control or inhibit such precip- itation processes, for various reasons. For example, precipitates may be undesired side products e.g. during phosphonic acid production [4]; they may clog pipes thus significantly reducing the available surfaces for heat exchange or decreas- ing pipe diameters [5, 6]; to end up with a well-determined average particle size of the crystals during, e.g., the processing of cane sugar, both the nucleation and growth are needed to be rigorously controlled [7], etc. Of the precipitates, cal- cium sulfate – crystallizing mainly in the form of gypsum, calcium sulfate dihy- drate (CaSO4·2H2O) – is one of the most common representatives, which is pre- sent (or may form) in a large variety of natural and industrial processes, such as acidic wastewater treatment [3], phosphonic acid production [4], wet flue gas desulfurization [8], reverse osmosis and desalination processes [9, 10]. Therefore, the crystallization of gypsum have been the subject of a relatively large number of research endeavors.
Research commenced on the properties of gypsum precipitations in the middle of the twentieth century. The first studies were focused on the inhibition of the crystallization, testing additive compounds that can effectively slow nucleation and growth [11, 12]. Investigating the effect of various inhibitors and reaction conditions is a popular topic even today [13–18]. However, to fully understand the mechanisms of the crystallization of gypsum in presence of various inhibi- tors, the crystallization kinetics from pure (inhibitor-free) solutions is needed to be understood and described.
To characterize the crystallization of a solid, both the nucleation and the crys- tal growth is necessary to be studied. Crystal growth can be investigated sepa- rately in seeded reaction, because the seeds can provide sufficiently large growth surface, this way the effect of secondary nucleation can be mostly neglected [19].
In most of the early studies [19–24], the experiments were carried out this way to gain a solid basis for later investigations of the effect of additives on the crystal growth of gypsum. In the early 70 s, Nancollas studied this phenomenon in a series of experiments at different temperatures to determine the growth mecha- nism and the phase transition to other hydrates of calcium sulfate [19, 20]. Later a series of studies were carried out by van Rosmalen, Christoffersen and others, in which they studied the effect of other ions present (like Na+ and Cl−) and the influence of the source and preparation of the seeds employed, in an attempt to determine and specify the growth mechanism and growth affinity of gypsum [21–24]. All these studies were carried out at relatively low levels of supersatura- tion, and the reactions were monitored either by individual sampling or by using conductometric measurements in situ. Witkamp et al. studied the kinetics of the precipitation at higher supersaturation in different solutions, and stated that the level of supersaturation can affect the order of the growth kinetics [25]. De Meer et al. published a summary of the results collected until 2000, and compared them
to their own ones [26]. Reznik et al. also carried out experiments in seeded solu- tions, but used high ionic strength. They stated that the crystal growth follows second order kinetics, similarly to the conclusions drawn from the studies carried out at lower ionic strength [27, 28].
Studying the growth of gypsum crystals in highly supersaturated solutions is inherently complicated. Due to the instability of the initial solutions, appropriately controlled seeding is not possible. Therefore, solutions that are highly supersatu- rated with respect to gypsum have to be studied in terms of spontaneous nucleation.
A way to circumvent this phenomenon is to dissolve calcium sulfate hemihydrate (CaSO4·1/2H2O), which is more soluble than the dihydarte, and can initiate the gyp- sum precipitation instantly, as its surface provides a good nucleation and growth site for gypsum [29, 30]. However, during these experiments the dissolution and precipi- tation processes overlap, presenting another difficulty.
Klepetsanis et al. studied the spontaneous precipitation of gypsum at moderate supersaturations with conductometric measurements, sustaining the ionic strength of the suspension via in situ titration, and with potentiometric measurements keeping the calcium activity constant [31, 32]. Following these works, the induction time of gypsum precipitation was studied in several instances. Experiments were carried out in different concentration ranges [33], looking at the effect of temperature [34, 35], and the influence of other salts being present, such as NaCl, CaCl2 or MgCl2 [34, 36, 37]. Among the commonly used turbidity and conductometric measurements, some unusual techniques (like quartz crystal microbalance) were used to experimentally determine the length of the induction period [38].
As the crystallization of gypsum can become a source of major technological problems during certain industrial processes, the precipitation process was studied in some simulated processes too. To characterize scaling in heat-exchangers, the crystallization of gypsum on relevant surfaces was studied by Linnikov [39, 40].
Uncontrolled gypsum precipitation can also cause hardships during reverse osmosis processes; this issue was also addressed in the literature [9, 41, 42]. Gypsum pre- cipitation as a side-product during the neutralization of some wastewaters was also investigated [3, 43]. From these examples, one may conclude that the precipitation kinetics of gypsum is still of importance today.
In spite of the considerable number of works devoted to the description of the precipitation of gypsum, a comprehensive kinetic model that could describe the whole reaction well in a sufficiently wide concentration range is still not available.
Therefore, we embarked on a project to study the process of gypsum precipitation in a wide concentration range using different experimental techniques (conductom- etry, Ca-ion-selective electrode (Ca-ISE) potentiometry and intermittent sampling followed by ICP-OES) simultaneously to monitor the variation of the reactant con- centrations during the precipitation reaction. Attempts were made to check the reli- ability of the various methods. The structure and morphology of the gypsum pre- cipitates were also investigated. Given reactions were tested in different reactors to establish the extent of the “wall-effect”. Finally, from the entire data set obtained, an attempt was made to suggest a kinetic model, which can satisfactorily describe the whole crystallization process, including nucleation and crystal growth, in a wide concentration range that is a broad range of supersaturation levels.
Experimental set‑up
For conductivity measurements, the conductivity meter of a Jenway 3540 pH and conductivity meter was used, equipped with a Jenway 027013 conductivity cell.
For potentiometric measurements, a Metrohm 794 Basic Titrino with a Metrohm combined polymer membrane Ca-ion-selective electrode was used.
ICP-OES measurements were carried out with a Thermo Scientific iCAP 7400 ICP-OES DUO spectrometer.
X-ray diffractograms were measured using Rigaku MiniFlex II type Röntgen diffractometer.
SEM images were captured with a Hitachi S-4700 scanning electron microscope.
The graphs in this article were made with the Origin data analysis and graphical software.
Experimental procedure
To investigate the precipitation kinetics of the formation of Ca2SO4·2H2O (gypsum) the following reaction was carried out:
Solutions of 50 cm3 volume, containing equivalent amounts of reactants were prepared separately and poured together to initiate the reactions. The initial con- centration of the reactants was varied systematically between 0.04 M to 0.2 M to study the reaction in a relatively wide concentration range. The reactions were car- ried out in a spherical PTFE vessel to have a reactor with smooth surface. All of the reactions were carried out in a vessel thermostated to 25.0 °C. The initial solutions were prepared from analytical grade solids (products of VWR), which were kept at 100 °C for 12 h to ensure the exclusion of any crystal water and thus, enabling their exact weight measurements.
Because the strict control of the reaction conditions is needed to achieve good repeatability [44], efforts were made to keep all the parameters that may affect kinet- ics at constant values. Every reaction was carried out in the same vessel. The reac- tion mixtures were agitated with an adjustable speed magnetic stirrer; the agitation rate was set to 300 rpm, and the same magnetic stirrer bar was used in every case.
The measuring electrodes were always placed to the same position to minimize the variations occurring in the hydrodynamics of the reactions.
The reactions were followed simultaneously by conductometric measurements and potentiometry with a Ca-ISE. To check the reliability of these measurement methods on the concentration range studied, ICP-OES measurements were also car- ried out. For this, at given times samples were withdrawn from the reactions, they were quickly filtered (one filtration procedure took ca. 5–10 s) with using a 0.45 μm syringe filter and diluted 100-fold with distilled water. During dilution, yttrium inner standard was also added for the more precise quantitative analysis.
Na2SO4(aq)+CaCl2(aq)+2 H2O→2 NaCl(aq)+CaSO4⋅2 H2O(S)
To check if the so-called wall-effect has any influence on our reactions, a selected reaction was carried out in a smooth surface glass beaker, and also in a heavily scratched one. Both had a shape similar to that of the PTFE reactor used earlier, which ensured the practically constant hydrodynamics in the system.
After the completion of the reactions, the mixture was vacuum filtered (filtering paper with 0.45 µm pore diameter), the solids were dried at 60 °C for 12 h, while the Ca2+ content of the supernatant was measured by complexometric titration with EDTA. This way the final [Ca2+] after the reactions (i.e., saturation concentra- tions) were determined, which was necessary for the comparison of the measuring techniques.
The dried solids were studied by X-ray diffractometry (XRD), to determine the structure of the precipitated solid. The morphology of them were also studied by scanning electron microscopy (SEM).
Finally, we suggested a kinetic model that can describe the whole reaction, nucle- ation and crystal growth simultaneously, on a wide concentration range. For the cal- culations and fitting we used the ChemMech program package [45].
Results and discussion
Concentration effect on the reaction kinetics, monitored by conductometry and Ca‑ISE
The conductivity of the reaction mixtures with various [CaCl2]init. and [Na2SO4]init.
as a function of time are shown in Fig. 1. For better comparison, the conductivities
0 20 40 60 80
0.04M 0.05M 0.06M
t (min)
Conductivity (a. u.) 0.07M 0.08M
0.09M 0.1M 0.2M [CaCl2]init. = [Na2SO4]init.
Fig. 1 Variation of the conductivity as a function of time during the stoichiometric reaction between CaCl2 and Na2SO4 in the range of 0.04–0.2 M initial reactant concentration, without any added NaCl. Y axis scale was normalized for the better visualization
obtained for these reactions were normalized. A variable length induction period is uniformly followed by a drop in the conductivity, due to the gradual depletion of the precipitating ions from the system. Upon completion of the reaction, the conductiv- ity levels off, due to the (constant) background conductivity contribution of Na+ and Cl− ions and those of the Ca2+ and SO42− ions the concentration of which is set by the actual value of the solubility product of gypsum.
As can be seen, the initial reactant concentration has a profound impact on the reaction rate of precipitation. At the smallest initial reactant concentration, the pre- cipitation commenced after ca. 40 min, while only a few seconds were required at the highest one: a fivefold increase in the reactant concentration resulted in about two orders of magnitude decrease in the induction period.
Besides the well-established conductometry, attempts were made to monitor the kinetics of the precipitation reactions by in situ direct potentiometric measurements with a Ca-ISE, that is, by following the variation of the concentration of the unre- acted calcium. Note that Ca-ISE is seldom used in the literature for such purpose.
In the only example we are aware of, Ca-ISE was used to check constant Ca2+- ion activity during titration [31, 32]. Both measuring methods have their inherent limitations. In conductometry, the measured signal changes instantaneously with the changing solution composition, but in systems with high ionic strength – such as seawater – the experimental effect caused by the precipitation reaction can be masked by the conductivity of the background electrolyte. The response of a Ca-ISE is far from being instantaneous, however, it works best exactly in those conditions where conductometry fails, that is, under high and constant ionic strength solutions, where effects, like liquid junction potential variations are minimized.
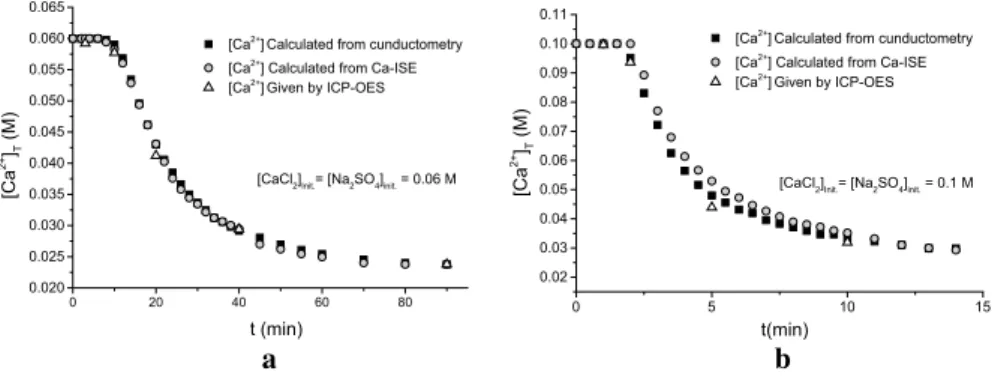
The use of conductometry and Ca-ISE for direct monitoring of the precipitation of gypsum have been studied: the results from both in situ methods were compared with each other and with that of the results of ICP-OES measurements. For the lat- ter, samples were withdrawn from the reaction mixtures, quickly filtered and then diluted. The result of this comparison is shown in Fig. 2. From the conductivity data, the difference between the initial and final (equilibrium) conductivity was taken and
0 20 40 60 80
0.020 0.025 0.030 0.035 0.040 0.045 0.050 0.055 0.060 0.065
[CaCl2]Init.= [Na2SO4]init. = 0.06 M [Ca2+] Calculated from cunductometry [Ca2+] Calculated from Ca-ISE [Ca2+] Given by ICP-OES
[Ca2+]T (M)
t (min) 0 5 10 15
0.02 0.03 0.04 0.05 0.06 0.07 0.08 0.09 0.10 0.11
[CaCl2]Init.= [Na2SO4]init. = 0.1 M [Ca2+] Calculated from cunductometry [Ca2+] Calculated from Ca-ISE [Ca2+] Given by ICP-OES
[Ca2+]T (M)
t(min)
a b
Fig. 2 Comparison of the in situ conductometric and Ca-ISE methods and the intermittent sampling methods for monitoring the gypsum precipitation in case of a initial reactant concentrations are 0.06 M and b initial reactant concentrations are 0.1 M
[Ca2+] was calculated assuming linear relationship between the conductivity and calcium concentration. Likewise, the cell potential (or electromotive force, emf) val- ues of the cell containing the Ca-ISE were also transformed to [Ca2+] with assuming linear variation of the cell potential with the calcium concentration.
It can be seen that during the precipitation reaction shown in Fig. 2a, the [Ca2+] values obtained are within experimental error superimposable with each other and with those of the ICP-OES measurements. In such “slow” system the two in situ measuring methods can be employed simultaneously. However, in the “fast” reaction region (for example, Fig. 2/b), the Ca-ISE seemingly legs behind conductometry as well as ICP-OES. In the fastest period of the reaction shown in Fig. 2, the [Ca2+] obtained from Ca-ISE are more than 10% higher, than those obtained from conduc- tometry and ICP-OES.
This led us to conclude that direct potentiometry with Ca-ISE can be a viable measuring method only in slower reactions and at high and constant ionic strength solutions and is being used in the study of other related precipitating systems [46].
For the current study, in the wide concentration range what we aimed at, conduc- tometry proved to be the most suitable technique. Therefore, in the followings, the data obtained from the conductometric measurements were used for data processing.
Characterization of the precipitate
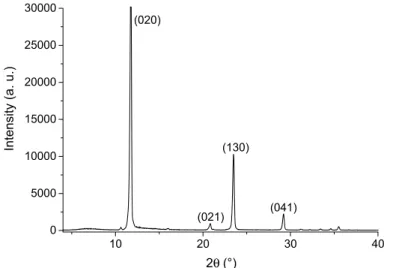
After the reactions reached their equilibrium, the precipitated solids were separated from the mother liquor. The structure of the precipitates was studied by XRD meas- urements, to determine the composition of the solids. A typical diffractogram of the solids is shown on Fig. 3. These diffractograms show that the only solid precipitat- ing from our reactions was CaSO4·2H2O (gypsum). The Miller indices of the typi- cal main reflections are given in the figure, they were identified using the JCPDS
10 20 30 40
0 5000 10000 15000 20000 25000 30000
Intensity (a. u.)
2θ (°) (021) (020)
(041) (130)
Fig. 3 A typical XRD trace of the precipitated and dried solid, CaSO4.2H2O peaks identified using the JCPDS database (# 21-0816)
database (# 21-0816). Comparing the diffractograms obtained from solutions with various initial concentrations, the products were found to be practically identical in terms of their XRD traces.
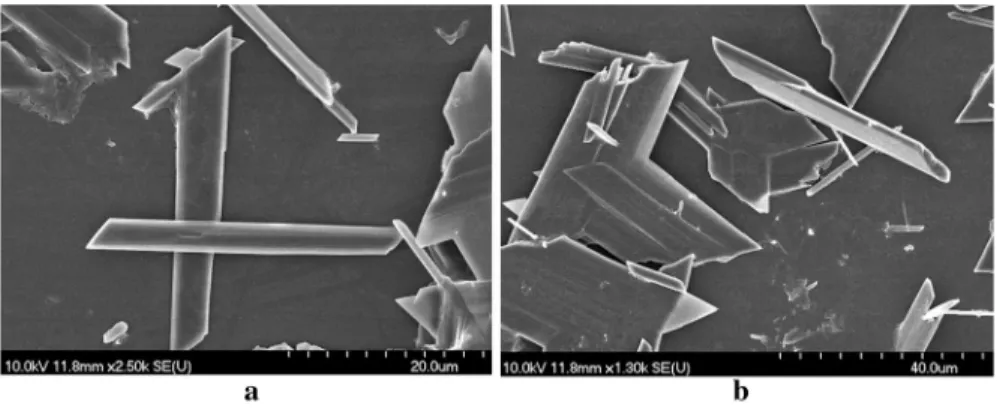
To study the morphology of these compounds, SEM images of the precipitates were also recorded, some examples are shown on Fig. 4.
Based on the comparison of the SEM images of the precipitates, the morphology of the products was also found to be practically independent of the initial reactant concentrations: in every reaction the gypsum precipitated in well developed, rod- like crystals (here, two examples are shown). As we can see from both images, the size of the crystals was variable even within one sample, and they often were broken which is most probably associated with the severe stirring of the reaction mixture.
The variable size of the individual crystals was also associated with the variable crystallization time (ageing), ultimately resulting in polydispersed specimens.
The kinetic model of gypsum precipitation
After the measurements, an attempt was made to construct a kinetic model that could describe the reaction well in the entire measured concentration range. To test our models, the observed primary kinetic curves (shown in Fig. 1) were fitted both individually, and simultaneously using the ChemMech program package [45] to cal- culate the fitted curves.
In our first model, a simple heterogeneous equilibrium was supposed to form the precipitate. To start the process, the nucleation initiated by the wall effect was also taken into account. The individual curve fitting showed visually good results, the value of the rate constant(s), however, changed dramatically (four orders of magni- tude) and systematically with the increasing initial concentrations.
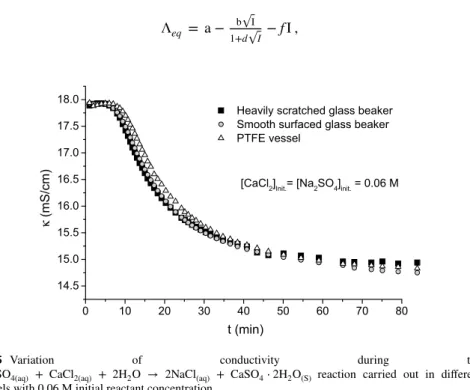
Because of this, the investigation of the influence of the wall effect became neces- sary. For this, the same reaction was carried out in three different vessels. They were the previously used smooth PTFE vessel, a new, smooth surfaced glass beaker and a heavily scratched glass beaker. The reactions with 0.06 M initial reactant concentrations
Fig. 4 SEM picture of the precipitated and dried solid from the reaction of Na2SO4(aq) + CaCl2(aq) + 2H2O → 2NaCl(aq) + CaSO4⋅2H2O(S) with equimolar initial reactant concentrations of a 0.06 M and b 0.1 M
were carried out, to have precisely measurable reaction time. The reactions were moni- tored by conductometry, the results are shown on Fig. 5.
The reaction curves on Fig. 5 are almost superimposable within experimental uncer- tainty. Therefore, the wall effect may have only little influence, if any, and at least it can be stated that the large and systematic variation of the fitted kinetic parameters cannot be explained in terms of the wall effect.
To improve the chemical model, further pieces of information had to be gathered.
Firstly, we studied the observed conductivity data in more details. In Fig. 6, the con- ductivity of the undersaturated gypsum solutions are compared with the initial and final conductivity of our reaction mixtures at various starting concentrations.
Generally, the conductivity of very diluted solutions is supposed to be linearly pro- portional with the ion-concentrations. In our concentration range, however the devia- tion from this linear relationship is too large. This is the most likely reason, why the intercept of the conductivity-concentration curves in the supersaturated concentration region have non-zero intercept (Fig. 6). There might be at least two reasons causing this deviation from linearity: (i) the significant formation electrically neutral CaSO4(aq) ion pair resulting in a decrease in the overall conductivity; (ii) the significant ionic strength dependence of the molar conductivity values.
During the calculations, the variation of the ionic strength was included into the model as ionic strength dependence of the rate constants, and also, as its effect on the equivalent conductivity of the present species, extrapolated to zero ionic strength. For the latter we used the experimental conductivity data found in the literature for aqueous solutions of NaCl, Na2SO4, KCl, K2SO4 and CaCl2 [47–53], and the data were fitted with a Davies-like equation [54]:
Λeq = a− b
√ I 1+d√
I −fI ,
0 10 20 30 40 50 60 70 80
14.5 15.0 15.5 16.0 16.5 17.0 17.5
18.0 Heavily scratched glass beaker
Smooth surfaced glass beaker PTFE vessel
κ (mS/cm)
t (min)
[CaCl2]Init.= [Na2SO4]init. = 0.06 M
Fig. 5 Variation of conductivity during the Na2SO4(aq) + CaCl2(aq) + 2H2O → 2NaCl(aq) + CaSO4⋅2H2O(S) reaction carried out in different
vessels with 0.06 M initial reactant concentration
here Λeq is the molar equivalent conductivity of the pure salt solutions. Table 1 includes the values of the constants of this equation for the individual species. In the table, the values concerning CaSO4 were calculated by the expression
Taking into account all the above considerations, the following kinetic model was obtained, which could describe the observed conductivity values properly in a wide concentration range (Eqs. 1–3):
Λeq( CaSO4)
= Λeq( CaCl2)
+ Λeq( K2SO4)
−Λeq(KCl).
0.00 0.05 0.10 0.15 0.20
0 10 20 30 40 50 60 70
Initial condutivity of the reaction mixture Final condutivity of the reaction mixture Conductivity of undersaturated gypsum solutions Linear fit of
Linear fit of Linear fit of
κ(mS/cm)
[CaSO4]init(M)
Fig. 6 Comparison of the linear fits of the conductivity of unsaturated gypsum solutions, as well as the initial and final conductivity of the measured reaction mixtures
Table 1 The fitted values of the constants found in the Davies-like equation calculated from the literature data [47–53]
The parameters belonging to CaSO4 were calculated from the others
a (Scm2M−1) b (Scm2M−1.5) d (M−0.5) f (Scm2M−2)
NaCl 126.52 ± 0.20 94.13 ± 0.36 1.772 ± 0.017 6.79 ± 0.11
Na2SO4 132.95 ± 0.33 210.5 ± 8.1 2.39 ± 0.19 5.0 ± 1.8
CaCl2 135.82 ± 0.20 157.7 ± 3.6 2.192 ± 0.089 4.85 ± 0.33
K2SO4 154.673 ± 0.083 215.0 ± 2.1 2.211 ± 0.043 1.84 ± 0.33
KCl 150.123 ± 0.043 105.83 ± 0.87 1.962 ± 0.030 5.296 ± 0.074
CaSO4 140.35 267.9 2.28 0.42
In this model, the nucleation and the crystal growth were described simultane- ously. Equation 1 describes the formation of new CaSO4,(s) from dissolved Ca2+
and SO42− ions, and the reverse reaction, i.e. its dissolution—this is the nuclea- tion step. During the simultaneous fitting, adjusting a single k1 was not enough in the final model, some of the initial time values should have been also fitted.
However, if the k1 and all initial time values are fitted together, full correlation appeared between these parameters. This correlation disappeared if either k1 or at least one of the initial time values was held constant. Consequently, trustable value cannot be given for k1, just several sets of values for k1 and the time values.
Equation 2 describes the crystal growth step. Because the crystal growth can only occur on the surface, the virtual [CaSO4,(s)] with the power of 0.67 plays a role in the reaction equation. Independently of the actual k1 value, the finally calculated k2 = (7.7 ± 2.1)⨯102 M–1.67 s–1 with the constraint of kk2
−2
=3.1×10⁻⁵ where the right side of the constraint is the solubility constant of gypsum at I = 0 M [55].
Equation 3 describes the formation and decomposition of the CaSO4,(aq) ion pair. After several dozens of calculations, it became obvious that the process is fast, and its equilibrium constant is in total correlation with the equivalent con- ductivity values. If kk3
−3 was fixed to a specific value, a little adjustment on the parameters of the Davies-like equation led to the same deviation between the measured and calculated curves.
The inclusion of a new nucleation and a crystal growth pathway was attempted using the present CaSO4,(aq), as shown in Eqs. 4 and 5.
(1) Ca2++ SO2−4
k1
⇌ k−1
CaSO4,(s)
{ r1 = k1⋅ [Ca2+]
⋅ [SO2−4 ] r−1 = k−1
(2) Ca2++ SO2−4
k2
⇌ k−2
CaSO4,(s) {
r2 = k2⋅ [Ca2+]
⋅ [SO2−4 ]
⋅
[CaSO4,(s)]0.67
r−2 = k−2⋅
[CaSO4,(s)]0,67
(3) Ca2++ SO2−4
k3
⇌ k−3
CaSO4,(aq)
{ r3 = k3⋅ [Ca2+]
⋅ [SO2−4 ] r−3 = k−3⋅
[CaSO4,(aq)]
(4) CaSO4,(aq)
k4
⇌ k−4
CaSO4,(s)
{ r4 = k4⋅
[CaSO4,(aq)] r−4 = k−4⋅
[CaSO4,(s)]
(5) CaSO4,(aq)
k5
⇌ k−5
CaSO4,(s) {
r5 = k5⋅
[CaSO4,(s)]0.67
⋅
[CaSO4,(aq)] r−5 = k−5⋅
[CaSO4,(s)]0.67
However, including these processes to the kinetic model had little to no effect on the results, suggesting that the nucleation and crystal growth are working through the individual ions forming new surfaces or extending the existing ones.
The results of the calculated (fitted) and measured data are shown on Fig. 7.
The good agreements between the observed and calculated data shows that our suggested model is capable of describing the whole precipitation process in a wide concentration range, especially if we consider the fast reaction rate at high initial reactant concentrations.
Conclusion
During this study, the kinetics of the precipitation reaction of gypsum was studied at room temperature. Experiments were carried out by mixing equimolar solutions of Na2SO4 and CaCl2, and encompassing the entire experimentally accessible con- centration range (0.04 M – 0.2 M; this range is limited in the low concentration end by the solubility of gypsum, and by the too fast and experimentally not approachable precipitation rate observed at high initial reactant concentrations). Conductometry, supplemented in some cases with Ca-ISE was used to monitor the precipitation reac- tion. The precipitated solids were studied by XRD and SEM, the only crystallized compound was CaSO4·2H2O, forming well developed, rod-like crystals.
Subsequently, a comprehensive kinetic model was developed to simultaneously describe the nucleation and crystal growth processes of gypsum over this wide con- centration range. During this work, it was demonstrated that the wall-effect exerts
0.1 1 10 100
10 15 20 25 30 35 40 45 50
κ (mS/cm)
t (min)
Fig. 7 Simultaneous fitting of the measured data with the suggested kinetic model using the ChemMech program package [31], the symbols are representing the measured data, and the lines show the fitted (Ini- tial concentration range: 0.04–0.2 M)
negligible influence on the kinetics of the precipitation reactions. Also, because of the high initial concentrations, it was found that it is necessary to include the forma- tion of the CaSO4(aq) ion pair to the kinetic model for the appropriate description of the gypsum precipitation.
Taking into consideration the variation of the ionic strength during the reaction and its effect on the equivalent conductivity we suggested a chemically accurate model that can describe the precipitation of gypsum over the wide concentration range used in the present studies.
References
1. Laurence I (1926) J Mar Biol Assoc 14:441–446
2. Change F, Yuming Z (2011) Guangqing L Jingyi H, Wei S, Wendao W. Ind Eng Chem Res 50:10393–10399
3. Deng L, Zhang Y, Chen F, Cao S, You S, Liu Y, Zhang Y (2013) Chin J Chem Eng 21:1303–1312 4. Rashad MM, Mahmoud MHH, Ibrahim IA, Abdel-Aal EA (2004) J Cryst Growth 267:372–379 5. Bansal B, Müller-Steinhagen H, Chen XD (2001) Heat Transfer Eng 22:13–25
6. Hoang TA, Ang M, Rohl AL (2011) Chem Eng Technol 34:1003–1009
7. Hugot E (2014) Handbook of cane sugar engineering, Chapter 33 Crystalization 529–546 8. Pan D, Wu H, Yang L (2017) J Environ Sci 55:303–310
9. Abdel-Aal EA, Abdel-Ghafar HM, El Anadouli BE (2015) Crys Growth Des 15:5133–5137 10. Hao Gong M (2018) CEED Seminar Proceedings 49–54
11. McCartney ER, Alexander AE (1958) J Colloid Sci 13:383–396 12. Schierholtz OJ (1958) Can J Chem 36:1057–1063
13. Rahman F (2013) Desalination 319:79–84 14. Amjad Z (2013) Desalin Water Treat 51:4709–4718 15. Amjad Z, Koutsoukos PG (2014) Desalination 335:55–63 16. Benecke J, Rozova J, Ernst M (2018) Sep Purif Technol 198:68–78
17. Rabizadeh T, Morgan DJ, Peacock CL, Benning LG (2019) Ind Eng Chem Res 58:1561–1569 18. Raharjo S, Muryanto S, Jamari J, Bayuseno AP (2016) Orient J Chem 32:3145–3154 19. Liu ST, Nancollas GH (1970) J Cryst Growth 6:281–289
20. Nancollas GH, Reddy MM, Tsai F (1973) J Cryst Growth 20:125–134
21. Brandse WP, van Rosmalen GM, Brouwer G (1977) J Inorg Nucl Chem 39:2007–2010
22. Christoffersen J, Christoffersen MR, van Rosmalen GM, Marchée WGJ (1979) J Cryst Growth 47:607–612
23. van Rosmalen GM, Daudey PJ, Marchée WGJ (1981) J Cryst Growth 52:801–811
24. Christoffersen J, Christoffersen MR, Weijnen MPC, van Rosmalen GM (1982) J Cryst Growth 58:585–595
25. Witkamp GJ, van der Eerden JP, van Rosmalen GM (1990) J Cryst Growth 102:281–289 26. De Meer S, Spiers CJ, Peach CJ (2000) J Geol Soc London 157:269–281
27. Reznik IJ, Gavrieli I, Ganor J (2009) Geochim Cosmochim Acta 73:6218–6230 28. Reznik IJ, Gavrieli I, Antler G, Ganor J (2011) Geochim Cosmochim Acta 75:2187–2199 29. Amathieu L, Boistelle R (1988) J Cryst Growth 88:183–192
30. Singh NB, Middendorf B (2007) Prog Cryst Growth Charact Mater 53:57–77 31. Klepetsanis PG, Koutsoukos PG (1991) J Coll Interf Sci 143:299–308 32. Klepetsanis PG, Koutsoukos PG (1989) J Cryst Growth 98:480–486 33. Lancia A, Musmarra D, Prisciandaro M (1999) AlChE J 45:390–397 34. He S, Oddo JE, Tomson MB (1994) J Coll Interf Sci 162:297–303 35. Klepetsanis PG, Dalas E, Koutsoukos PG (1999) Langmuir 15:1534–1540 36. Prisciandaro M, Lancia A, Musmarra D (2001) Ind Eng Chem Res 40:2335–2339 37. Ahmed SB, Tlili MM, Amami M, Amor MB (2014) Ind Eng Chem Res 53:9554–9560
38. Alimi F, Elfil H, Gadrib A (2003) Desalination 157:9–16 39. Linnikov OD (1999) Desalination 122:1–14
40. Linnikov OD (2000) Desalination 128:35–46
41. Uchymiak M, Lyster E, Glater J, Cohen Y (2008) J Membr Sci 314:163–172 42. Halevy S, Korin E, Gilron J (2013) Ind Eng Chem Res 52:14647–14657
43. Barbiera E, Costea M, Genina A, Junga D, Lemoinea C, Logettea S, Muhrb H (2009) Chem Eng Sci 64:363–369
44. Rendel PM, Gavrieli I, Wolff-Boenisch D, Ganor J (2018) J Cryst Growth 485:28–40
45. Peintler G, ZITA(1989–2012) and ChemMech (2013–2019), A Comprehensive Program Package for Fitting Parameters of Chemical Reaction Mechanisms, Versions 2.1–5.0, Department of Physical Chemistry, University of Szeged, Szeged, Hungary (1989–2019).
46. Ziegenheim Sz, Peintler G, Pálinkó I, Sipos P, in preparation 47. Shedlovsky T, Brown AS (1934) J Am Chem Soc 56:1066–1071 48. Benson GC, Gordon AR (1945) J Chem Phys 13:470–472
49. Chambers JF, Stokes JM, Stokes RH (1956) J Phys Chem 60:985–986 50. Sun I, Newman J (1970) J Chem Eng Data; LBNL Report #: UCRL-19150 51. Isono T (1984) J Chem Eng Data 29:45–52
52. McCleskey RB (2011) J Chem Eng Data 56:317–327
53. Chapman T, Newman J (1968) A compilation of selected thermodynamic and transport properties of binary electrolytes in aqueous solution, Lawrence Berkeley National Laboratory. LBNL Report #:
UCRL-17767.
54. Davies CW (1938) J Chem Soc 2093–2098
55. Lide RD (ed) (2003) Handbook of chemistry and physics, 84th edn. CRC Press, Boca Raton Publisher’s Note Springer Nature remains neutral with regard to jurisdictional claims in published maps and institutional affiliations.

![Table 1 The fitted values of the constants found in the Davies-like equation calculated from the literature data [47–53]](https://thumb-eu.123doks.com/thumbv2/9dokorg/972253.58176/10.659.76.587.729.872/table-fitted-values-constants-davies-equation-calculated-literature.webp)
![Fig. 7 Simultaneous fitting of the measured data with the suggested kinetic model using the ChemMech program package [31], the symbols are representing the measured data, and the lines show the fitted (Ini-tial concentration range: 0.04–0.2 M)](https://thumb-eu.123doks.com/thumbv2/9dokorg/972253.58176/12.659.140.544.84.371/simultaneous-fitting-measured-suggested-chemmech-representing-measured-concentration.webp)
