Hydrological Impacts of Various Land Cover Types in the Context of Climate Change for Zala County
Péter C
SÁKI*– Péter K
ALICZ– Gábor Béla B
ROLLY– Gergely C
SÓKA– Kornél C
ZIMBER– Zoltán G
RIBOVSZKIInstitute of Geomatics and Civil Engineering, University of West Hungary, Sopron, Hungary
Abstract – The water balance of Zala County was analyzed using remote-sensing based actual evapotranspiration (ETA) (Kovács 2011) and runoff (R) in the context of land cover types. The highest mean ETA rates were determined for water bodies (658 mm/year) and wetlands (622 mm/year).
Forests have higher values than agricultural areas, and the lowest rates belong to artificial surfaces.
Mean annual runoff is the largest on artificial surfaces (89 mm/year), and it decreases on the other land cover types. For climate change impact analysis a Budyko-model was used in spatially-distributed mode. The parameter of the Budyko-model (α) was calculated for pixels without surplus water. For the extra-water affected pixels a linear model with β-parameter (actual evapotranspiration / pan- evapotranspiration) was used. These parameters (α and β) can be used for evaluating future ETA and R in spatially-distributed mode. According to the predictions, the mean annual evapotranspiration may increase about 27 mm while the runoff may decrease to the one third to the present amount by end of the century.
evapotranspiration / runoff / land cover / Budyko-model / climate change
Kivonat – Különböző felszínborítások vízforgalomra gyakorolt hatása a klímaváltozással összefüggésben Zala megye példáján. Zala megye területi vízmérlegének elemzése távérzékelési adatokon alapuló aktuális evapotranszspiráció (ETA) (Kovács 2011) és lefolyás (R) alapján, a felszínborítás függvényében történt. A legmagasabb átlagos párolgásértékek a vizek (658 mm/év) és a vizenyős területek (622 mm/év) esetében jelentkeztek. Az erdők magasabb párolgással jellemezhetők, mint a mezőgazdasági területek, a legalacsonyabb értékek a mesterséges felszínekhez tartoznak. Az éves átlagos lefolyás a legnagyobb a mesterséges felszíneken (89 mm/év), és egyre kisebb a további felszínborítási kategóriák esetében. A klímaváltozás hatásának vizsgálata egy térben osztott Budyko- féle modell használatával történt. A Budyko-modell kalibrációs paramétere (α) a többletvízhatástól független pixelekre került kiszámításra. A többletvízhatású pixelek esetében egy lineáris β-paraméterű modellt (aktuális párolgás / kádpárolgás) vezettünk be. A két paraméter (α és β) segítségével becsülhető a jövőbeli ETA és R, térben osztott módon. Az előrejelzés alapján az éves átlagos aktuális párolgás 27 mm-el növekedhet, míg a lefolyás a harmadára csökkenhet a század végére.
evapotranszspiráció / lefolyás / felszínborítás / Budyko-modell / klímaváltozás
* Corresponding author: csakipeti.nyme@gmail.com; H-9400 SOPRON, Bajcsy-Zs. u. 4.
1 INTRODUCTION
More precipitation evaporates than runs off and stored together on the land surface (Hewlett 1982). Generally, in Hungary about 90% of precipitation evaporates and only 10% goes to streams, soil and groundwater storage. Evapotranspiration (ET) is a very effective vehicle for mass and energy (due to the high latent heat of vaporization value of water) transfer between the land- or vegetation surface and the ambient atmosphere (Szilágyi – Józsa 2009).
Therefore, it is essential to determine more accurately the amount of ET to increase knowledge of the energy balance and the hydrological cycle.
Obtaining spatially distributed ET estimates is crucial in most water balance calculations for identifying mass and energy fluxes across the area of interest (Szilágyi – Kovács 2011).
Monthly actual evapotranspiration (ETA) has been mapped for Hungary by Kovács (2011) over the 2000-2008 period. On an annual scale - using ETA and precipitation data - the spatially distributed runoff can be calculated using the long-term water-balance equation:
R = P − 𝐸𝑇𝐴 (1)
where P is the precipitation, ETA is the evapotranspiration and R is the runoff (each members in mm/period). The spatially distributed ETA and R maps are suitable to analyze the data in the context of land cover types (CLC 2006).
2 MATERIAL AND METHODS
2.1 Description of the ET mapping technique
Morton et al. (1985) presented an algorithm (called the WREVAP model) - based on Bouchet’s (1963) complementary relationship - for estimating regionally representative ETA rates for periods longer than 5 days. Szilágyi – Józsa (2009), Szilágyi et al. (2011) devised a method of disaggregating the regional ETA values into spatially variable ETA rates. It is based on the assumption that at a large enough scale (for example 1 km) where surface heterogeneities of a terrain become largely smoothen out, surface temperatures are proportional to the ETA rates, since evaporation is an endothermic process, providing an effective cooling (due to the high latent heat of vaporization) of the evaporating surface.
The spatial disaggregation of the regionally representative ETA rates is based on a linear transformation of the 8-day composited MODIS (Moderate Resolution Imaging Spectroradiometer) daytime surface temperature (Ts) values into ETA rates (Szilágyi – Józsa 2009). The transformation requires specifying two anchor points in the Ts – ET plane (Figure 1).
The first is defined by the spatially averaged daytime surface temperature (Ts) and the corresponding regionally representative ETA rate (from WREVAP, using spatially averaged values of the required climate variables). The second anchor point comes from a spatial average of the coldest pixel values for well-watered cells within the region (TWS ‒ wet surface temperature) and the corresponding wet environment evaporation rate (ETW), out of consideration that the coldest pixels are the wettest (Szilágyi – Kovács 2010). The two points define the linear transformation of the TS pixel values into ETA rates for the examined period (for example a month).
Figure 1. Schematic representation of the linear transformation of the MODIS daytime surface temperature values into ET rates (after Szilágyi et al. 2011)
The 8-day composited MODIS daytime Ts data for Hungary over the 2000–2008 period was collected and the Ts maps were averaged for each month to yield one surface temperature map per month by Kovács (2011). Further necessary data for calculation (mean annual precipitation, mean monthly air temperature, specific humidity as well as sunshine duration values) were provided by the Hungarian Meteorological Service. The monthly ETA maps were prepared from March till November each year, because in the winter-time with possible patchy snow cover on the ground the quasi-constant surface net energy assumption of the Ts
versus ETA transformations break down (due to the snow cover’s vastly different albedo from that of the land) (Szilágyi – Józsa 2009). ET in Hungary is small from December through February, the sum total is about 20 mm (Kovács 2011). We made calculations for total water years (from November 1 to October 31), so a 20 mm correction was added for all pixels of each mean annual ET maps (1999 November was prepared as the average of the other Novembers). The mean annual ET maps were averaged for the period of 1999-2008.
2.2 The Budyko-type model
The Budyko curve (Budyko 1974) is often used to estimate the actual evaporation as a function of the aridity index. In any location, depending on the dryness of the climate, either the available water or the available energy is the limiting factor (Gerrits et al. 2009).
The Budyko curve is based on two balance equations, the water balance and the energy balance:
∆𝑆 = 𝑃 − 𝐸𝑇𝐴 − 𝑅 (2)
𝑄𝑛𝑇 = 𝐿 ∙ 𝐸𝑇𝐴+ 𝐻 + 𝐺 (3) where ΔS is the water storage change over time (m/year), P the precipitation (m/year), ETA
the actual evaporation (m/year), R the runoff (m/year), QnT the net radiation (J/m2/year), L the latent heat of vaporization (J/m3), H the sensible heat flux (J/m2/year), and G the ground heat flux (J/m2/year).
On an annual time scale we can assume (Arora 2002) that the water storage change is negligible (ΔS = 0) and that the net ground heat flux approaches zero (G = 0), thus:
𝑃 = 𝐸𝑇𝐴 + 𝑅 (4)
𝑄𝑛𝑇 = 𝐿 ∙ 𝐸𝑇𝐴 + 𝐻 (5)
𝐸𝑇𝐴
𝑇𝑆 𝑇𝑊𝑆
𝐸𝑇𝑊
Surface temperature
Evapotranspiration rate
By dividing Eq. 5 by Eq. 4 we obtain:
𝑄𝑛𝑇
𝑃 = 𝐿∙𝐸𝑇𝑃𝐴+𝐻𝑃 (6)
Arora (2002) interprets potential evaporation as (different from the above ETP):
𝐸𝑇0 = 𝑄𝐿𝑛𝑇 (7)
Displacement of Eq. 6 by Eq. 7:
𝐸𝑇0
𝑃 = 𝐸𝑇𝑃𝐴+(𝐻/𝐿)𝑃 (8)
If we define the Bowen ratio as 𝐵𝑟 = 𝐻/𝐿 ∙ 𝐸𝑇𝐴 (Gerrits et al. 2009), we obtain:
𝐸𝑇0
𝑃 =𝐸𝑇𝑃𝐴+𝐵𝑟∙𝐸𝑇𝑃 𝐴= 𝜙 =𝐸𝑇𝑃𝐴(1 + 𝐵𝑟) (9) with 𝜙 the aridity index.
Since the Bowen ratio can also be expressed as a function of the aridity index (𝐵𝑟 = 𝑓(𝜙)) (Arora 2002), Eq. 9 can be rewritten as:
𝐸𝑇𝐴
𝑃 = 1+𝑓(𝜙)𝜙 = 𝐹(𝜙) (10)
So, the evapotranspiration ratio (𝐸𝑇𝑃𝐴) is a function of aridity index.
A lot of studies have been done on finding this relation.The best-kown classical studies were done by Schreiber, Ol’dekop, Turc, Pike, Budyko and Porporato et al. (Gerrits et al.
2009). Their equations are summarized in Table 1.
Table 1. Equations for the relation of the evapotranspiration ratio (𝐸𝑇𝑃𝐴) and the aridity index (𝜙) (after Gerrits et al. 2009)
Equation Reference
𝐸𝑇𝐴
𝑃 = 1 − exp(−𝜙) Schreiber (1904)
𝐸𝑇𝐴
𝑃 = 𝜙 tanh(1/𝜙) Ol’dekop (1911)
𝐸𝑇𝐴
𝑃 = √0.9+(1/𝜙)1 2 Turc (1954)
𝐸𝑇𝐴
𝑃 = 1
√1+(1/𝜙)2 Pike (1964)
𝐸𝑇𝐴
𝑃 = [ 𝜙 tanh(1/𝜙)(1 − exp(−𝜙))]0.5 Budyko (1974)
𝐸𝑇𝐴
𝑃 = 1 −𝜙∙𝛾
𝛾
𝜙−1exp(−𝛾)
𝛤(𝜙𝛾)−𝛤(𝜙𝛾,𝛾) Porporato et al. (2004)
From the above models we are using the Schreiber equation (Schreiber 1904), because of its simplicity. The actual evapotraspiration estimated by Schreiber's method (hereinafter the evapotranspiration, the precipitation and the runoff are understood in mm/year instead of m/year):
𝐸𝑇𝐴 = 𝑃(1 − exp(−𝜙)) = 𝑃 (1 − exp (−𝐸𝑇𝑃0)) (11)
The determination of runoff by Schreiber (Fraedrich 2009):
𝑅 = 𝑃 − 𝐸𝑇𝐴 = 𝑃 exp (−𝐸𝑇𝑃0) (12) After rearrangement we get the following equation for potential evapotranspiration:
𝐸𝑇0 = −𝑃 (ln (𝑅𝑃)) (13) ET0 can also be expressed as a function of pan-evaporation (ETpan), according to the general relation for Hungary (Nováky 2002):
𝐸𝑇0 = 𝑓(𝐸𝑇𝑝𝑎𝑛) = −𝛼𝐸𝑇𝑝𝑎𝑛 = −𝛼 (36400𝑇𝑃+ 104) (14) where α is a calibration parameter, which aggregates all of the factors affecting ET (dominantly the surface cover) (Keve – Nováky 2010), and T is the mean annual temperature (℃).
Knowing the above equations, α can be calculated:
𝛼 = −𝐸𝑇𝐸𝑇0
𝑝𝑎𝑛 (15)
According to Nováky, the spatially distributed version of the Budyko-model is applicable to analyze the climatic impacts (Nováky 1985, 2002).The spatially-distributed determination of α parameter was the following: ET0 (Eq. 13) and ETpan (the part in parentheses of Eq. 14) values of Zala county were calculated for the 1999-2008 period (in the same resolution as the ETA maps), and they were substituted for Eq. 15.
When the ETA value was higher than the P value of the pixel, so R became negative, the α parameter could not be determined, because the natural logarithm of a negative number is undefined (Eq. 13). For these pixels another calibration parameter (β) was calculated according to the next formula (McMahon et al. 2012):
𝛽 =𝐸𝑇𝐸𝑇𝐴
𝑝𝑎𝑛 (16)
α and β parameters must be calculated in spatially distributed mode (maps). The parameter maps (α and β) are suitable to analyze this data in the context of land cover types. They can be used for evaluating future ET and R in spatially-distributed mode, for that only temperature and precipitation predictions are required.
The calculations were done with the help of DigiTerra Map software, the temperature and precipitation data were available in the “Agroclimate 2 (VKSZ_12-1-2013-00-34)” project.
3 STUDY SITE DESCRIPTION
Zala County is situated in the south-western part of Hungary (Figure 2). It is bordered by Vas County to the north, by Veszprém County to the east, by Somogy County to the south, and by the state border to the west. It is one of the smallest counties of Hungary. It covers 3784 km2. The population was 282 179 people in 2011 (less than the 3% of the total population of Hungary). The mean population density is 75 people per km2 (KSH 2011).
The county has a varying landscape of hills and valleys. The settlement density is one of the highest in Hungary, although the average size of the settlements is less than the half of the national average. It has no distinctive isolation from adjacent territories. It is a transition through a series of grades. The highest point of the county is 445 m (Köves-tető), which can be found in the Keszthelyi Mountains on the eastern edge of the county.
Figure 2. Location of Zala County within Hungary
The climate is moderated by atlantic effects, so the mean annual temperature was about 11.6 °C between 1999 and 2008. Winters are relatively mild and summers tend to be cooler than the norm for the Carpathian Basin. It is one of the wettest parts of the country. The average annual rainfall during this period was about 700 mm in the west, and 600 mm in the east.
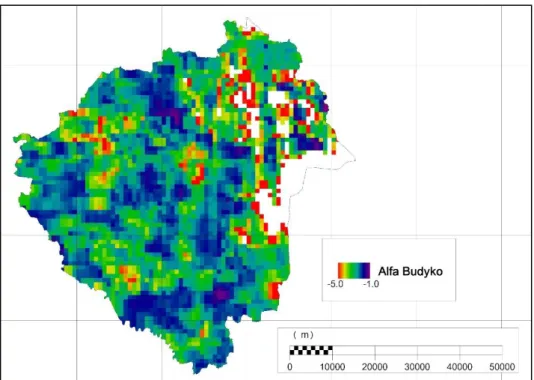
Agriculture is the dominant land use (54%) in the County, with a significant presence of forest and semi natural areas, which cover more than 37% of the total area (Figure 3 and Table 2).
Figure 3. Land cover of Zala County (CLC 2006)
Table 2. Land cover distribution of Zala County
Land cover type Area
(km2)
Percentage (%)
Artificial surfaces 195.90 5.18
Agricultural areas 2040.71 53.94
Forest and semi natural areas 1406.01 37.16
Wetlands 62.97 1.66
Water bodies 77.94 2.06
Total 3783.54 100.00
4 RESULTS
The averaged (1999-2008 period) mean actual evapotranspiration and runoff for Zala County were analyzed in the context of land cover types. Moreover, the Budyko-type α and the β parameters were calculated, mapped and analyzed too.
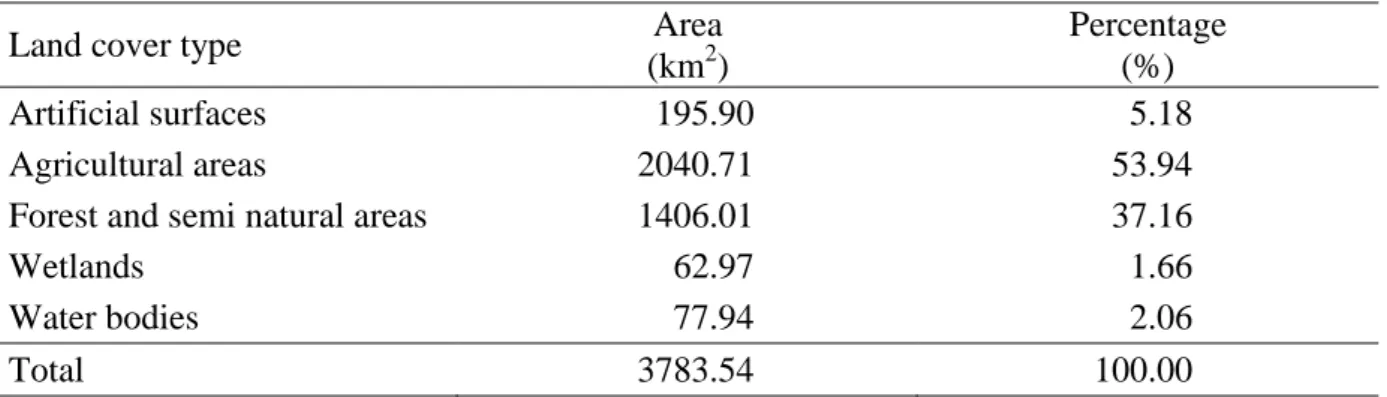
4.1 Evaluation of evapotranspiration
The mean annual actual evapotranspiration over Zala County (1999-2008) is displayed in Figure 4. The average ETA of the County was 577 mm/year, which is 88% of the mean annual precipitation (655.7 mm/year). The brown pixels show lower rates on the map. The bigger cities are distinctly visible as brown patches. Higher ETA values (green and blue pixels) belong to water bodies and wetlands, and they are also in the south-western part of the County.
Figure 4. Mean annual ETA rates over Zala County (1999-2008)
Table 3 contains the ETA values belonging to the each Corine Land Cover (CLC 2006) type. The evapotranspiration, the runoff, the Budyko-α and the β parameter maps have a 1·1 km resolution. They were examined with a vector land cover map, so more land cover types might belong to one pixel. The value of these ‘mixed pixels’ were counted in more land cover types, so it distorts the differences between the categories.
The highest mean annual ETA rates were determined for water bodies (658 mm/year) and wetlands (622 mm/year). Forest and semi natural areas have higher values than agricultural areas and the lowest rates belong to artificial surfaces. Standard deviation is the highest in case of water bodies (97 mm).
Table 3. Mean annual ETA rates of different land cover types over Zala County (1999-2008)
Land cover type Mean annual ET (mm)
Min Max Average P%* Std. dev
Artificial surfaces 450 703 562 86 38
Agricultural areas 434 721 569 87 35
Forest and semi natural areas 434 828 582 89 37
Wetlands 461 729 622 95 53
Water bodies 486 846 658 100 97
* In the percentage of the mean annual precipitation
Figure 5 shows the mean annual ETA over forest and semi natural areas. In the north- eastern part of Zala County the ETA values of forest are generally lower than the south- western part and the neighborhood of wetlands.
Figure 5. Mean annual ETA rates over forest and semi natural areas in Zala County (1999-2008)
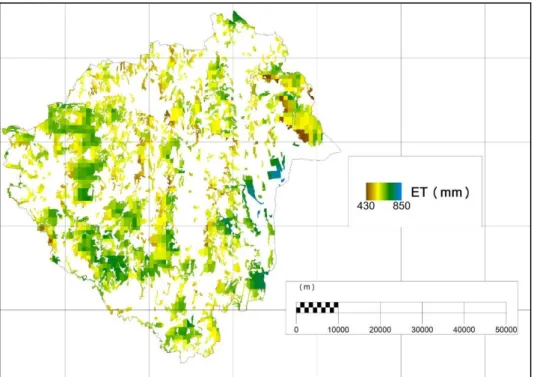
4.2 Evaluation of runoff
The mean annual runoff (R, 1999-2008) was calculated from the water-balance equation, as the difference of annual precipitation and mean annual actual evapotranspiration (R = P − ETA).
The 10·10 km spatial resolution precipitation map was downscaled for 1·1 km using the bicubic convolution interpolation technique, and after it was validated by field measurements.
(The data from field measurements were not used for preparation of the original map.)
Figure 6 shows the mean annual runoff over Zala County and Table 4 contains the rates of the different types of land cover. The average runoff was 78 mm/year, which is 12% of the mean annual precipitation (655.7 mm/year). The runoff is the highest on artificial surfaces, and it decreases in the other categories. It is especially low for wetlands, and negative for water bodies, where the ETA is generally higher than the precipitation. Moreover, the standard deviation is the highest over water bodies (119 mm).
Figure 6. Mean annual R rates over Zala County (1999-2008)
Table 4.Mean annual runoff rates of different land cover types over Zala County (1999-2008)
Land cover type Mean annual R (mm)
Min Max Average P%* Std. dev
Artificial surfaces -86 231 89 14 48
Agricultural areas -88 231 87 13 45
Forest and semi natural areas -181 214 77 12 46
Wetlands -98 140 2 0 58
Water bodies -250 211 -19 -3 119
* In the percentage of the mean annual precipitation
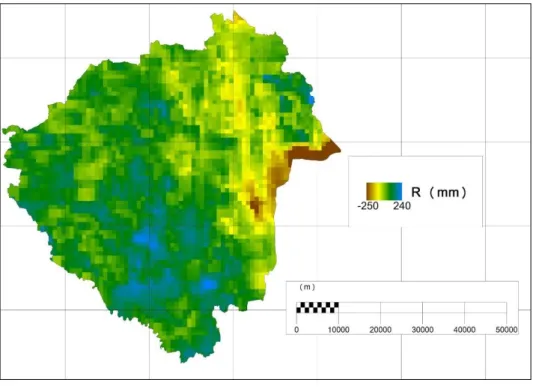
4.3 Evaluation of α and β parameters
The calculated Budyko-type α parameter can be seen in Figure 7, and the values belonging to the each land cover type are in Table 5.
Figure 7. The calculated Budyko-type α parameter rates in Zala County
Table 5. The calculated Budyko-type α parameters (absolute values) of different land cover types over Zala County
Land cover type α parameter
Min Max Average Std. dev.
Artificial surfaces 1.03 4.59 1.80 0.42
Agricultural areas 0.96 7.48 1.86 0.46
Forest and semi natural areas 0.96 7.48 1.98 0.51
Wetlands 1.08 5.88 2.42 1.05
Water bodies 1.15 6.30 2.16 0.87
Compared to the α values determined by Keve – Nováky (2010), the comparable categories according to land cover types show similar tendencies (Table 6), but the differences between the categories are smaller. High absolute α values are calculated for forest, lower for agricultural areas and much lower for artificial surfaces. The α parameters are not comparable for wetlands and water bodies. The deviation from the values estimated by Keve and Nováky arises from two sources. The first reason is the different climatic conditions because they modelled a plain catchment basin, second is that the values of their parameters were not based on calculations but on estimations considering the land cover.
Table 6. α values determined by Keve – Nováky (2010)
Description α
Artificial surface, with channel 2.3
More channels in the area 2.4
Big channel in the area 2.5
Agricultural area, with channel 2.7
Agricultural area, without channel 2.8
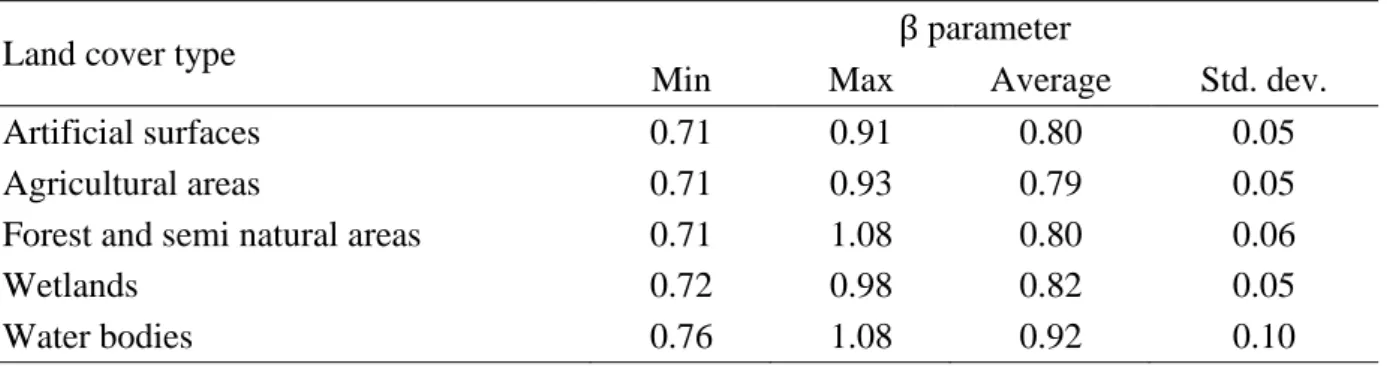
We calculated the β parameter (which gives the relationship between ETpan and ETA) for those pixels, where ETA value was higher than P value, because the Budyko-type model for this type of pixels is not valid. Typically this is the case for wetlands and water bodies. The β parameter map is displayed in Figure 8, and the rates of the different land cover types can be seen in Table 7. From agricultural areas to water bodies, β shows increasing values. (For artificial surfaces it is inadequate, because the pixel number of the category was very small.) The highest maximum values were detected over water bodies (1.08) as well as forest and semi natural areas (1.07), exceeding the calculated pan-evaporation (U-pan) rates by 7–8%.
Figure 8. β parameter pixels and rates in Zala County
Table 7. The calculated β parameter rates of different land cover types over Zala County
Land cover type β parameter
Min Max Average Std. dev.
Artificial surfaces 0.71 0.91 0.80 0.05
Agricultural areas 0.71 0.93 0.79 0.05
Forest and semi natural areas 0.71 1.08 0.80 0.06
Wetlands 0.72 0.98 0.82 0.05
Water bodies 0.76 1.08 0.92 0.10
5 EVAPOTRANSPIRATION AND RUNOFF PREDICTIONS
Temperature and precipitation data were required for estimating future ETA and runoff of Zala County, besides the prepared Budyko-α and β parameter maps. They were obtained for three periods (2011-2040, 2041-2070, 2071-2100) by averaging of 12 Regional Climate Models data (RCM, Table 8, Csóka 2013). The original grid size of the RCM maps was 25·25 km.
They were disaggregated to 1·1 km spatial resolution by the bicubic convolution interpolation technique.
Table 8. Main parameters of the Regional Climate Models (Csóka 2013)
Nr. Institute Model Scenario Resolution
1. C4I RCA3 A1B 25 km
2. MPI-M REMO A1B 25 km
3. ETHZ CLM A1B 25 km
4. KNMI RACMO2 A1B 25 km
5. DMI HIRHAM5 A1B 25 km
6. DMI HIRHAM5 A1B 25 km
7. SMHI RCA A1B 25 km
8. SMHI RCA A1B 25 km
9. SMHI RCA A1B 25 km
10. HC HadRM3Q0 A1B 25 km
11. HC HadRM3Q3 A1B 25 km
12. HC HadRM3Q16 A1B 25 km
The 11, 14, 15 and 16 Equations were used for calculating spatially distributed future ETA. The runoff data were obtained as the difference of precipitation and ETA. These calculations were done for Zala County, not on a catchment scale.
Figure 9 shows the estimated mean annual ETA values belong to the period 1999-2008 and the three predicted periods (2011-2040, 2041-2070, 2071-2100) in the context of climatic index (100∙T/P, Nováky 1985). According to the predictions a mean annual temperature increase of about 3 Celsius (from 11.6 °C to 14.6 °C) and a 25 mm decrease in precipitation can be expected by the end of the century. The mean annual evapotranspiration may increase about 27 mm, from 577 mm to 604 mm (from 88 to 96 percent of the precipitation).
Figure 9. The trend of the mean annual evapotranspiration in the context of the climatic index (100·T/P)
Table 9 contains the estimated mean annual ETA values belonging to each land cover type. The largest increase (90-100 mm) can be expected in wetlands and water bodies. The ETA increments are similar for artificial surfaces, agricultural areas, forest and semi-natural
577
583
600
604
1999-2008
2011-2040
2041-2070
2071-2100
y = 50,856x + 488,24
570 575 580 585 590 595 600 605 610
1,7 1,8 1,9 2,0 2,1 2,2 2,3 2,4
ETA (mm)
100·T/P
Table 9. The annual actual evapotranspiration of different land cover types, and annual precipitation, mean annual temperature and climatic index belonging to the 1999–
2008 period and the three future periods
Period Mean annual ETA (mm) P
(mm)
T
(°C) 100∙T/P
AS* ACA FSN WL WB
1999–2008 562 569 582 622 658 655.7 11.6 1.8
2011–2040 567 574 586 646 684 642.6 12.3 1.9
2041–2070 583 590 602 677 718 648.7 13.5 2.1
2071–2100 585 592 604 714 759 630.4 14.6 2.3
Slope# 45.730 43.524 44.213 167.610 182.730 – – –
* AS: artificial surfaces, ACA: agricultural areas, FSN: forest and semi natural areas, WL: wetlands, WB: water bodies.
#Slope of the trend line.
Figure 10 shows the mean annual runoff values belonging to the 1999-2008 period and the three predicted periods in the context of climatic index. The mean annual runoff may significantly decrease (from 78 mm/year to 27 mm/year, from 12 to 4 percent of the precipitation) by the end of the 21st century.
Figure 10. The trend of the mean annual runoff in the context of the climatic index (100·T/P)
The estimated mean annual runoff values belonging to the each land cover type are shown in Table 10. Obviously the increasing evapotranspiration prevails in case of the wetlands and water bodies: -144 mm and -115 mm negative water balance can be detected for future. If we compare artificial surfaces, agricultural areas as well as forest and semi natural areas, for the latter can be detected the lowest annual runoff.
78
60
49
27 1999-2008
2011-2040
2041-2070
2071-2100 y = -89,997x + 235,2
25 30 35 40 45 50 55 60 65 70 75 80
1,7 1,8 1,9 2,0 2,1 2,2 2,3 2,4
R (mm)
100·T/P
Table 10. The annual runoff of different land cover types, and annual precipitation, mean annual temperature and climatic index belonging to the period of 1999–2008 and the three future periods
Period Mean annual R (mm) P
(mm)
T
(°C) 100∙T/
AS* ACA FSN WL WB P
1999–2008 89 87 77 2 –19 655.7 11.6 1.8
2011–2040 71 69 59 –36 –58 642.6 12.3 1.9
2041–2070 61 59 50 –61 –86 648.7 13.5 2.1
2071–2100 40 39 29 –115 –144 630.4 14.6 2.3
Slope# –84.625 –83.215 –83.281 –205.770 –220.090 – – –
* AS: artificial surfaces, ACA: agricultural areas, FSN: forest and semi natural areas, WL: wetlands, WB: water bodies.
# Slope of the trend line.
6 CONCLUSIONS
The spatially-distributed ETA and runoff maps are suitable to analyze the data in the context of land cover types. The average ETA of Zala County from 1999-2008 was 577 mm/year, or 88% of the mean annual precipitation (655.7 mm/year). The highest mean annual ETA rates were determined for water bodies (658 mm/year) and wetlands (622 mm/year). Forest and semi natural areas have higher values than agricultural areas. The lowest rates belong to artificial surfaces. The mean annual runoff is the largest on artificial surfaces (89 mm/year), and it decreases on the other land cover types.
We used the Budyko-type model (α-parameter) and a linear model with β-parameter for evaluating the effects of climate change on evapotranspiration. The β-parameter was used for the extra-water affected pixels. These calculations were not done on a watershed, but in the future the α and β parameters can be validated on a catchment scale using historical precipitation and streamflow measurements. By using the two parameter maps and future data of climate models (mean annual temperature and precipitation) evapotranspiration and runoff predictions have been done to the end of the 21st century. According to the predictions, the mean annual evapotranspiration may increase about 27 mm while the runoff may decrease to the one third of the present amount by the end of the century.
Acknowledgements: This research has been supported by “Agroclimate 2 (VKSZ_12-1- 2013-00-34)” project. The research of Zoltán Gribovszki was supported by the European Union and the Government of Hungary, co-financed by the European Social Fund in the framework of TAMOP 4.2.4. A/2-11-1-2012-0001 ’National Excellence Program’.
REFERENCES
ARORA,V.K. (2002): The use of the aridity index to assess climate change effect on annual runoff. J.
Hydrol., 265, 164–177.
BOUCHET, R. J. (1963): Evapotranspiration reelle, evapotranspiration potentielle, et production agricole.
[Actual evapotranspiration, potential evapotranspiration, and agricultural production.] Ann.
CLC (2006): Corine Land Cover. European Environment Agency, European Topic Centre for Spatial information and Analysis, Copenhagen, Denmark. Online: http://sia.eionet.europa.eu/CLC2006 CSÓKA, G. (2013): A klímaváltozás vízgazdálkodási hatásainak vizsgálata éghajlat-lefolyási model-
lekkel. [Analysis of climate change effects on water management using climate-runoff models.]
MSc thesis, University of West Hungary, Sopron. (in Hungarian)
FRAEDRICH, K. (2010): A Parsimonious Stochastic Water Reservoir: Schreiber’s 1904 Equation. J.
Hydrometeor., 11, 575–578.
GERRITS,A.M.J.–SAVENIJE,H.H.G.–VELING,E.J.M.–PFISTER,L.(2009): Analytical derivation of the Budyko curve based on rainfall characteristics and a simple evaporation model. Water Resources Research 45:4.
HEWLETT,J.D. (1982): Principles of forest hydrology. The University of Georgia Press, Athens KEVE,G. – NOVÁKY, B. (2010): Klímaváltozás hatásának vizsgálata a Bácsbokodi-Kígyós csatorna
vízgyűjtőjén Budyko modell alkalmazásával. [Effects of climate change in the catchment of Bácsbodoki-Kígyós channel by using Budyko-model.] XXVIII. National Conference of Hungarian Hydrological Society, Sopron, 7–9th July, 2010. (in Hungarian)
KOVÁCS,Á. (2011): Tó- és területi párolgás becslésének pontosítása és magyarországi alkalmazásai.
[Specifying lake and areal evapotranspiration rates in Hungary.] PhD thesis, Budapest University of Technology and Economics, Budapest. (in Hungarian)
KSH (2011): Regional data – Zala County. Hungarian Central Statistical Office, Budapest, Hungary.
Online: http://www.ksh.hu/nepszamlalas/tables_regional_20
MCMAHON, T. A. – PEEL, M. C. – LOWE, L. – SRIKANTHAN, R. – AND MCVICAR, T. R. (2012):
Estimating actual, potential, reference crop and pan evaporation using standard meteorological data: a pragmatic synthesis. Hydrol. Earth Syst. Sci. Discuss., 9, 11829-11910, doi:10.5194/hessd-9-11829-2012
MORTON,F.I.–RICARD,F.–FOGARASI,S. (1985): Operational estimates of areal evapotranspiration and lake evaporation – Program WREVAP. National Hydrological Research Institute Paper #24, Ottawa, Ontario, Canada
NOVÁKY, B. (1985): A lefolyás éghajlati adottságai a Zagyva-Tarna vízrendszerben. [The runoff climatic facilities in the Zagyva-Tarna water system.] Vízügyi Közlemények, 1.: 78–93. (in Hungarian)
NOVÁKY,B. (2002): Mapping of mean annual actual evaporation on the example of Zagyva catchment area. Időjárás (Quarterly Journal of the Hungarian Meteorological Service), 3–4, 227–238.
SCHREIBER,P. (1904): Über die Beziehungen zwischen dem Niederschlag und der Wasserführung der Flüsse in Mitteleuropa. Z. Meteorol., 21(10), 441–452.
SZILÁGYI,J.–JÓZSA,J. (2009): Estimating spatially distributed monthly evapotranspiration rates by linear transformations of MODIS daytime land surface temperature data. Hydrol. Earth System Sci. 13(5), 629–637.
SZILÁGYI, J. – KOVÁCS, Á. (2010): Complementary-relationship-based evapotranspiration mapping (CREMAP) technique for Hungary. Periodica Polytechnica - Civil Engineering, 54(2), 95-100.
SZILÁGYI, J. – KOVÁCS, Á. (2011): A calibration-free evapotranspiration mapping technique for spatially-distributed regional-scale hydrologic modeling. J. Hydrol. Hydromech., 59, 2011, 2, 118–130.
SZILÁGYI, J. – KOVÁCS, Á. – JÓZSA, J. (2011): A calibration-free evapotranspiration mapping (CREMAP) technique. In: L. Labedzki (ed.): Evapotranspiration, InTech, Rijeka, Croatia