CERS-IE WORKING PAPERS | KRTK-KTI MŰHELYTANULMÁNYOK
INSTITUTE OF ECONOMICS, CENTRE FOR ECONOMIC AND REGIONAL STUDIES, BUDAPEST, 2020
Temperature, climate change, and human conception rates:
Evidence from Hungary
TAMÁS HAJDU– GÁBOR HAJDU
CERS-IE WP – 2020/17 April 2020
https://www.mtakti.hu/wp-content/uploads/2020/04/CERSIEWP202017.pdf
CERS-IE Working Papers are circulated to promote discussion and provoque comments, they have not been peer-reviewed.
Any references to discussion papers should clearly state that the paper is preliminary.
Materials published in this series may be subject to further publication.
ABSTRACT
In this paper, we examine the relationship between temperature and human conception rates and project the impacts of climate change by the mid-twenty-first century. Using complete administrative data on 6.8 million pregnancies between 1980 and 2015 in Hungary, we show that exposure to hot temperatures reduces the conception rate in the first few weeks following the exposure, but a partial rebound is observed after that. Absent adaptation, climate change is projected to increase seasonal differences in conception rates, and a decline is expected in terms of annual conception rates. This latter decline is driven by a change in the number of induced abortions and spontaneous fetal losses. The overall number of live births is unaffected. However, some newborns may experience non-negligible consequences because of the altering in utero temperature exposure due to a shift in the timing of conception.
JEL codes: J13, Q54
Keywords: conception rate; fertility; temperature; weather; climate change
Tamás Hajdu
Institute of Economics, Centre for Economic and Regional Studies, 1097 Budapest, Tóth Kálmán u. 4, Hungary
e-mail: hajdu.tamas@krtk.mta.hu
Gábor Hajdu
Institute for Sociology, Centre for Social Sciences, 1097 Budapest, Tóth Kálmán u. 4, Hungary
e-mail: hajdu.gabor@tk.mta.hu
Hőmérséklet, klímaváltozás és fogantatási ráta: Egy magyarországi elemzés eredményei
HAJDU TAMÁS-HAJDU GÁBOR
Összefoglaló
Tanulmányunkban a hőmérséklet és a fogantatások közti kapcsolatot vizsgáljuk, valamint a klímaváltozás 21. század közepére várható hatását becsüljük.
Elemzésünkben az 1980 és 2015 közötti 6,8 millió magyarországi terhesség adatainak segítségével megmutatjuk, hogy a magas hőmérsékletnek való kitettség csökkenti a fogantatási rátát az expozíciót követő néhány héten, majd egy részleges „korrekció”
(növekedés) figyelhető meg a későbbi hetekben. A klímaváltozás hatására a
fogantatási ráta szezonális különbségeinek erősödése és éves szintjének kismértékű csökkenése várható. Ez utóbbi csökkenést a terhességmegszakítások és spontán vetélések számának visszaesése okozza. A klímaváltozás az élveszületések számát érdemben nem befolyásolja. Ugyanakkor az újszülöttek egy részének fogantatási időpontja a klímaváltozás hatására megváltozik, így a különböző hőmérsékletű napoknak való terhesség alatti kitettségük is módosul, aminek további kedvezőtlen következményei lehetnek.
JEL: J13, Q54
Kulcsszavak: fogantatási ráta; fertilitás; hőmérséklet; időjárás; klímaváltozás
1
Temperature, climate change, and human conception rates: Evidence from Hungary
Tamás Hajdua,* and Gábor Hajdub
a Institute of Economics, Centre for Economic and Regional Studies (hajdu.tamas@krtk.mta.hu)
b Institute for Sociology, Centre for Social Sciences (hajdu.gabor@tk.mta.hu)
* corresponding author
Abstract
In this paper, we examine the relationship between temperature and human conception rates and project the impacts of climate change by the mid-twenty-first century. Using complete administrative data on 6.8 million pregnancies between 1980 and 2015 in Hungary, we show that exposure to hot temperatures reduces the conception rate in the first few weeks following the exposure, but a partial rebound is observed after that. Absent adaptation, climate change is projected to increase seasonal differences in conception rates, and a decline is expected in terms of annual conception rates. This latter decline is driven by a change in the number of induced abortions and spontaneous fetal losses. The overall number of live births is unaffected.
However, some newborns may experience non-negligible consequences because of the altering in utero temperature exposure due to a shift in the timing of conception.
Keywords: conception rate; fertility; temperature; weather; climate change JEL codes: J13, Q54
Acknowledgments: We acknowledge climate scenarios from the NEX-GDDP dataset, prepared by the Climate Analytics Group and NASA Ames Research Center using the NASA Earth Exchange, and distributed by the NASA Center for Climate Simulation (NCCS). We also acknowledge the E-OBS dataset from the EU-FP6 project UERRA (http://www.uerra.eu) and the data providers in the ECA&D project (https://www.ecad.eu). The present study has been produced using the live birth, induced abortion, and fetal loss records of the Hungarian Central Statistical Office (HCSO). The calculations and the conclusions are the intellectual product of the authors.
Funding: This work was supported by the Hungarian National Research, Development and Innovation Office – NKFIH (grant no. FK 124310). Tamás Hajdu was also supported by the Momentum ("Lendület") Program of the Hungarian Academy of Sciences (grant no. LP2018-2/2018) and the János Bolyai Research Scholarship of the Hungarian Academy of Sciences.
Data and code availability: All data and code necessary for replication of the results in this paper are available for download at https://figshare.com/s/6a039f7a0bbfb8d5e3e1. The original climate projections data can be downloaded from: https://dataserver.nccs.nasa.gov/thredds/catalog/bypass/NEX-GDDP/catalog.html. The original weather data can be downloaded from: https://www.ecad.eu//download/ensembles/download.php.
Conception data has been produced using the individual-level de-identified live birth, induced abortion, and fetal loss records of the Hungarian Central Statistical Office (HCSO). The de-identified microdata sets are available only for research purposes in a secure data environment (HCSO-CERS research room).
2 1. Introduction
Scientists have been interested in the seasonality of human pregnancy and its associations with temperature for many decades now (Chang et al., 1963; Mills and Senior, 1930; Stoeckel and Choudhury, 1972; Takahashi, 1964). Despite this long-standing interest, the causal estimation on the relationship between temperature and overall conception rates is missing. Existing studies have only examined the effect of temperature on live birth rates, and they have found that exposure to hot temperature causes a decline in birth rates 9–10 months later (Barreca et al., 2018; Lam and Miron, 1996; Seiver, 1989). More importantly, the impacts of climate change on human conceptions remain unexplored, even though the projected warming of the climate has prompted numerous studies covering its effects on natural and human systems (Carleton and Hsiang, 2016; Dell et al., 2014; Scheffers et al., 2016).
While there is no causal evidence on the relationship between temperature and the human conception rate, the related literature points towards the existence of a negative impact.
First, animal experiments suggest that males exposed to high temperatures are less fertile (Burfening et al., 1970; Jannes et al., 1998; Paul et al., 2008; Wettemann et al., 1979; Yaeram et al., 2006), although the impact of heat stress on the conception capability of females is less clear (Hansen, 2009). Second, human studies have shown that exposure to heat suppresses spermatogenesis (Ahmad et al., 2012; Brown-Woodman et al., 1984; Carlsen et al., 2003;
Garolla et al., 2013; Macleod and Hotchkiss, 1941; Robinson et al., 1968; Wang et al., 2007;
Zhang et al., 2015).
In this paper, we analyze the impact of ambient temperature on the overall human conception rate in Hungary. We use administrative data with full coverage on pregnancies recorded by the country’s health care system. Our data cover 6.8 million pregnancies with conceptions occurring between 1980 and 2015, including live births, spontaneous fetal losses, and induced abortions, incorporated into 37,440 county-year-week cells. To estimate the causal effect of temperature on the conception rate (defined by the number of conceptions per week in a given county per 100,000 women aged 16–44 years), we exploit the presumably random year- to-year variation in the calendar week-specific average temperature. We allow for a nonlinear temperature–conception rate relationship by using eight temperature categories that represent the number of days with different daily mean temperatures. We allow the weekly conception rate to be affected by lagged temperatures up to 25 weeks. This way we can identify the potential delayed impacts or shifts in conception rates. Our model controls for differences in county-specific seasonality and its change over time, as well as for county-specific shocks at the year level. Next, we combine our historical estimates with projections of 21 climate models to calculate the impact of climate change by the mid-twenty-first century (2040-2059). We project the impacts on (i) seasonal distribution and (ii) annual level of conception rate.
We find that exposure to hot temperatures (daily mean temperature >25°C) has a deteriorating effect on conception rates in the short term (up to 5 weeks after the exposure), showing a U-shaped pattern with the strongest impact ranging from 2 to 4 weeks after the exposure. We find practically zero coefficients between weeks 6 and 10, and an increased conception rate from week 11 after the exposure, which suggests that exposure to hot temperatures changes the timing of some conceptions.
We also show that seasonal differences in conception rates are likely to be larger by the mid-twenty-first century because of climate change. Conception rates in the summer and early autumn months are projected to decrease, whereas conception rates during winter and late autumn are projected to increase. In addition, the annual conception rate is projected to decline.
This decline is primarily driven by a change in the number of induced abortions and spontaneous fetal losses rather than by a change in the number of live births. Finally, we show that although the overall number of live births will not change significantly as a result of climate change, future warming will change the season of the conception of some newborns. This shift
3
could have important consequences on the affected newborns by altering their in utero temperature exposure.
Our study provides important contributions to the literature. To our knowledge, this is the first study that examines the impact of temperature on the human conception rate using data with full coverage on all pregnancies that are recorded by the health care system (live births, induced abortions, and spontaneous fetal losses). Furthermore, we project the impacts of climate change on the overall human conception rate and examine the impacts by pregnancy type. Thus, our paper offers important insights for climate change policy.
2. Data
2.1. Conceptions
To calculate conception rates, we use the administrative registers of the Hungarian Central Statistical Office. These individual-level registry data cover all clinically recognized pregnancies that end in a live birth, spontaneous fetal loss, or induced abortion between 1980 and 2016 in Hungary. In other words, they include all pregnancies that are reported to and documented by the national health care system (including public and private care as well). The de-identified microdata sets are available only for research purposes in a secure data environment of the Hungarian Central Statistical Office.
Because all these datasets contain information on the date of birth/abortion/fetal loss and pregnancy length, we can estimate the date of conception for all pregnancies. We do it in two steps. First, we estimate the first day of the last menses. Because gestation length is calculated from the first day of the last menses, and it is reported in completed weeks, we estimate the starting date of the menstrual cycle as follows:
M=LD (GL 7 3)− + (1)
where M is the first day of the last menses, LD is the last day of the pregnancy, GL is gestation length reported in completed weeks. Because the extra days beyond the completed weeks are dropped from the reported gestation length, the true gestational age is 0–6 days longer than the reported one. Therefore, we calculate the first day of the last menses adding 3 days (the average bias) to the reported pregnancy length.
In the second step, we estimate the date of conception based on the first day of the last menses. As conception occurs within hours after ovulation (Stirnemann et al., 2013; Wilcox et al., 1995), and the day of ovulation is most likely to be between the 11th and 19th day of the menstrual cycle (Baird et al., 1995; Cole et al., 2009; Ecochard and Gougeon, 2000; Fehring et al., 2006; Lenton et al., 1984; Stirnemann et al., 2013; Waller et al., 1998), we assume that conceptions occur on the 15th day. That is, we estimate the date of conception as follows:
FD=M 14+ (2)
where FD is the first day of the pregnancy (conception day), and M is the first day of the last menses.
Based on the estimated conception dates, we calculate conception rates at the county- year-week level defined by the number of conceptions per week per 100,000 women aged 16–
44. We divide each year into 52 weeks, which means that the last week is 8 days long (except leap years, when it lasts 9 days). The county of conception (pregnancy) is defined by the place of residence of the mother (at the end of pregnancy). Budapest, the capital city of Hungary, is a separate administrative unit, therefore, it is considered as an individual county. The number of women aged 16–44 (at the beginning of the year) for every year and county comes from the Hungarian Central Statistical Office. These population figures are assigned to the first week of
4
the year, and the unobserved county-week figures are estimated by linear interpolation between the years.
Pregnancies with missing information on gestational age or on the exact day of the end of the pregnancy are excluded, as well as pregnancies with non-Hungarian or unknown places of residence (less than 1% of all pregnancies in total). Our final sample covers 6,788,096 pregnancies (3,866,298 live births, 2,307,327 induced abortions, and 614,471 spontaneous fetal deaths) with conception days estimated to be between 1980 and 2015.
Finally, we note that the estimated conception dates are biased estimations of the actual conception dates. However, because conception rates are calculated at the year-by-calendar- week level, a small bias (a couple of days) in the estimated conception date does not change the week of conception in most cases. In addition, because the bias is very likely to be random, the calculated conception rates should not be greatly influenced.
2.2. Weather data
We use weather data from the E-OBS 19.0e dataset of the European Climate Assessment &
Dataset project(Cornes et al., 2018), which provides daily weather measures for Europe at a spacing of 0.1° × 0.1° in regular latitude/longitude coordinates from 1950 to 2018. The dataset includes information on maximum, minimum and average temperatures, and precipitation. We create eight binary temperature variables based on the average temperature (below −5°C, −5–
0°C, 0–5°C, 5–10°C, 10–15°C, 15–20°C, 20–25°C, over 25°C) and four precipitation variables indicating the amount of daily precipitation (0 mm, 0–1 mm, 1–5 mm, over 5 mm) to describe the daily weather conditions at the grid points within Hungary. Next, to preserve variation in temperature we average the new temperature and precipitation variables for each day over grid points within the 20 counties of Hungary.
Finally, we construct weekly level measures from the daily data by summing up the variables over the weeks for each county. Accordingly, eight temperature variables show the number of days in a given week and given county when the daily mean temperature falls in a certain temperature bin (below −5°C, −5–0°C, 0–5°C, 5–10°C, 10–15°C, 15–20°C, 20–25°C, over 25°C), and four precipitation variables show the number of days when the amount of daily precipitation falls in a certain precipitation bin (0 mm, 0–1 mm, 1–5 mm, over 5 mm). The descriptive statistics are shown in Table 1.
The weather data are matched to the conceptions by the county of mother’s residence (at the end of pregnancy).
5 Table 1. Descriptive statistics
mean SD min max N
Conception rate 174.02 35.40 66.94 349.60 37,440 N of days per week with
temperature
≤−5°C 0.22 0.91 0 9 37,440
−5 to 0°C 0.68 1.50 0 8.14 37,440
0 to 5°C 1.16 1.87 0 9 37,440
5 to 10°C 1.11 1.77 0 7 37,440
10 to 15°C 1.19 1.85 0 7 37,440
15 to 20°C 1.44 2.02 0 7 37,440
20 to 25°C 1.01 1.83 0 7 37,440
>25°C 0.21 0.83 0 7 37,440
Notes: Units of observations: county-by-year-by-week. Weighted by the average female population (aged 16–44) of the counties between 1980 and 2015. Conception rate is defined as the number of conceptions per week per 100,000 women aged 16–44.
2.3. Climate projections
To quantify the impact of climate change by the mid-twenty-first century, we use the NASA Earth Exchange (NEX) Global Daily Downscaled Projections (GDDP) dataset, which provides daily maximum and minimum temperatures for the period from 2006 to 2100, and retrospectively simulated temperature variables between 1950 and 2005 (Thrasher et al., 2012).
The NEX-GDDP data contain projections of 21 climate models for two representative concentration pathway scenarios (RCP 4.5 and RCP 8.5). The climate models are ACCESS1- 0, BCC-CSM1-1, BNU-ESM, CanESM2, CCSM4, CESM1-BGC, CNRM-CM5, CSIRO- MK3-6-0, GFDL-CM3, GFDL-ESM2G, GFDL-ESM2M, INMCM4, IPSL-CM5A-LR, IPSL- CM5A-MR, MIROC-ESM, MIROC-ESM-CHEM, MIROC5, MPI-ESM-LR, MPI-ESM-MR, MPI-ESM-MR, MRI-CGCM3, and NorESM1-M. They were developed for the Fifth Assessment Report of the IPCC. RCP 4.5 is an intermediate scenario with declining greenhouse gas (GHG) emission and stabilizing GHG concentration in the second half of the twenty-first century, whereas RCP 8.5 represents a scenario where GHG emission and concentration continue to rise (Moss et al., 2010). Each climate projection is downscaled at a spatial resolution of 0.25° × 0.25°.
We calculated daily average temperature as the mean of the maximum and minimum temperature. As for the historical weather data, we created eight temperature indicators to describe the daily weather conditions at the grid points located within the borders of Hungary (avg. daily temperature is below −5°C, −5–0°C, 0–5°C, 5–10°C, 10–15°C, 15–20°C, 20–25°C, over 25°C). To obtain the projected temperature on a specific day in a given county, we simply averaged the eight temperature variables over the grid points located within the counties. Using these estimations, we calculate the distribution of temperature (i) in the period of 2040–2059 for the 42 climate projections (21 models, and two RCPs), and (ii) in the period of 1986–2005 for the 21 climate models by county and calendar week. Next, to make a projection for the whole country, we averaged the county-level temperature distributions using the female population aged 16–44 between 1980 and 2015 as weights. For the calculation of the projected impacts of climate change, we used these country-level (national) averages. The within-model changes were calculated as the difference between the periods of 2040–2059 and 1986–2005.
6
To investigate the impact of climate change on conception rates, we use the projected changes by calendar week.
3. Empirical strategy
3.1. Relationship between temperature and conception rates
We model the dynamics of the temperature−conception rate relationship at the county-week level. We estimate the following equation via ordinary least squares:
j j j j a b 2
ct k c(t k ) k c(t k ) t cw cy cw cw ct
k j k j
ln(Y )=
T − +
P − + + + + + + X t t (3) where Y is conception rate in county c at time t (year y, week w). T is a vector of variables indicating the distribution of daily mean temperature in county c at time t. The temperature variables represent the number of days when the daily mean temperatures are: below −5°C, −5–0°C, 0–5°C, 5–10°C, 10–15°C, 15–20°C, 20–25°C, or above 25°C. In the analysis, T15-20 is the omitted category. That is, coefficient βj shows the effect of one additional day when the daily mean temperature falls into temperature bin j on the log conception rate (relative to a day with a mean temperature of 15–20°C). P is a vector of precipitation controls, which shows the number of days where the amount of daily precipitation falls in a certain precipitation bin (0–1 mm, 1–5 mm, over 5 mm). The omitted category is the number of days without precipitation.
We allow the conception rate at time t to be affected by the temperature and precipitation variables up to 25 weeks prior (k = 0, 1,…, 25). In this specification, βk coefficients are the effects of temperature at time t on log conception rate after k weeks (Stock and Watson, 2015).
That is, the series of coefficients β0, β1, …, β25 can be interpreted as the effect of temperature at time t on current and future conception rates (up to 25 weeks after the temperature exposure).
X is a variable controlling for the share of weekend days and holidays that fall on weekdays, at time t. County-by-calendar-week fixed effects (δcw) help account for time- invariant unobserved differences in seasonal conception rates across counties (e.g., owing to seasonal employment patterns). County-by-year fixed effects (ηcy) control for county-specific changes in the conception rate over time. These fixed effects adjust for, e.g., the county-specific effects of the 2008 economic crisis or the geographically diverse impacts of the transition to democracy. We also allow county-specific seasonality to change over time by adding county- by-week quadratic time trends (λcw). In sum, the effect of temperature on conception rates is identified from inter-annual variation in the calendar week-specific temperature after adjustment for differences in county-specific seasonality and its change over time, as well as for county-specific shocks to conception rate at the year level.
We weight by the counties’ average female population size (aged 16–44) between 1980 and 2015. Standard errors are clustered by county and time (two-way clustering). For the estimations, we used STATA package reghdfe.
We test the sensitivity of the results by a wide range of additional model specifications.
Fist, we exclude precipitation controls:
j j a b 2
ct k c(t k ) t cw cy cw cw ct
k j
ln(Y )=
T − + + + + + + X t t (4)Second, we exclude county-by-week quadratic time-trends:
j j j j
ct k c(t k ) k c(t k ) t cw cy ct
k j k j
ln(Y )=
T − +
P − + + + + X (5)Third, we simply use county, year, and week fixed effects:
7
j j j j
ct k c(t k ) k c(t k ) t c y w ct
k j k j
ln(Y )=
T − +
P − + + + + + X (6)Fourth, we include lagged conception rates (25 lags):
( )
25
j j j j
ct h c(t h ) k c(t k ) k c(t k ) t cw cy
h 1 k j k j
a b 2
cw cw ct
ln(Y ) ln Y T P X
t t
− − −
=
= + + + + +
+ + +
(7)
We also estimate specifications with 28 or 31 temperature and precipitation lags, and using 3°C wide temperature categories (≤–6°C, −6 to −3°C, −3 to 0°C, 0 to 3°C, 3 to 6°C, 6 to 9°C, 9 to 12°C, 12 to 15°C, 15 to 18°C, 18 to 21°C, 21 to 24°C, 24 to 27°C, >27°C). Besides, as placebo checks, we use future weather data (measured exactly 1, 2 or 3 years later).
3.2. Projected impacts of climate change
To quantify the impacts of climate change, we combine the estimated temperature–conception rate relationship with the projected within-model changes in temperature distribution by calendar week between the periods of 1986–2005 and 2040–2059 for Hungary. We take the estimations on the temperature–conception relationship (β coefficients in Equation (3)) and multiply them by the projected temperature changes. We project the medium-term impacts on (i) seasonality and (ii) the annual conception rate.
To examine the impact on seasonality of conception rates, first, we calculate the projected impacts by calendar week in the following way:
( )
j j,2040 2059 j,1986 2005
wmr k (w k )mr (w k )m
k j
V exp T − − T − − 1
= − −
, (8)where V is the percentage change in conception rate for calendar week w, climate model m, and RCP r by the mid-twenty-first century. 𝛽𝑘𝑗 is the estimated historical relationship between temperature bin j and conception rate for lag k (k = 0, 1,…, 25) (see Equation (3)). T2040-2059 is a vector that shows the projected temperature distribution in the period of 2040–2059 for calendar week w, climate model m, and RCP r: N of days when the daily mean temperature falls into temperature bin j. Similarly, variables T1986-2005 show the N of days when the retrospectively simulated daily mean temperature falls into temperature bin j in the period of 1986–2005 for calendar week w, climate model m.
Next, we calculate the projected conception rate for the period of 2040–2059:
( )
2040 2059 1986 2005
wmr wmr w
Y − = +1 V Y − , (9)
where we simply use the percentage change in conception rate for calendar week w, climate model m, and RCP r (Vwmr), and multiply it with the conception rate in the baseline period (Y1986-2005).
Finally, we project the annual impact of climate change by averaging the projected weekly percentage changes using the total number of conceptions in the calendar weeks between 1980 and 2015 as weights:
w wmr
mr w
Z f V
=
52 , (10)8
where Z is the projected annual percentage change in the conception rate for climate model m, and RCP r. V comes from Equation (8), and f is a weight variable (scaled to mean 1) based on the total number of conceptions between 1986 and 2005 in calendar week w.
To account not only for climate uncertainty but regression uncertainty as well (uncertainty in the relationship between temperature and conception), we re-estimate the regression coefficients of the baseline model specification (Equation (3)), applying bootstrap samples (500 times, sampling with replacement). Using the 500 coefficient estimations and the projections of the 21 climate models, we construct 10,500 possible projections (21*500) for each RCP scenario, by which we can incorporate both climate and regression uncertainty into the projected impacts of climate change (Burke et al., 2015).
We note that our calculations assume that the future relationship between temperature and the conception rate will be the same as in the past.
4. Results
4.1. Historical relationship between temperature and conception rates
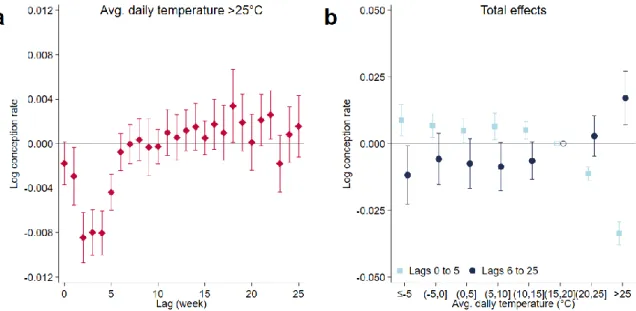
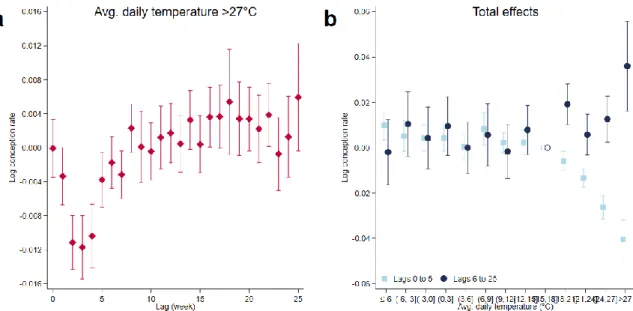
Estimating the historical relationship between temperature and conception rates, we find that exposure to a hot (>25°C) day slightly reduces conception rates in the week of the exposure (−0.18%, p=0.068) and the following week (−0.29%, p=0.029), compared with a day with a mean temperature of 15–20°C (Fig. 1a). Two weeks after exposure, weekly conception rates are more strongly decreased, by 0.85% (p=0.000), whereas the coefficients on weeks 3 and 4 are both −0.80% (p=0.000). Five weeks after exposure, the impact is lower (−0.44%, p=0.000).
Between weeks 6 and 10, the coefficients are practically zero, whereas from week 11, they begin to increase, and until week 22, they are consistently positive, indicating an increased conception rate over this period. However, most of the 95% confidence intervals include zero.
These results suggest that exposure to hot temperatures changes the timing of some conceptions.
Conceptions do not disappear because of the exposure, but are delayed by several weeks.
We investigate the possible displacement further by calculating the sum of the coefficients (total effect) over weeks (lags) 0–5 and 6–25. These calculations show the extent to which the initial change in conception rates over weeks 0–5 is compensated by a rebound in the later weeks. The total effect of exposure to hot temperature is −0.034 log points over weeks 0–5 and 0.017 log points over weeks 6–25 (Fig. 1b). This suggests that approximately half of the short-term decline is compensated by a rebound within 6 months following the exposure.
Nevertheless, the total impact remains negative: exposure to a >25°C day reduces the overall conception rate over a 26-week period by 0.06% (p=0.012). The impacts of exposure to a 20–
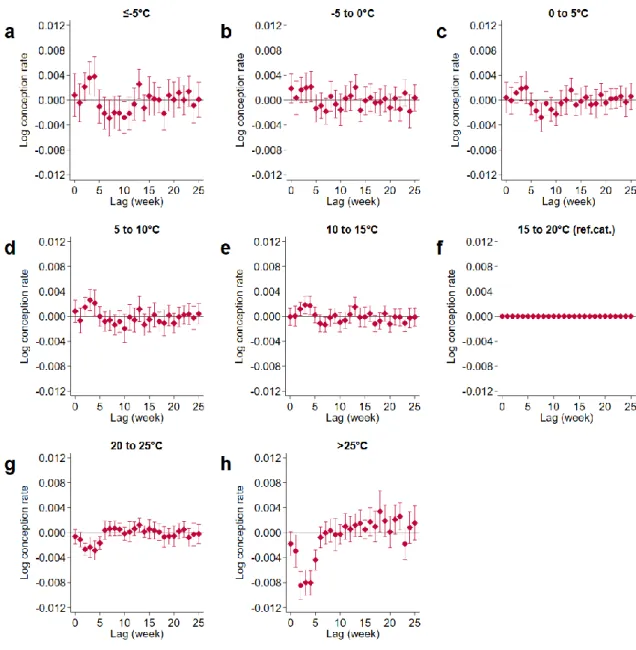
25°C day are similar but lower in magnitude. The cumulative effects over weeks 0–5 and weeks 6–25 are −0.011 and 0.003 log points, respectively (see also Fig. A1 in the Appendix for the individual coefficients). Importantly, temperature exposure seems to have a monotonic, non- linear effect. Colder temperatures below the omitted category have small positive effects over weeks 0–5 and small negative effects over weeks 6–25, with no apparent differences between temperature categories.
9
Fig. 1. Historical relationship between temperature and conception rates
Notes: (a) The effects of exposure to a day with an average temperature above 25°C on current and future conception rates up to 25 weeks (relative to a day with a mean temperature of 15–20°C). (b) The total effects (sum of the coefficients) over weeks (lags) 0–5 and 6–25 after exposure. All estimates are based on Equation (3). The error bars represent 95% confidence intervals. The outcome variable is the log conception rate. Conception rate is defined as the number of conceptions per week per 100,000 women aged 16–44, which has a mean of 174.02 in our sample. The model has county-by-year fixed effects, county-by-calendar-week fixed effects, and county-by- week quadratic time trends county by month-of-year specific linear time trends. We control for precipitation and the share of non-working days. We weight by the counties’ average female population size (aged 16–44) between 1980 and 2015. Standard errors are clustered by county and time.
We test the sensitivity of the results by a wide range of additional model specifications:
controlling for lagged weekly conception rates (up to 25 weeks), excluding precipitation controls, using different fixed effects, excluding county-by-week quadratic time-trends (Fig.
A2, Appendix), including more temperature lags (Fig. A3, Appendix), and using 3°C wide temperature categories (Fig. A4, Appendix). None of these changes alter the main conclusions, but the latter result suggests that the effects of temperature is increasing past 25°C.
In addition, as placebo tests, the temperature and precipitation variables are replaced with weather data that were measured exactly 1, 2 or 3 years later. Because conception rates could not have been affected by temperature in the distant future, zero or close to zero coefficients should be observed in the placebo regressions. These estimations further support the credibility of the baseline results (Fig. A5, Appendix). In general, as expected, the estimated individual coefficients are usually insignificant. The total impacts show fairly random pattern.
4.2. Projected impacts of climate change
To quantify the impacts of climate change, the estimated temperature–conception rate relationship is combined with the projected changes in temperature distribution between the periods of 1986–2005 and 2040–2059 by calendar week. First, we show the projections for the overall conception rate. Next, we replicate these projections by conception type (pregnancy outcome).
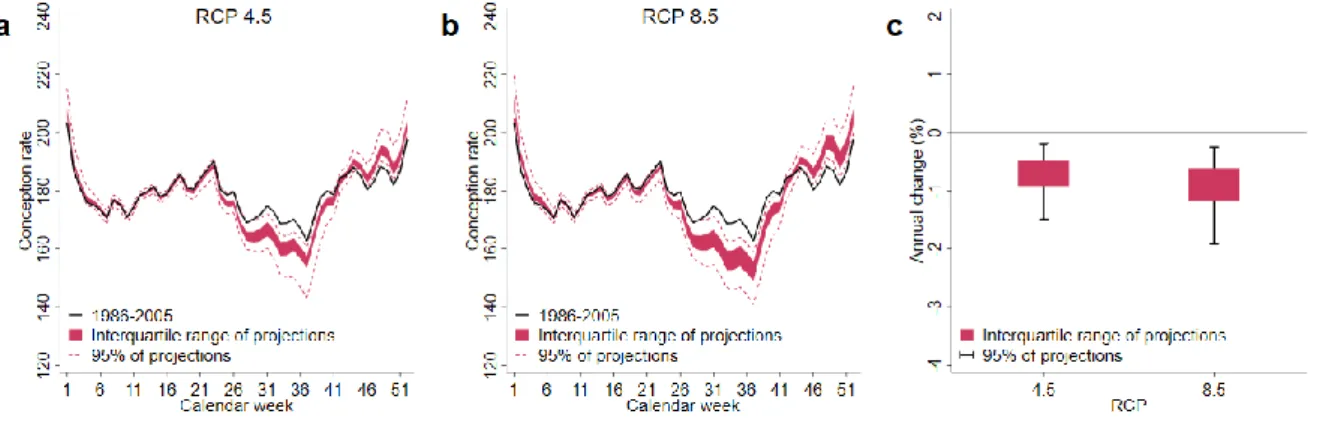
Seasonal differences in conception rates are likely to be larger by the mid-twenty-first century because of climate change (Fig. 2a and Fig. 2b). We project a substantial decline between the 23rd and 42nd calendar weeks as a result of the increase in the number of hot days.
10
The impacts are especially large for calendar weeks 30 to 38: the median projections in RCP 8.5 reflect a decline of between 5.5% and 7.5%. At the same time, conception rates are projected to increase in the first calendar weeks, and especially in the last 10 weeks of the year. Regarding the annual impact of climate change, practically all projections suggest a decline in annual conception rates (Fig. 2c). The interquartile ranges of the projections spread from −0.47% to
−0.92% for RCP 4.5 and from −0.61% to −1.18% for RCP 8.5.
Fig. 2. Projected impact of climate change on conception rates
Notes: Impacts on the seasonal distribution (a,b) and annual volume (c) of conception rates by 2040–2059. The impacts are calculated using the projected within-model differences in temperature distribution between the periods of 1986–2005 and 2040–2059 by 21 climate models and the historical relationship between conception rates and temperature from Equation (3) (estimated by 500 bootstrap samples). For these graphs, conception rates in calendar week 52 are rescaled to 7 days. Conception rate is defined as the number of conceptions per week per 100,000 women aged 16–44.
Using alternative model specifications to estimate the historical temperature–
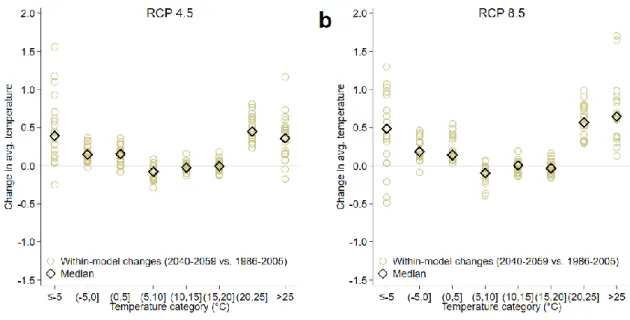
conception rate relationship (see above), in most cases, does not considerably alter the projected impacts of climate change (Fig. A6, Appendix). However, if the seasonality of conception rates is not allowed to change over time, the projected impacts are more severe than in the baseline specification. This suggests that there is a spurious correlation between temperature and the change in seasonality of conception rates that has to be controlled for. In addition, using narrower (3°C wide) temperature categories results in a slightly stronger projected impact. This specification allows to account for the fact that the effect of temperature is increasing past 25°C (see Fig. A4, Appendix), and the average temperature within the >25°C category will increase in the future (Fig. A7, Appendix). Nevertheless, the qualitative results are the same in all these estimations: seasonal differences in conception rates will increase because of climate change and the annual rates will decrease by a few percent during the next decades.
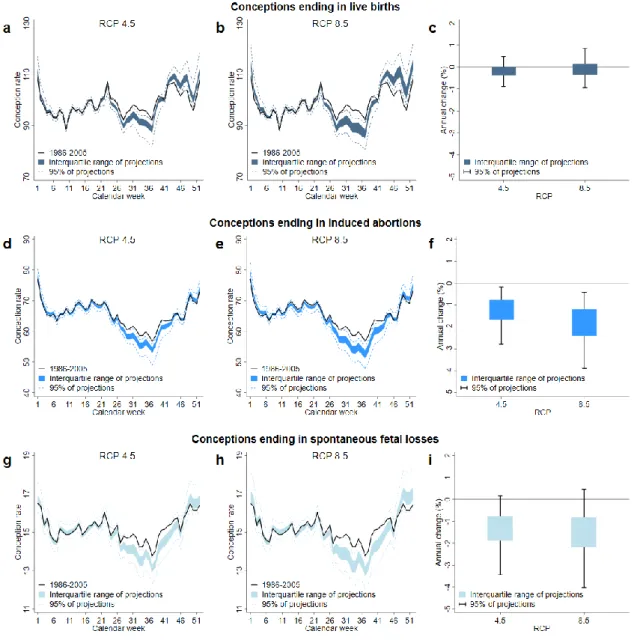
Next, we calculate the impacts of climate change by conception type. We use historical estimates on the temperature–conception rate relationship from models where conception rates were calculated from pregnancies ending in (i) live births, (ii) induced abortions, or (iii) spontaneous fetal losses, and combine them with the projected temperature changes as was done before. Seasonal differences in conception rates will be larger for all kinds of conceptions (Fig.
3a,b,d,e,g,h). Conception rates in the summer and early autumn months are projected to decrease, whereas conception rates during winter and late autumn are projected to increase. A notable difference is that the winter/autumn increase is more significant for live births than for spontaneous fetal losses or induced abortions. As a result, the differences in terms of annual impacts are substantial (Fig. 3c,f,i). The overall conception rate based on live births seems to be unaffected by a climate change-induced shift in temperature distribution, whereas the annual conception rates based on induced abortions and spontaneous fetal losses are projected to
11
decline by a few percent. That is, the annual decline in overall conception rate (Fig. 2c) is primarily driven by a change in the number of induced abortions and spontaneous fetal losses rather than by a change in the number of live births.
Fig. 3. Projected impact of climate change by conception type
Notes: The impacts on the seasonal distribution of conceptions ending in live births (a,b), induced abortions (d,e), and spontaneous fetal losses (g,h) by 2040–2059. The impacts on annual volume of conception rates in live births (c), induced abortions (f), and spontaneous fetal losses (i) by 2040–2059. The impacts are calculated using the projected within-model differences in temperature distribution between the periods of 1986–2005 and 2040–2059 by 21 climate models and the historical relationship between conception rates and temperature (estimated by 500 bootstrap samples). For these graphs, conception rates in calendar week 52 are rescaled to 7 days. Conception rate is defined as the number of conceptions (ending in live births/induced abortions/spontaneous fetal losses) per week per 100,000 women aged 16–44.
These results are likely to reflect that individuals who desire to have a baby are very likely to eventually have one, even if it is delayed because of exposure to hot weather. However, if heat exposure prevents an unintended pregnancy, then it is less likely that the “missing”
12
conception will be replaced by another pregnancy a couple of months later. Because most pregnancies ending in live births are planned/intended in Central and Eastern Europe (Bearak et al., 2018), it is not surprising that the overall impact of climate change is close to zero. In contrast, induced abortions are much more likely to be the result of unplanned pregnancies.
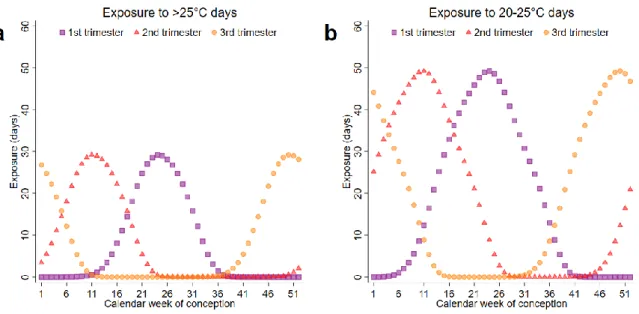
Therefore, a sizeable rebound after the initial decline due to exposure to heat is not expected when analyzing conception rates calculated from pregnancies ending in induced abortions. That is, the overall impact of climate change should be negative. Regarding spontaneous fetal losses, numerous factors may contribute to the overall reduction in conceptions. First, unplanned pregnancies have higher odds of miscarriage (Maconochie et al., 2007). Second, some intended conceptions from the summer/early autumn months, which would have ended in a spontaneous fetal loss, are likely to occur a couple of months later as a result of climate change. This shift, however, influences in utero temperature exposures of the fetuses. Their first trimester exposure to hot days will decrease, whereas their exposure during the second and third trimesters will increase (Fig. A8, Appendix). Because animal studies suggest that heat exposure during early pregnancy increases embryo loss (Edwards et al., 2003; Romo-Barron et al., 2019; Ulberg and Burfening, 1967), this decreased first trimester exposure to hot days could lower the risk of miscarriage. Therefore, conceptions ending in a spontaneous fetal loss will increase to a lesser extent in the late autumn and winter months than a simple delay in the time of conception would predict.
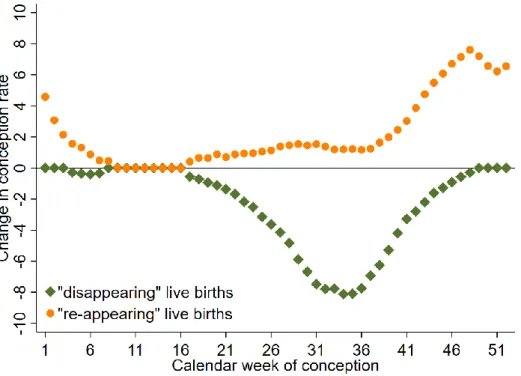
We also note that although the annual conception rate based on live births (in other words, the number of births) will not change significantly as a result of climate change, the changing seasonal distribution of conceptions could have important consequences on the affected newborns. The warming climate will induce a shift in the timing of conception for a small fraction of live births. In general, conceptions will disappear form the summer months and will re-appear mostly in the winter and late autumn months (Fig. A9, Appendix).1 Because of this shift, as highlighted before, the exposure of fetuses to hot days during the second and third trimesters of pregnancy will substantially increase, whereas the first trimester exposure will drop (Fig. A8, Appendix). A crude estimation suggests that the affected newborns will be exposed, on average, to around 16 additional hot days (>25°C) and 32 additional moderately hot days (20–25°C) during the second and third trimesters due to the change in the conception date (Table A1, Appendix). Considering the whole pregnancy, these figures are 9 and 16 days, respectively. At the same time, the exposure to cold days will substantially decrease. Because there is a negative relationship between in utero exposure to hot weather (especially in the second and third trimesters) and health at birth (Barreca and Schaller, 2020; Chen et al., 2020;
Deschênes et al., 2009; Sun et al., 2019), the slight change in timing of conception could have a non-negligible impact. Further consequences are also possible, as temperature exposure during pregnancy influences adult outcomes too (Fishman et al., 2019; Hu and Li, 2019; Isen et al., 2017).
5. Discussion and Conclusion
Using complete administrative data from Hungary, we find that exposure to heat has a deteriorating effect on conception rates in the short term (up to 5 weeks after the0020exposure), showing a U-shaped pattern with the strongest impact ranging from 2 to 4 weeks after the exposure. In theory, three mechanisms can drive this relationship. First, heat might reduce sexual activity. Second, it could change conception chance. Third, it might influence the chance of a clinically unrecognized loss of an embryo. Unfortunately, the data we use do not allow us
1 The definition and calculation of disappearing and re-appearing live births are provided in the notes of Fig. A9 in the Appendix.
13
to determine the exact importance of these channels. However, that we see a small effect in the week of the exposure and larger effects later suggests that hot weather has no sizable negative influence on sexual behavior. Indeed, previous studies report that heat does not decrease sexual activity (Hajdu and Hajdu, 2019), but interest in sex is rather driven by holidays and cultural/religious celebrations (Wood et al., 2017). The second channel might be an important one. As mentioned before, experiments with mammals suggest that the conception chance is diminished by heat exposure (Jannes et al., 1998; Paul et al., 2008; Wettemann et al., 1979;
Yaeram et al., 2006). Human studies report that heat suppresses spermatogenesis (Ahmad et al., 2012; Brown-Woodman et al., 1984; Carlsen et al., 2003; Garolla et al., 2013; Macleod and Hotchkiss, 1941; Robinson et al., 1968; Wang et al., 2007; Zhang et al., 2015). Although the results of these papers are not directly comparable with our study, they are similar in that they usually report a prolonged and but reversible (U-shaped) impact on various sperm parameters.
This suggests that exposure to heat decreases the conception rate by reducing human reproductive health. However, because a sizeable portion of human pregnancies end in a clinically unrecognized pregnancy loss (Wilcox et al., 1988; Zinaman et al., 1996) and therefore is not included in any administrative dataset, we cannot rule out that hot weather also diminishes the survival probability of the fetus after conception but before clinical recognition.
We find practically zero coefficients between weeks 6 and 10, and an increased conception rate from week 11 after the exposure, which suggests that exposure to hot temperatures changes the timing of some conceptions. However, we note that our results do not necessarily mean that hot temperature has a negative impact on the conception rate only up to 5 weeks following the exposure. Some pregnancies that fail to start due to exposure to hot weather (in the first weeks after the exposure) might experience a shift in conception date as little as one menstrual cycle and might occur 5-10 weeks after the exposure. This shift might veil the negative effects over this period.
Our calculations suggest that climate change-induced shift in temperature distribution will influence human conception. Seasonal differences in conception rates will be larger by the mid-twenty-first century, and the annual conception rate is projected to decline. We also find that the overall live birth rate, unlike the overall rate of induced abortions and spontaneous fetal losses, seems to be unaffected. However, future warming will change the season of the conception of some newborns, which will influence their in utero temperature exposure and thus might reduce their health at birth and affect later life outcomes.
Finally, we note that our findings are based on data from Hungary and cannot necessarily be generalized to other countries. However, climatic conditions are very similar in many European countries, thus, our results might be relevant for a larger geographic area.
Nevertheless, further studies should assess how temperature and climate change might influence conceptions in other parts of the world.
References
Ahmad, G., Moinard, N., Esquerré-Lamare, C., Mieusset, R., Bujan, L., 2012. Mild induced testicular and epididymal hyperthermia alters sperm chromatin integrity in men. Fertility and Sterility 97, 546–553.
https://doi.org/10.1016/j.fertnstert.2011.12.025
Baird, D.D., McConnaughey, D.R., Weinberg, C.R., Musey, P.I., Collins, D.C., Kesner, J.S., Knecht, E.A., Wilcox, A.J., 1995. Application of a Method for Estimating Day of Ovulation Using Urinary Estrogen and Progesterone Metabolites. Epidemiology 6, 547–550.
Barreca, A., Deschenes, O., Guldi, M., 2018. Maybe Next Month? Temperature Shocks and Dynamic Adjustments in Birth Rates. Demography 55, 1269–1293. https://doi.org/10.1007/s13524-018-0690-7
Barreca, A., Schaller, J., 2020. The impact of high ambient temperatures on delivery timing and gestational lengths.
Nature Climate Change 10, 77–82. https://doi.org/10.1038/s41558-019-0632-4
14
Bearak, J., Popinchalk, A., Alkema, L., Sedgh, G., 2018. Global, regional, and subregional trends in unintended pregnancy and its outcomes from 1990 to 2014: estimates from a Bayesian hierarchical model. The Lancet Global Health 6, e380–e389. https://doi.org/10.1016/S2214-109X(18)30029-9
Brown-Woodman, P.D.C., Post, E.J., Gass, G.C., White, I.G., 1984. The Effect of a Single Sauna Exposure on Spermatozoa. Archives of Andrology 12, 9–15. https://doi.org/10.3109/01485018409161141
Burfening, P.J., Elliott, D.S., Eisen, E.J., Ulberg, L.C., 1970. Survival of Embryos Resulting from Spermatozoa Produced by Mice Exposed to Elevated Ambient Temperature. J Anim Sci 30, 578–582.
https://doi.org/10.2527/jas1970.304578x
Burke, M., Dykema, J., Lobell, D.B., Miguel, E., Satyanath, S., 2015. Incorporating Climate Uncertainty into Estimates of Climate Change Impacts. The Review of Economics and Statistics 97, 461–471.
https://doi.org/10.1162/REST_a_00478
Carleton, T.A., Hsiang, S.M., 2016. Social and economic impacts of climate. Science 353, aad9837.
https://doi.org/10.1126/science.aad9837
Carlsen, E., Andersson, A.-M., Petersen, J.H., Skakkebæk, N.E., 2003. History of febrile illness and variation in semen quality. Hum Reprod 18, 2089–2092. https://doi.org/10.1093/humrep/deg412
Chang, K.S.F., Chan, S.T., Low, W.D., Ng, C.K., 1963. Climate and conception rates in Hong Kong. Human Biology 35, 366–376.
Chen, X., Tan, C.M., Zhang, Xiaobo, Zhang, Xin, 2020. The effects of prenatal exposure to temperature extremes on birth outcomes: the case of China. J Popul Econ. https://doi.org/10.1007/s00148-020-00768-4 Cole, L.A., Ladner, D.G., Byrn, F.W., 2009. The normal variabilities of the menstrual cycle. Fertility and Sterility
91, 522–527. https://doi.org/10.1016/j.fertnstert.2007.11.073
Cornes, R.C., Schrier, G. van der, Besselaar, E.J.M. van den, Jones, P.D., 2018. An Ensemble Version of the E- OBS Temperature and Precipitation Data Sets. Journal of Geophysical Research: Atmospheres 123, 9391–9409. https://doi.org/10.1029/2017JD028200
Dell, M., Jones, B.F., Olken, B.A., 2014. What Do We Learn from the Weather? The New Climate-Economy Literature. Journal of Economic Literature 52, 740–798. https://doi.org/10.1257/jel.52.3.740
Deschênes, O., Greenstone, M., Guryan, J., 2009. Climate Change and Birth Weight. American Economic Review 99, 211–17. https://doi.org/10.1257/aer.99.2.211
Ecochard, R., Gougeon, A., 2000. Side of ovulation and cycle characteristics in normally fertile women. Hum Reprod 15, 752–755. https://doi.org/10.1093/humrep/15.4.752
Edwards, M.J., Saunders, R.D., Shiota, K., 2003. Effects of heat on embryos and foetuses. International Journal of Hyperthermia 19, 295–324. https://doi.org/10.1080/0265673021000039628
Fehring, R.J., Schneider, M., Raviele, K., 2006. Variability in the Phases of the Menstrual Cycle. Journal of Obstetric, Gynecologic & Neonatal Nursing 35, 376–384. https://doi.org/10.1111/j.1552- 6909.2006.00051.x
Fishman, R., Carrillo, P., Russ, J., 2019. Long-term impacts of exposure to high temperatures on human capital and economic productivity. Journal of Environmental Economics and Management 93, 221–238.
https://doi.org/10.1016/j.jeem.2018.10.001
Garolla, A., Torino, M., Sartini, B., Cosci, I., Patassini, C., Carraro, U., Foresta, C., 2013. Seminal and molecular evidence that sauna exposure affects human spermatogenesis. Hum Reprod 28, 877–885.
https://doi.org/10.1093/humrep/det020
Hajdu, T., Hajdu, G., 2019. Ambient temperature and sexual activity: Evidence from time use surveys.
Demographic Research 40, 307–318. https://doi.org/10.4054/DemRes.2019.40.12
Hansen, P.J., 2009. Effects of heat stress on mammalian reproduction. Philosophical Transactions of the Royal Society B: Biological Sciences 364, 3341–3350. https://doi.org/10.1098/rstb.2009.0131
Hu, Z., Li, T., 2019. Too hot to handle: The effects of high temperatures during pregnancy on adult welfare outcomes. Journal of Environmental Economics and Management 94, 236–253.
https://doi.org/10.1016/j.jeem.2019.01.006
Isen, A., Rossin-Slater, M., Walker, R., 2017. Relationship between season of birth, temperature exposure, and later life wellbeing. PNAS 114, 13447–13452. https://doi.org/10.1073/pnas.1702436114
Jannes, P., Spiessens, C., Van der Auwera, I., D’Hooghe, T., Verhoeven, G., Vanderschueren, D., 1998. Male subfertility induced by acute scrotal heating affects embryo quality in normal female mice. Hum Reprod 13, 372–375. https://doi.org/10.1093/humrep/13.2.372
Lam, D.A., Miron, J.A., 1996. The effects of temperature on human fertility. Demography 33, 291–305.
https://doi.org/10.2307/2061762
Lenton, E.A., Landgren, B.-M., Sexton, L., 1984. Normal variation in the length of the luteal phase of the menstrual cycle: identification of the short luteal phase. BJOG: An International Journal of Obstetrics &
Gynaecology 91, 685–689. https://doi.org/10.1111/j.1471-0528.1984.tb04831.x
Macleod, J., Hotchkiss, R.S., 1941. The effect of hyperpyrexia upon spermatozoa counts in men. Endocrinology 28, 780–784. https://doi.org/10.1210/endo-28-5-780
15
Maconochie, N., Doyle, P., Prior, S., Simmons, R., 2007. Risk factors for first trimester miscarriage—results from a UK-population-based case–control study. BJOG: An International Journal of Obstetrics & Gynaecology 114, 170–186. https://doi.org/10.1111/j.1471-0528.2006.01193.x
Mills, C.A., Senior, F.A., 1930. Does Climate affect the Human Conception Rate? Archives of Internal Medicine 46, 921–929.
Moss, R.H., Edmonds, J.A., Hibbard, K.A., Manning, M.R., Rose, S.K., van Vuuren, D.P., Carter, T.R., Emori, S., Kainuma, M., Kram, T., Meehl, G.A., Mitchell, J.F.B., Nakicenovic, N., Riahi, K., Smith, S.J., Stouffer, R.J., Thomson, A.M., Weyant, J.P., Wilbanks, T.J., 2010. The next generation of scenarios for climate change research and assessment. Nature 463, 747–756. https://doi.org/10.1038/nature08823 Paul, C., Murray, A.A., Spears, N., Saunders, P.T.K., 2008. A single, mild, transient scrotal heat stress causes
DNA damage, subfertility and impairs formation of blastocysts in mice. Reproduction 136, 73–84.
https://doi.org/10.1530/REP-08-0036
Robinson, D., Rock, J., Menkin, M.F., 1968. Control of Human Spermatogenesis Intrascrotal Temperature. JAMA 204, 290–297. https://doi.org/10.1001/jama.1968.03140170006002
Romo-Barron, C.B., Diaz, D., Portillo-Loera, J.J., Romo-Rubio, J.A., Jimenez-Trejo, F., Montero-Pardo, A., 2019.
Impact of heat stress on the reproductive performance and physiology of ewes: a systematic review and meta-analyses. Int J Biometeorol 63, 949–962. https://doi.org/10.1007/s00484-019-01707-z
Scheffers, B.R., Meester, L.D., Bridge, T.C.L., Hoffmann, A.A., Pandolfi, J.M., Corlett, R.T., Butchart, S.H.M., Pearce-Kelly, P., Kovacs, K.M., Dudgeon, D., Pacifici, M., Rondinini, C., Foden, W.B., Martin, T.G., Mora, C., Bickford, D., Watson, J.E.M., 2016. The broad footprint of climate change from genes to biomes to people. Science 354, aaf7671. https://doi.org/10.1126/science.aaf7671
Seiver, D.A., 1989. Seasonality of fertility: New evidence. Population and Environment 10, 245–257.
https://doi.org/10.1007/BF01255839
Stirnemann, J.J., Samson, A., Bernard, J.-P., Thalabard, J.-C., 2013. Day-specific probabilities of conception in fertile cycles resulting in spontaneous pregnancies. Hum Reprod 28, 1110–1116.
https://doi.org/10.1093/humrep/des449
Stock, J.H., Watson, M.W., 2015. Introduction to Econometrics, 3rd edition. ed. Pearson Education.
Stoeckel, J., Choudhury, A.K., 1972. Seasonal variation in births in rural East Pakistan. J Biosoc Sci 4, 107–116.
Sun, S., Spangler, K.R., Weinberger, K.R., Yanosky, J.D., Braun, J.M., Wellenius, G.A., 2019. Ambient Temperature and Markers of Fetal Growth: A Retrospective Observational Study of 29 Million U.S.
Singleton Births. Environmental Health Perspectives 127, 067005. https://doi.org/10.1289/EHP4648 Takahashi, E., 1964. Seasonal Variation of Conception and Suicide. The Tohoku Journal of Experimental
Medicine 84, 215–227. https://doi.org/10.1620/tjem.84.215
Thrasher, B., Maurer, E.P., McKellar, C., Duffy, P.B., 2012. Technical Note: Bias correcting climate model simulated daily temperature extremes with quantile mapping. Hydrology and Earth System Sciences 16, 3309–3314. https://doi.org/10.5194/hess-16-3309-2012
Ulberg, L.C., Burfening, P.J., 1967. Embyro Death Resulting from Adverse Environment on Spermatozoa or Ova.
J Anim Sci 26, 571–577. https://doi.org/10.2527/jas1967.263571x
Waller, K., Swan, S.H., Windham, G.C., Fenster, L., Elkin, E.P., Lasley, B.L., 1998. Use of Urine Biomarkers to Evaluate Menstrual Function in Healthy Premenopausal Women. Am J Epidemiol 147, 1071–1080.
https://doi.org/10.1093/oxfordjournals.aje.a009401
Wang, C., Cui, Y.-G., Wang, X.-H., Jia, Y., Sinha Hikim, A., Lue, Y.-H., Tong, J.-S., Qian, L.-X., Sha, J.-H., Zhou, Z.-M., Hull, L., Leung, A., Swerdloff, R.S., 2007. Transient Scrotal Hyperthermia and Levonorgestrel Enhance Testosterone-Induced Spermatogenesis Suppression in Men through Increased Germ Cell Apoptosis. J Clin Endocrinol Metab 92, 3292–3304. https://doi.org/10.1210/jc.2007-0367 Wettemann, R.P., Wells, M.E., Johnson, R.K., 1979. Reproductive Characteristics of Boars during and after
Exposure to Increased Ambient Temperature. J Anim Sci 49, 1501–1505.
https://doi.org/10.2527/jas1979.4961501x
Wilcox, A.J., Weinberg, C.R., Baird, D.D., 1995. Timing of Sexual Intercourse in Relation to Ovulation — Effects on the Probability of Conception, Survival of the Pregnancy, and Sex of the Baby. New England Journal of Medicine 333, 1517–1521. https://doi.org/10.1056/NEJM199512073332301
Wilcox, A.J., Weinberg, C.R., O’Connor, J.F., Baird, D.D., Schlatterer, J.P., Canfield, R.E., Armstrong, E.G., Nisula, B.C., 1988. Incidence of Early Loss of Pregnancy. New England Journal of Medicine 319, 189–
194. https://doi.org/10.1056/NEJM198807283190401
Wood, I.B., Varela, P.L., Bollen, J., Rocha, L.M., Gonçalves-Sá, J., 2017. Human Sexual Cycles are Driven by Culture and Match Collective Moods. Scientific Reports 7, 17973. https://doi.org/10.1038/s41598-017- 18262-5
Yaeram, J., Setchell, B.P., Maddocks, S., 2006. Effect of heat stress on the fertility of male mice in vivo and in vitro. Reprod. Fertil. Dev. 18, 647–653. https://doi.org/10.1071/RD05022
16
Zhang, M.-H., Shi, Z.-D., Yu, J.-C., Zhang, Y.-P., Wang, L.-G., Qiu, Y., 2015. Scrotal heat stress causes sperm chromatin damage and cysteinyl aspartate-spicific proteinases 3 changes in fertile men. J Assist Reprod Genet 32, 747–755. https://doi.org/10.1007/s10815-015-0451-0
Zinaman, M.J., Clegg, E.D., Brown, C.C., O’Connor, J., Selevan, S.G., 1996. Estimates of human fertility and pregnancy loss. Fertility and Sterility 65, 503–509. https://doi.org/10.1016/S0015-0282(16)58144-8
17 Appendix
Figures
Fig. A1. Historical relationship between temperature and conception rates
Notes: The estimated coefficients for all temperature categories applying the baseline specification (Equation (3)).
The squares show the effects of exposure to days with different average temperatures on current and future conception rates up to 25 weeks (relative to a day with a mean temperature of 15–20°C). The error bars represent 95% confidence intervals. The outcome variable is the log conception rate. Conception rate is defined as the number of conceptions per week per 100,000 women aged 16–44. The model has county-by-year fixed effects, county-by-calendar-week fixed effects, and county-by-week quadratic time trends county by month-of-year specific linear time trends. We control for precipitation and the share of non-working days. We weight by the counties’ average female population size (aged 16–44) between 1980 and 2015. Standard errors are clustered by county and time.
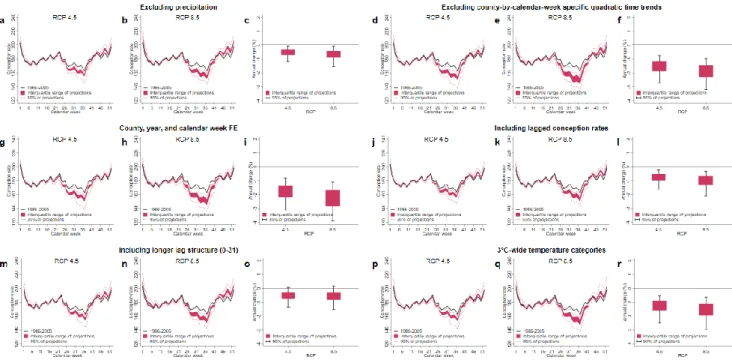
18 Fig. A2. Results of the sensitivity tests
Notes: (a,c,e,g) The effects of exposure to a day with an average temperature above 25°C on current and future conception rates up to 25 weeks (relative to a day with a mean temperature of 15–20°C). (b,d,f,h) The total effects (sum of the coefficients) over weeks (lags) 0–5 and 6–25 after exposure. Conception rate is defined as the number of conceptions per week per 100,000 women aged 16–44. The error bars represent 95% confidence intervals. (a,b) Precipitation controls are excluded. (c,d) County-by-calendar-week-specific quadratic time trends are excluded.
(e,f) Time and location fixed effects are changed: only county, year, and week fixed effects are included. (g,h) Controlling for lagged conception rates. N of lags = 25. Year 1980 is excluded as lagged conception rates are missing.
19 Fig. A3. Longer lag structures
Notes: The results of the estimations of the historical temperature−conception rate relationship including additional temperature and precipitation lags. (a,c) The effects of exposure to a day with an average temperature above 25°C on current and future conception rates up to 25 weeks (relative to a day with a mean temperature of 15–20°C).
(b,d) The total effects (sum of the coefficients) over weeks (lags) 0–5 and 6–25 after exposure. The error bars represent 95% confidence intervals. The outcome variable is the log conception rate. Conception rate is defined as the number of conceptions per week per 100,000 women aged 16–44. The model has county-by-year fixed effects, county-by-calendar-week fixed effects, and county-by-week quadratic time trends county by month-of-year specific linear time trends. We control for precipitation and the share of non-working days. We weight by the counties’ average female population size (aged 16–44) between 1980 and 2015. Standard errors are clustered by county and time. (a,b) Including three additional temperature and precipitation lags (lags 26–28). (c,d) Including six additional temperature and precipitation lags (lags 26–31).
20
Fig. A4. Estimated impacts using 3°C-wide temperature categories
Notes: Estimations of the historical temperature−conception rate relationship using 3°C-wide temperature categories. The lowest category is ≤–6°C, whereas the highest is >27°C. In this analysis 15 to 18°C serves as the reference category. (a) The effects of exposure to a day with an average temperature above 27°C on current and future conception rates up to 25 weeks (relative to a day with a mean temperature of 15–18°C). (b) The total effects (sum of the coefficients) over weeks (lags) 0–5 and 6–25 after exposure. The error bars represent 95% confidence intervals. The outcome variable is the log conception rate. Conception rate is defined as the number of conceptions per week per 100,000 women aged 16–44. The model has county-by-year fixed effects, county-by-calendar-week fixed effects, and county-by-week quadratic time trends county by month-of-year specific linear time trends. We control for precipitation and the share of non-working days. We weight by the counties’ average female population size (aged 16–44) between 1980 and 2015. Standard errors are clustered by county and time.
21
Fig. A5. Placebo tests with weather 1 year, 2 years, or 3 years later
Notes: Results of the placebo regressions where temperature and precipitation variables are replaced with weather data measured exactly one, two or three years later. Because conception rates could not have been affected by temperature in the distant future, zero or close to zero coefficients should be observed (a,c,e) The effects of exposure to a day with an average temperature above 25°C on current and future conception rates up to 25 weeks (relative to a day with a mean temperature of 15–20°C). (b,d,f) The total effects (sum of the coefficients) over weeks (lags) 0–5 and 6–25 after exposure. The error bars represent 95% confidence intervals. The outcome variable is the log conception rate. Conception rate is defined as the number of conceptions per week per 100,000 women aged 16–44. The model has county-by-year fixed effects, county-by-calendar-week fixed effects, and county-by-week quadratic time trends county by month-of-year specific linear time trends. We control for precipitation and the share of non-working days. We weight by the counties’ average female population size (aged 16–44) between 1980 and 2015. Standard errors are clustered by county and time.
22
Fig. A6. Sensitivity of the projected impact of climate change
Notes: Impacts on the seasonal distribution (a,b,d,e,g,h,j,k,m,n,o,q) and annual volume (c,f,i,l,o,r) of conception rates by the mid-21st century (2040–2059) applying alternative model specifications for the estimation of the historical temperature−conception rate relationship. The impacts are calculated using the projected within-model differences in temperature distribution between the periods of 1986–2005 and 2040–2059 by 21 climate models and the historical relationship between conception rates and temperature (estimated by 500 bootstrap samples).
For these graphs, conception rates in calendar week 52 are rescaled to 7 days. Conception rate is defined as the number of conceptions per week per 100,000 women aged 16–44. For further details on the different estimations of the historical temperature−conception rate relationship, see Fig. A2, Fig. A3 and Fig. A4.