O R I G I N A L P A P E R Open Access
Temperature, climate change, and human conception rates: evidence from Hungary
Tamás Hajdu1 &Gábor Hajdu2
Received: 29 April 2020 / Accepted: 30 November 2020/
#The Author(s) 2021
Abstract
In this paper, we examine the relationship between temperature and human conception rates and project the impacts of climate change by the mid-twenty-first century. Using complete administrative data on 6.8 million pregnancies between 1980 and 2015 in Hungary, we show that exposure to hot temperatures reduces the conception rate in the first few weeks following exposure, but a partial rebound is observed after that. We project that with absent adaptation, climate change will increase seasonal differences in conception rates and annual conception rates will decline. A change in the number of induced abortions and spontaneous fetal losses drives the decline in conception rates. The number of live births is unaffected.
However, some newborns will experience a shift in the timing of conception that leads to changes in in utero temperature exposure and therefore might have further consequences.
Keywords Conception rate . Fertility . Temperature . Weather . Climate change JEL codes J13 . Q54
1 Introduction
Scientists have been interested in the seasonality of human pregnancy and its associations with temperature for many decades (Mills and Senior1930; Chang et al.1963; Takahashi1964;
Stoeckel and Choudhury1972). Despite this long-standing interest, causal estimation of the relationship between temperature and overall conception rates is missing. Existing studies
https://doi.org/10.1007/s00148-020-00814-1
Responsible editor: Shuaizhang Feng
* Tamás Hajdu
hajdu.tamas@krtk.mta.hu Gábor Hajdu
hajdu.gabor@tk.mta.hu
1 Institute of Economics, Centre for Economic and Regional Studies, Budapest, Hungary
2 Institute for Sociology, Centre for Social Sciences, Budapest, Hungary
have only examined the effect of temperature on live birth rates, and they have found that exposure to hot temperature causes a decline in birth rates 9–10 months later (Seiver1989;
Lam and Miron1996; Barreca et al.2018; Cho2020). Barreca et al. (2018) also have found that this decline is followed by a partial rebound in the next 3 months. More importantly, the impacts of climate change on human conceptions remain unexplored, even though the projected warming of the climate has prompted numerous studies of its effects on natural and human systems (Dell et al.2014; Carleton and Hsiang2016; Scheffers et al.2016).
While there is no causal evidence on the relationship between temperature and the human conception rate, the related literature points toward the existence of a negative impact. First, animal experiments suggest that males exposed to high temperatures are less fertile (Burfening et al.1970; Wettemann et al.1979; Jannes et al.1998; Yaeram et al. 2006; Paul et al. 2008). Evidence suggests that the decreased reproductive performance is caused by impaired sperm quality (Jannes et al.1998; Yaeram et al.
2006; Paul et al.2008). Importantly, the impact of heat exposure on the fertilization rate and sperm quality is transitory, and the strongest effects are observed not immediately after the heat stress but a couple of weeks later (Burfening et al.1970; Brito et al.2003;
Pérez-Crespo et al.2008; Hansen 2009; Houston et al. 2018; Garcia-Oliveros et al.
2020). Heat shock also influences the maturation of the oocyte (Hansen2009; Roth 2017), although the impact of preovulatory heat stress on females’conception capabil- ity is less clear (Aroyo et al.2007; Hansen2009). Second, human studies have also shown that exposure to heat suppresses spermatogenesis (Macleod and Hotchkiss 1941; Robinson et al.1968; Brown-Woodman et al.1984; Carlsen et al.2003; Wang et al.2007; Ahmad et al.2012; Garolla et al.2013; Zhang et al.2015). Similar to the animal studies, these papers report a prolonged but reversible impact on various sperm parameters. In these experiments, the indicators of sperm quality gradually worsened but returned to the baseline levels at 5–12 weeks after the end of treatment.
In this paper, we analyze the impact of ambient temperature on the overall human conception rate in a Central European country, Hungary. We use administrative data with full coverage on pregnancies recorded by the country’s health care system. Our data cover 6.8 million pregnancies with conceptions occurring between 1980 and 2015, including live births, spontaneous fetal losses, and induced abortions, incorporated into 37,440 county- year-week cells. To estimate the causal effect of temperature on the conception rate (defined by the number of conceptions per week in a given county per 100,000 women aged 16–
44 years), we exploit the presumably random year-to-year variation in the calendar week–
specific average temperature. We estimate a nonlinear temperature–conception rate relation- ship. We allow the weekly conception rate to be affected by lagged temperatures up to 25 weeks. This way, we can identify the potential delayed impacts or shifts in conception rates. Next, we combine our historical estimates with projections from 21 climate models to calculate the impact of climate change by the mid-twenty-first century (2040–2059). We project the impacts on the seasonal distribution of the conception rate and its annual level.
We find that exposure to hot temperatures (daily mean temperature > 25 °C) has a deteriorating effect on conception rates in the short term (up to 5 weeks after the exposure), showing a U-shaped pattern over the first weeks with the strongest impact ranging from 2 to 4 weeks after the exposure. In addition, we find practically zero coefficients between weeks 6 and 10 and an increased conception rate from week 11 after the exposure, which suggests that exposure to hot temperatures changes the timing of some conceptions.
We also show that seasonal differences in conception rates are likely to be larger by the mid-twenty-first century because of climate change. Conception rates in the summer and early autumn months are projected to decrease, whereas conception rates during winter and late autumn are projected to increase. In addition, the annual conception rate is projected to decline. This overall decline is primarily driven by a change in the number of induced abortions and spontaneous fetal losses rather than by a change in the number of live births. Finally, we show that although the overall number of live births will not change significantly as a result of climate change, future warming will change the season of the conception of some newborns. This shift could have important consequences on the affected newborns by altering their in utero temperature exposure.
Our study provides several contributions to the literature. To our knowledge, this is the first study that examines the impact of temperature on the human conception rate using data with full coverage on all pregnancies that are recorded by the health care system (live births, induced abortions, and spontaneous fetal losses). Although previous papers have studied the impacts on birth rates, they could not examine whether the estimated impacts are due to a change in the conception rate or are the results of a change in the risk of fetal loss (or both). As our data include clinically observed fetal losses, we can distinguish between these mechanisms. Using weekly data on conception rates, we are able to examine which pre-conception week is the most sensitive to temperature exposure. Our results may help to understand the channels through which temperature exposure influences human conceptions. Furthermore, we project the impacts of climate change on the overall human conception rate and examine the impacts by pregnancy type. Thus, our paper offers important insights into climate change policy.
2 Data 2.1 Conceptions
To calculate conception rates, we use the administrative registers of the Hungarian Central Statistical Office. These individual-level registry data cover all clinically recognized preg- nancies that end in a live birth, spontaneous fetal loss (miscarriage, stillbirth), or induced abortion between 1980 and 2016 in Hungary. In other words, they include all pregnancies that are reported to and documented by the national health care system (including public and private care as well). The de-identified microdata sets are available only for research purposes in a secure data environment of the Hungarian Central Statistical Office.
Because all these datasets contain information on the date of birth/abortion/fetal loss and pregnancy length, we can estimate the date of conception for all pregnancies. We do it in two steps. First, we estimate the first day of the last menses. Because gestation length is calculated from the first day of the last menses, and it is reported in completed weeks, we estimate the starting date of the menstrual cycle as follows:
M ¼LD−ðGL7þ3Þ ð1Þ
whereMis the first day of the last menses, LD is the last day of the pregnancy, and GL is the gestation length reported in completed weeks. Because the extra days beyond the completed weeks are dropped from the reported gestation length, the true gestational
age is 0–6 days longer than the reported one. Therefore, we calculate the first day of the last menses adding 3 days to the reported pregnancy length.
In the second step, we estimate the date of conception based on the first day of the last menses. As conception occurs within hours after ovulation (Wilcox et al.1995;
Stirnemann et al.2013), and the day of ovulation is most likely to be between the 11th and 19th day of the menstrual cycle (Lenton et al.1984; Baird et al.1995; Waller et al.
1998; Ecochard and Gougeon2000; Fehring et al.2006; Cole et al.2009; Stirnemann et al.2013), we assume that conceptions occur on the 15th day. That is, we estimate the date of conception as follows:
FD¼Mþ14 ð2Þ
where FD is the first day of the pregnancy (conception day) andMis the first day of the last menses.
Based on the estimated conception dates, we calculate conception rates at the county-year-week level defined by the number of conceptions per week per 100,000 women aged 16–44 years. We divide each year into 52 weeks, which means that the last week is 8 days long (except leap years, when it lasts 9 days). The county of conception (pregnancy) is defined by the place of residence of the mother (at the end of pregnancy). Budapest, the capital city of Hungary, is a separate administrative unit;
therefore, it is considered as an individual county.1The number of women aged 16–
44 years (at the beginning of the year) for every year and county comes from the Hungarian Central Statistical Office. These population figures are assigned to the first week of the year, and the unobserved county-week figures are estimated by linear interpolation between the years.
We exclude pregnancies with missing information on gestational age or on the exact day of the end of the pregnancy, as well as pregnancies with non-Hungarian or unknown places of residence (less than 1% of all pregnancies in total). Our final sample covers 6,788,096 pregnancies (3,866,298 live births, 2,307,327 induced abor- tions, and 614,471 spontaneous fetal deaths) with conception days estimated to be between 1980 and 2015.
Finally, we note that the estimated conception dates are biased estimations of the actual conception dates. However, because conception rates are calculated at the year- by-calendar-week level, a small bias (a couple of days) in the estimated conception date does not change the week of conception in most cases. In addition, because the bias is very likely to be random, the calculated conception rates should not be greatly influenced.
2.2 Weather data
We use weather data from the E-OBS 19.0e dataset of the European Climate Assess- ment & Dataset project (Cornes et al.2018), which provides daily weather measures for Europe at a spacing of 0.1° × 0.1° in regular latitude/longitude coordinates from 1950 to 2018. The dataset includes information on maximum, minimum, and mean temper- atures, and precipitation. We create eight binary temperature variables based on the
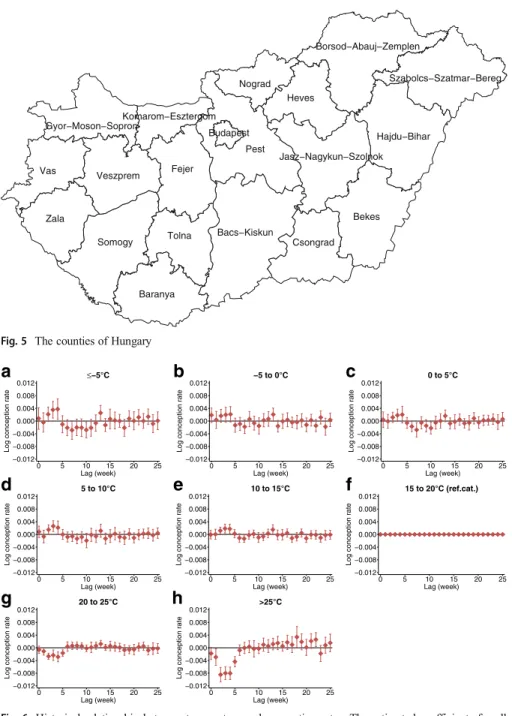
1Fig.5(Appendix) depicts the 20 counties of Hungary.
mean temperature (below−5 °C,−5 to 0 °C, 0–5 °C, 5–10 °C, 10–15 °C, 15–20 °C, 20–25 °C, over 25 °C) and four precipitation variables indicating the amount of daily precipitation (0 mm, 0–1 mm, 1–5 mm, over 5 mm) to describe the daily weather conditions at the grid points within Hungary. Next, to preserve variation in temperature, we average the new temperature and precipitation variables for each day over grid points within the 20 counties of Hungary.2
Finally, we construct weekly level measures from the daily data by summing up the variables over the weeks for each county. Accordingly, eight temperature variables show the number of days in a given week and given county when the daily mean temperature falls in a certain temperature bin (below−5 °C,−5 to 0 °C, 0–5 °C, 5– 10 °C, 10–15 °C, 15–20 °C, 20–25 °C, over 25 °C), and four precipitation variables show the number of days when the amount of daily precipitation falls in a certain precipitation bin (0 mm, 0–1 mm, 1–5 mm, over 5 mm). We note again that each year is divided into 52 weeks; therefore, calendar week 52 is 8 days long (except leap years, when it lasts 9 days). The descriptive statistics are shown in Table1.3
The weather data are matched to the conceptions by the county of the mother’s residence (at the end of pregnancy).
2.3 Climate projections
To quantify the impact of climate change by the mid-twenty-first century, we use the NASA Earth Exchange (NEX) Global Daily Downscaled Projections (GDDP) dataset, which provides daily maximum and minimum temperatures for the period from 2006 to 2100, and retrospectively simulated temperature variables between 1950 and 2005 (Thrasher et al.2012). The NEX-GDDP data contain projections of 21 climate models4 for two representative concentration pathway scenarios (RCP 4.5 and RCP 8.5). RCP 4.5 is an intermediate scenario with declining greenhouse gas (GHG) emission and stabilizing GHG concentration in the second half of the twenty-first century, whereas RCP 8.5 represents a scenario where GHG emission and concentration continue to rise (Moss et al. 2010). Each climate projection is downscaled at a spatial resolution of 0.25° × 0.25°.
We calculated daily mean temperature as the mean of the maximum and minimum temperature. As for the historical weather data, we created eight temperature indicators to describe the daily weather conditions at the grid points located within the borders of Hungary (avg. daily temperature is below−5 °C,−5 to 0 °C, 0–5 °C, 5–10 °C, 10–
15 °C, 15–20 °C, 20–25 °C, over 25 °C). To obtain the projected temperature on a specific day in a given county, we simply averaged the eight temperature variables over the grid points located within the counties. Using these estimations, we calculate the distribution of temperature (i) in the period of 2040–2059 for the 42 climate projections
2For each county, the average annual number of days when the daily mean temperature falls in the eight temperature bins is summarized in Table S1 of the Supplementary Materials (Hajdu and Hajdu2020a).
3The distribution of the number of days with different temperatures across calendar weeks at the country level is shown in Fig. S1 of the Supplementary Materials (Hajdu and Hajdu2020a).
4The climate models are ACCESS1-0, BCC-CSM1-1, BNU-ESM, CanESM2, CCSM4, CESM1-BGC, CNRM-CM5, CSIRO-MK3-6-0, GFDL-CM3, GFDL-ESM2G, GFDL-ESM2M, INMCM4, IPSL-CM5A- LR, IPSL-CM5A-MR, MIROC-ESM, MIROC-ESM-CHEM, MIROC5, MPI-ESM-LR, MPI-ESM-MR, MRI-CGCM3, and NorESM1-M. They were developed for the Fifth Assessment Report of the IPCC.
(21 models and two RCPs) and (ii) in the period of 1986–2005 for the 21 climate models by county and calendar week. Next, to make a projection for the whole country, we averaged the county-level temperature distributions using the female population aged 16–44 years between 1980 and 2015 as weights. For the calculation of the projected impacts of climate change, we used these country-level (national) averages.
The within-model changes were calculated as the difference between the periods of 2040–2059 and 1986–2005. To investigate the impact of climate change on conception rates, we use the projected changes by calendar week.
3 Empirical strategy
3.1 Relationship between temperature and conception rates
We model the temperature–conception rate relationship at the county-week level. We estimate the following equation via ordinary least squares:
lnð Þ ¼Yct ∑
j ∑25
k¼0βkjTc t−kjð Þþ∑
h
∑25
k¼0γhkPhc t−kð ÞþτXtþδcwþηcyþλacwtþλbcw
t2þεct ð3Þ
whereYis the conception rate in countycat timet(yeary, weekw) andTis a vector of variables indicating the distribution of daily mean temperature in countycat timet. The temperature variables represent the number of days when the daily mean temperatures are as follows: below−5 °C,−5 to 0 °C, 0–5 °C, 5–10 °C, 10–15 °C, 15–20 °C, 20–
25 °C, or above 25 °C. In the analysis, T15–20 is the omitted category. That is, coefficient βj shows the effect of one additional day when the daily mean
Table 1 Descriptive statistics
Mean SD Min Max N
Conception rate 174.02 35.40 66.94 349.60 37,440
No. of days per week with mean temperature
≤−5 °C 0.22 0.91 0 9 37,440
−5 to 0 °C 0.68 1.50 0 8.14 37,440
0 to 5 °C 1.16 1.87 0 9 37,440
5 to 10 °C 1.11 1.77 0 7 37,440
10 to 15 °C 1.19 1.85 0 7 37,440
15 to 20 °C 1.44 2.02 0 7 37,440
20 to 25 °C 1.01 1.83 0 7 37,440
> 25 °C 0.21 0.83 0 7 37,440
Notes: Units of observations: county-by-year-by-week. Weighted by the average female population (aged 16– 44 years) of the counties between 1980 and 2015. Conception rate is defined as the number of conceptions per week per 100,000 women aged 16–44 years. Each year is divided into 52 weeks; therefore, calendar week 52 is 8 days long (except leap years, when it lasts 9 days)
temperature falls into temperature binjon the log conception rate (relative to a day with a mean temperature of 15–20 °C).Pis a vector of precipitation controls, which shows the number of days where the amount of daily precipitation falls in a certain precipitation bin (0–1 mm, 1–5 mm, over 5 mm). The omitted category is the number of days without precipitation. To study the dynamics of the temperature–
conception rate relationship, we allow the conception rate at timetto be affected by the temperature and precipitation variables up to 25 weeks prior (k= 0, 1,…, 25). That is, we examine a half-year-long exposure period.5In this specification,βkcoefficients are the effects of temperature at timeton log conception rate afterkweeks (Stock and Watson2015). That is, the series of coefficientsβ0,β1,…,β25can be interpreted as the effect of temperature at timeton current and future conception rates (up to 25 weeks after the temperature exposure).
Xis a variable controlling for the share of weekend days and holidays that fall on weekdays, at timet. County-by-calendar-week fixed effects (δcw) help account for time- invariant unobserved differences in seasonal conception rates across counties (e.g., owing to seasonal employment patterns). County-by-year fixed effects (ηcy) control for county-specific changes in the conception rate over time. These fixed effects adjust for, e.g., the county-specific effects of the 2008 economic crisis or the geographically diverse impacts of the transition to democracy. We also allow county-specific season- ality to change over time by adding county-by-calendar-week-specific quadratic time trends (λcw). In sum, the effect of temperature on conception rates is identified from inter-annual variation in the calendar week–specific temperature after adjustment for differences in county-specific seasonality and its change over time, as well as for county-specific shocks to conception rate at the year level.
We weight by the counties’ average female population size (aged 16–44 years) between 1980 and 2015. We apply a two-way clustering; standard errors are clustered by county and time (year-week). For the estimations, we used STATA package reghdfe.
We test the sensitivity of the results by a wide range of additional model specifica- tions. First, we exclude precipitation controls:
lnð Þ ¼Yct ∑
j ∑25
k¼0βkjTc t−kjð ÞþτXtþδcwþηcyþλacwtþλbcwt2þεct ð4Þ Second, we exclude county-by-week quadratic time trends:
lnð Þ ¼Yct ∑
j ∑25
k¼0βkjTc t−kjð Þþ∑
h ∑25
k¼0γhkPhc t−kð ÞþτXtþδcwþηcyþεct ð5Þ
5We use this 26-week-long exposure window as it allows us to study the long-run relationship between temperature exposure and the conception rate. Animal and human experiments show that heat exposure has a prolonged impact on fertilization rate and various sperm parameters. In addition, Barreca et al. (2018) report that hot temperatures influence birth rates 8–13 months later (the strongest effects are observed over months 9– 12). The initial decline (over months 8–10) is followed by a partial rebound (over months 11–13). This pattern suggests that hot temperatures shift some births by a few months. It is likely the result of the increased number of susceptible women after the heat exposure (due to the decreased conception probability around the time of the heat shock). Considering an exposure period of only a few weeks would miss these delayed impacts.
Third, we add year-by-season fixed effects (σys) where calendar weeks 10–22 are the spring weeks, calendar weeks 23–35 are the summer weeks, calendar weeks 36–48 are the autumn weeks, and calendar weeks 1–9 and 49–52 are the winter weeks:
lnð Þ ¼Yct ∑
j ∑25
k¼0βkjTc t−kjð Þþ∑
h ∑25
k¼0γhkPhc t−kð ÞþτXtþδcwþηcyþλacwtþλbcw
t2þσysþεct ð6Þ
Fourth, we include lagged conception rates (25 lags):
lnð Þ ¼Yct ∑25
h¼1αhlnYc t−hð Þ þ∑
j ∑25
k¼0βkjTc t−kjð Þþ∑
h
∑25
k¼0γhkPhc t−kð ÞþτXtþδcwþηcy þλacwtþλbcwt2þεct
ð7Þ Among others, we also experiment with clustering of the standard errors, estimate specifications with 28 or 31 temperature and precipitation lags, and use 3 °C wide temperature categories (≤ −6 °C,−6 to−3 °C,−3 to 0 °C, 0 to 3 °C, 3 to 6 °C, 6 to 9 °C, 9 to 12 °C, 12 to 15 °C, 15 to 18 °C, 18 to 21 °C, 21 to 24 °C, 24 to 27 °C, >
27 °C). Besides, as placebo checks, we use future weather data (measured exactly 1, 2, or 3 years later).
3.2 Projected impacts of climate change
To quantify the impacts of climate change, we combine the estimated temperature–
conception rate relationship with the projected within-model changes in temperature distribution by calendar week between the periods of 1986–2005 and 2040–2059 for Hungary. We take the estimations on the temperature–conception relationship (β coefficients in Eq. (3)) and multiply them by the projected temperature changes. We project the medium-term impacts on (i) seasonality and (ii) the annual conception rate.
To examine the impact on seasonality of conception rates, first, we calculate the projected impacts by calendar week in the following way:
Vwmr ¼exp ∑
j∑
k
βkj Tj;2040−2059 w−k
ð Þmr −Tj;1986−2005 w−k ð Þm
" #
−1 ð8Þ
whereV is the percentage change in conception rate for calendar weekw, climate modelm, and RCP r by the mid-twenty-first century. β is the estimated historical relationship between temperature binjand log conception rate for lagk(k= 0, 1,…, 25) (see Eq. (3)), andT2040–2059is a vector that shows the projected temperature distribution in the period of 2040–2059 for calendar weekw, climate modelm, and RCPr:Nof days when the daily mean temperature falls into temperature binj. Similarly, variables T1986–2005 show the N of days when the retrospectively simulated daily mean temperature falls into temperature binjin the period of 1986–2005 for calendar week wand climate modelm.
Next, we calculate the projected conception rate for the period of 2040–2059:
Y2040−2059wmr ¼ð1þVwmrÞY1986−2005w ; ð9Þ
where we simply use the percentage change in conception rate for calendar weekw, climate modelm, and RCPr(Vwmr), and multiply it with the conception rate in the baseline period (Y1986–2005).
Finally, we project the annual impact of climate change by averaging the projected weekly percentage changes using the total number of conceptions in the calendar weeks between 1986 and 2005 as weights:
Zmr ¼∑
w
fwVwmr
52 ; ð10Þ
whereZis the projected annual percentage change in the conception rate for climate modelmand RCPr.Vcomes from Eq. (8), andfis a weight variable (scaled to mean 1) based on the total number of conceptions between 1986 and 2005 in calendar weekw. To account not only for climate uncertainty but also for regression uncertainty (uncertainty in the relationship between temperature and conception), we re-estimate the regression coefficients of the baseline model specification (Eq. (3)), applying bootstrap samples (500 times, sampling with replacement). Using the 500 coefficient estimations and the projections of the 21 climate models, we construct 10,500 possible projections (21*500) for each RCP scenario, by which we can incorporate both climate and regression uncertainty into the projected impacts of climate change (Burke et al.
2015).
We note that our calculations assume that the future relationship between temper- ature and the conception rate will be the same as in the past.
4 Results
4.1 Historical relationship between temperature and conception rates
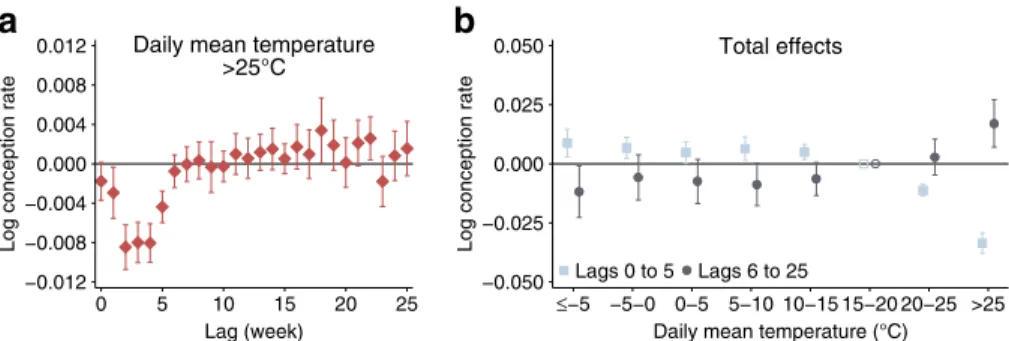
Estimating the historical relationship between temperature and conception rates, we find that exposure to a hot day (daily mean temperature > 25 °C) slightly reduces conception rates in the week of the exposure (−0.18%, p= 0.068) and the following week (−0.29%, p= 0.029) compared with a day with a mean temperature of 15–20 °C (Fig. 1a). Two weeks after exposure, weekly concep- tion rates are more strongly decreased, by 0.85% (p= 0.000), whereas the coefficients on weeks 3 and 4 are both −0.80% (p= 0.000). Five weeks after exposure, the impact is lower (−0.44%, p= 0.000). Between weeks 6 and 10, the coefficients are practically zero, whereas from week 11, they begin to increase, and until week 22, they are consistently positive, indicating an increased conception rate over this period. However, most of the 95% confi- dence intervals include zero. These results suggest that exposure to hot tem- peratures changes the timing of some conceptions that do not disappear completely but are delayed by several weeks.
We investigate the possible displacement further by calculating the sum of the coefficients (total effect) over weeks (lags) 0–5 and 6–25. These calculations show the extent to which the initial change in conception rates over weeks 0–5 is compen- sated by a rebound in the later weeks. The total effect of exposure to hot temperature is
−0.034 log points over weeks 0–5 and 0.017 log points over weeks 6–25 (Fig.1b).
This suggests that approximately half of the short-term decline is compensated by a rebound within 6 months following the exposure. Nevertheless, the total impact remains negative: exposure toa> 25 °C day reduces the overall conception rate over a 26-week period by 0.06% (p= 0.012). The impacts of exposure to a 20–25 °C day are similar but lower in magnitude. The cumulative effects over weeks 0–5 and weeks 6–
25 are−0.011 and 0.003 log points, respectively (see also Fig.6in the Appendix for the individual coefficients). Importantly, temperature exposure seems to have a mono- tonic, nonlinear effect. Colder temperatures below the omitted category have small positive effects over weeks 0–5 and small negative effects over weeks 6–25, with no apparent differences between temperature categories. In sum, temperatures between≤
−5 °C and 15–20 °C seem to have more or less similar impacts on the conception rate, but as temperature increases above 20 °C (and especially above 25 °C), conception rates decrease in the short term (up to 5 weeks after the exposure) and partially rebound after that.
In theory, three mechanisms can drive the decline in conception rates over the next few weeks after the heat exposure. First, heat might reduce sexual activity. Second, it could change conception chance. Third, it might influence the chance of a clinically unrecognized loss of an embryo. Unfortunately, the data we use do not allow us to determine the exact importance of these channels. However, that we see a small effect in the week of the exposure and larger effects later suggests that hot weather has no sizeable negative influence on sexual behavior. Indeed, previous studies report that heat does not decrease sexual activity (Hajdu and Hajdu 2019), but interest in sex is
Daily mean temperature
>25°C
−0.012
−0.008
−0.004 0.000 0.004 0.008 0.012
Log conception rate
0 5 10 15 20 25
Lag (week)
a
Total effects−0.050
−0.025 0.000 0.025 0.050
Log conception rate
≤−5 −5−0 0−5 5−10 10−15 15−20 20−25 >25 Daily mean temperature (°C) Lags 0 to 5 Lags 6 to 25
b
Fig. 1 Historical relationship between temperature and conception rates.aThe effects of exposure to a day with a mean temperature above 25 °C on current and future conception rates up to 25 weeks (relative to a day with a mean temperature of 15–20 °C).bThe total effects (sum of the coefficients) over weeks (lags) 0–5 and 6–25 after the exposure. All estimates are based on Eq. (3). The error bars represent 95% confidence intervals.
The outcome variable is the log conception rate. Conception rate is defined as the number of conceptions per week per 100,000 women aged 16–44 years. The model has county-by-year fixed effects, county-by-calendar- week fixed effects, and county-by-calendar-week-specific quadratic time trends. We control for precipitation and the share of non-working days. We weight by the counties’average female population size (aged 16– 44 years) between 1980 and 2015. Standard errors are clustered by county and time (year-week)
rather driven by holidays and cultural/religious celebrations (Wood et al.
2017).6 The second channel might be an important one. As mentioned before, experiments with mammals suggest that the conception chance is diminished by heat exposure (Wettemann et al.1979; Jannes et al. 1998; Yaeram et al. 2006;
Paul et al. 2008). Human studies report that heat suppresses spermatogenesis (Macleod and Hotchkiss 1941; Robinson et al. 1968; Brown-Woodman et al.
1984; Carlsen et al. 2003; Wang et al. 2007; Ahmad et al. 2012; Garolla et al.
2013; Zhang et al. 2015). Although the results of these papers are not directly comparable with our study, they are similar in that they usually report a prolonged but reversible (U-shaped) impact on various sperm parameters. This suggests that exposure to heat decreases the conception rate by reducing human reproductive health (e.g., sperm quality). Finally, because a sizeable portion of human pregnancies ends in a clinically unrecognized pregnancy loss (Wilcox et al. 1988; Zinaman et al. 1996) and therefore is not included in any admin- istrative dataset, we cannot rule out that exposure to hot weather before the conception also diminishes the survival probability of the fetus (before clinical recognition).
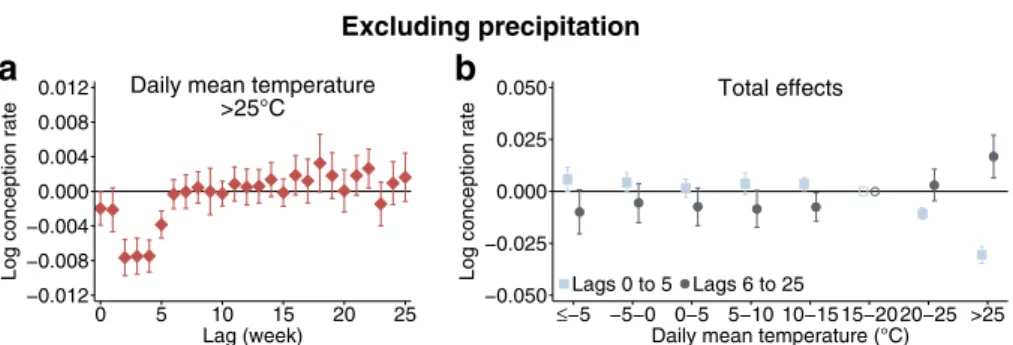
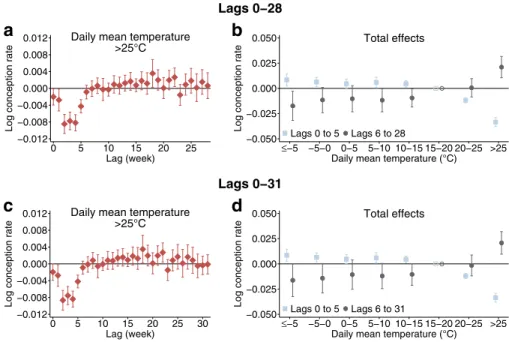
We test the sensitivity of the results by a wide range of additional model specifica- tions: controlling for lagged weekly conception rates (up to 25 weeks), excluding precipitation controls, including year-by-season fixed effects, excluding county-by- week quadratic time-trends (Fig.7, Appendix), including more temperature lags (Fig.
8, Appendix), applying alternative clustering of the standard errors (Fig. S2 of the Supplementary Materials, Hajdu and Hajdu 2020a), and using the total number of women as the denominator in the calculation of the conception rate (Fig. S3 of the Supplementary Materials, Hajdu and Hajdu2020a). We also use narrower (3 °C wide) temperature categories (Fig.9, Appendix), estimate the relationship between tempera- ture and conception rates on an aggregated (country level) dataset (Fig. S4 of the Supplementary Materials, Hajdu and Hajdu2020a), and estimate a polynomial distrib- uted lag specification where the temperature (and precipitation) coefficients are defined as a 6th order polynomial (Fig. S5 of the Supplementary Materials, Hajdu and Hajdu 2020a).7We also use daily minimum or maximum temperature instead of daily mean temperature (Fig. S6 of the Supplementary Materials, Hajdu and Hajdu2020a). The results using 3 °C wide temperature categories suggest that the effect of temperature is increasing past 25 °C. In addition, some of the alternative specifications result in slightly smaller and less precise estimates. Nevertheless, none of these changes alters the main conclusions.
No apparent differences are observed between the earlier and later years in our sample, counties below and above the median per capita income, or counties below and above the median yearly average temperature (Fig. S7–S9 of the Supplementary Materials, Hajdu and Hajdu2020a). These results are not surprising as our sample covers a relatively short period, and the differences across the counties in terms of per capita income or yearly average temperature are usually not very large.
6In contrast, Wilde et al. (2017) find that high temperature slightly decreases sexual activity in sub-Saharan Africa.
7For further details on this approach, see, e.g., Greene (2002), and for an application Barwick et al. (2018).
These results are very similar even if a 5th or 7th order polynomial is used.
In addition, as placebo tests, the temperature and precipitation variables are replaced with weather data that were measured exactly 1, 2, or 3 years later. Because conception rates could not have been affected by temperature in the distant future, zero or close to zero coefficients should be observed in the placebo regressions. These estimations further support the credibility of the baseline results (Fig.10, Appendix). In general, as expected, the estimated individual coefficients are usually insignificant. The total impacts show fairly random patterns.
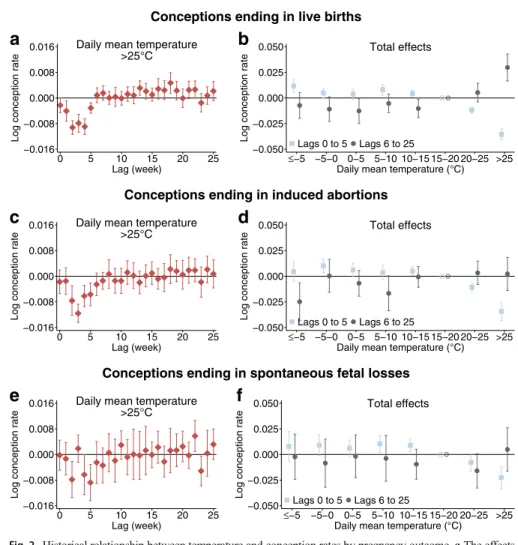
We also estimated Eq. (3) separately for conceptions ending in live births, induced abortions, and spontaneous fetal losses. These results are depicted in Fig. 2. The impacts over lags 0–5 are similar, although for the less frequent pregnancy outcomes, the statistical uncertainty is much higher. However, we can observe important differences over lags 6–25. For conception rates calcu- lated from pregnancies ending in live births, the rebound is substantial and mirrors the initial impacts.8 But for conception rates calculated from pregnan- cies ending in induced abortions and spontaneous fetal losses, a similar rebound is basically non-existing. These results are likely to reflect that individuals who desire to have a baby are very likely to eventually have one, even if it is delayed because of exposure to hot weather. However, if heat exposure pre- vents an unintended pregnancy, then it is less likely that the “missing” con- ception will be replaced by another pregnancy a couple of months later.
Because most pregnancies ending in live births are planned/intended in Central and Eastern Europe (Bearak et al. 2018), it is not surprising that we can observe a large rebound. In contrast, induced abortions are much more likely to be the result of unplanned pregnancies. Therefore, a sizeable rebound after the initial decline due to exposure to heat is not expected when analyzing conception rates calculated from pregnancies ending in induced abortions.
Regarding spontaneous fetal losses, numerous factors may contribute to the observed pattern of the estimated impacts (lack of rebound). First, unplanned pregnancies have higher odds of miscarriage (Maconochie et al. 2007). Second, some intended conceptions from the summer months (when they are more likely to be exposed to heat) are likely to occur a couple of months later as a result of the heat exposure. This shift, however, influences in utero temper- ature exposures of the fetuses. Their first trimester exposure to hot days will decrease, whereas their exposure during the second and especially third trimes- ters will increase. Because animal studies suggest that heat exposure during early pregnancy increases embryo loss (Ulberg and Burfening 1967; Edwards et al. 2003; Romo-Barron et al. 2019), this decreased first trimester exposure to hot days could lower the risk of miscarriage. Therefore, conceptions ending in a spontaneous fetal loss will increase to a lesser extent over weeks 6–25 after the exposure than a simple delay in the time of conception would predict.
8We note that the estimations using conception rates calculated from live birth data are in line with the results of Barreca et al. (2018) who studied the effect of temperature on birth rates. The result that exposure to hot temperatures decreases conception (ending in live births) in the next 6 weeks corresponds to a decrease in birth rates 9–10 months later. Also, the increase in conception rates at 6–25 weeks (and especially at 13–22 weeks) after the exposure is in line with the delayed rebound in births reported by Barreca et al. (2018).
4.2 Projected impacts of climate change
To quantify the impacts of climate change, the estimated temperature–conception rate relationship is combined with the projected changes in temperature distribution be- tween the periods of 1986–2005 and 2040–2059 by calendar week. First, we show the projections for the overall conception rate. Next, we replicate these projections by
Daily mean temperature
>25°C
−0.016
−0.008 0.000 0.008 0.016
Log conception rate
0 5 10 15 20 25
Lag (week)
a
Total effects−0.050
−0.025 0.000 0.025 0.050
Log conception rate
≤−5 −5−0 0−5 5−10 10−15 15−20 20−25 >25 Daily mean temperature (°C) Lags 0 to 5 Lags 6 to 25
b
Conceptions ending in live births
Daily mean temperature
>25°C
−0.016
−0.008 0.000 0.008 0.016
Log conception rate
0 5 10 15 20 25
Lag (week)
c
Total effects−0.050
−0.025 0.000 0.025 0.050
Log conception rate
≤−5 −5−0 0−5 5−10 10−15 15−20 20−25 >25 Daily mean temperature (°C) Lags 0 to 5 Lags 6 to 25
d
Conceptions ending in induced abortions
Daily mean temperature
>25°C
−0.016
−0.008 0.000 0.008 0.016
Log conception rate
0 5 10 15 20 25
Lag (week)
e
Total effects−0.050
−0.025 0.000 0.025 0.050
Log conception rate
≤−5 −5−0 0−5 5−10 10−15 15−20 20−25 >25 Daily mean temperature (°C) Lags 0 to 5 Lags 6 to 25
f
Conceptions ending in spontaneous fetal losses
Fig. 2 Historical relationship between temperature and conception rates by pregnancy outcome.aThe effects of exposure to a day with a mean temperature above 25 °C on current and future conception rates up to 25 weeks (relative to a day with a mean temperature of 15–20 °C).bThe total effects (sum of the coefficients) over weeks (lags) 0–5 and 6–25 after the exposure. All estimates are based on Eq. (3). The error bars represent 95% confidence intervals. The outcome variable is the log conception rate calculated from live births (a,b), induced abortions (c,d), or spontaneous fetal losses (e,f). Conception rate is defined as the number of conceptions per week per 100,000 women aged 16–44 years. The model has county-by-year fixed effects, county-by-calendar-week fixed effects, and county-by-calendar-week-specific quadratic time trends. We control for precipitation and the share of non-working days. We weight by the counties’average female population size (aged 16–44 years) between 1980 and 2015. Standard errors are clustered by county and time (year-week)
conception type (pregnancy outcome). We present interquartile ranges and the ranges containing 95% of the projections.
Seasonal differences in conception rates are likely to be larger by the mid- twenty-first century because of climate change (Fig. 3a and b). We project a substantial decline between the 23rd and 42nd calendar weeks as a result of the increase in the number of hot days. The impacts are especially large for calendar weeks 30 to 38: the median projections in RCP 8.5 reflect a decline of between 5.5 and 7.5%. At the same time, conception rates are projected to increase in the first calendar weeks and especially in the last 10 weeks of the year. Regarding the annual impact of climate change, practically all projections suggest a decline in annual conception rates (Fig. 3c). The interquartile ranges of the projections spread from −0.92% to −0.47% for RCP 4.5 and from − 1.18% to −0.61% for RCP 8.5.
Using alternative model specifications to estimate the historical temperature– conception rate relationship, in most cases, does not considerably alter the projected impacts of climate change (Fig. 11, Appendix). However, using narrower (3 °C wide) temperature categories results in a slightly stronger projected impact. This specification allows to account for the fact that the effect of temperature is increasing past 25 °C (see Fig. 9, Appendix), and the average temperature within the > 25 °C category will increase in the future (Fig. S10 of the Supplementary Materials, Hajdu and Hajdu 2020a). Neverthe- less, the qualitative results are the same in all these estimations: seasonal differences in conception rates will increase because of climate change, and the annual rates will decrease by a few percent during the next decades.9
Next, we calculate the impacts of climate change by conception type. We use historical estimates on the temperature–conception rate relationship from
RCP 4.5
120140160180200220240
Conception rate
1 11 21 31 41 51
Calendar week 1986−2005 Interquartile range 95% of projections
a
RCP 8.5
120140160180200220240
Conception rate
1 11 21 31 41 51
Calendar week 1986−2005 Interquartile range 95% of projections
b
−4−3−2−1012
Annual change (%)
4.5 8.5
RCP Interquartile range 95% of projections
c
Fig. 3 Projected impact of climate change on conception rates. Impacts on the seasonal distribution (a,b) and annual volume (c) of conception rates by 2040–2059. The impacts are calculated using the projected within- model differences in temperature distribution between the periods of 1986–2005 and 2040–2059 by 21 climate models and the historical relationship between conception rates and temperature from Eq. (3) (estimated by 500 bootstrap samples). For these graphs, conception rates in calendar week 52 are rescaled to 7 days.
Conception rate is defined as the number of conceptions per week per 100,000 women aged 16–44 years.
9The interquartile ranges and the ranges containing 95% of the projections for the overall impacts are summarized in Table S2 of the Supplementary Materials (Hajdu and Hajdu2020a).
models where conception rates were calculated from pregnancies ending in (i) live births, (ii) induced abortions, or (iii) spontaneous fetal losses, and combine them with the projected temperature changes as was done before. Seasonal differences in conception rates will be larger for all kinds of conceptions (Fig. 4a, b, d, e, g, h). Conception rates in the summer and early autumn months are projected to decrease, whereas conception rates during winter and late autumn are projected to increase. A notable difference is that the winter/
autumn increase is more significant for live births than for spontaneous fetal
RCP 4.5
7090110130
Conception rate
1 11 21 31 41 51
Calendar week 1986−2005 Interquartile range 95% of projections
a
RCP 8.57090110130
Conception rate
1 11 21 31 41 51
Calendar week 1986−2005 Interquartile range 95% of projections
b
−6−4−202
Annual change (%)
4.5 8.5
RCP Interquartile range 95% of projections
c
Conceptions ending in live births
RCP 4.5
405060708090
Conception rate
1 11 21 31 41 51
Calendar week 1986−2005 Interquartile range 95% of projections
d
RCP 8.5405060708090
Conception rate
1 11 21 31 41 51
Calendar week 1986−2005 Interquartile range 95% of projections
e
−6−4−202
Annual change (%)
4.5 8.5
RCP Interquartile range 95% of projections
f
Conceptions ending in induced abortions
RCP 4.5
1113151719
Conception rate
1 11 21 31 41 51
Calendar week 1986−2005 Interquartile range 95% of projections
g
RCP 8.51113151719
Conception rate
1 11 21 31 41 51
Calendar week 1986−2005 Interquartile range 95% of projections
h
−6−4−202
Annual change (%)
4.5 8.5
RCP Interquartile range 95% of projections
i
Conceptions ending in spontaneous fetal losses
Fig. 4 Projected impact of climate change by conception type. The impacts on the seasonal distribution of conceptions ending in live births (a,b), induced abortions (d,e), and spontaneous fetal losses (g,h) by 2040– 2059. The impacts on annual volume of conception rates in live births (c), induced abortions (f), and spontaneous fetal losses (i) by 2040–2059. The impacts are calculated using the projected within-model differences in temperature distribution between the periods of 1986–2005 and 2040–2059 by 21 climate models and the historical relationship between conception rates and temperature (estimated by 500 bootstrap samples). For these graphs, conception rates in calendar week 52 are rescaled to 7 days. Conception rate is defined as the number of conceptions (ending in live births/induced abortions/spontaneous fetal losses) per week per 100,000 women aged 16–44 years
losses or induced abortions. As a result, the differences in terms of annual impacts are substantial (Fig.4c, f, i). The overall conception rate based on live births seems to be unaffected by a climate change–induced shift in temperature distribution, whereas the annual conception rates based on induced abortions and spontaneous fetal losses are projected to decline by a few percent. That is, the annual decline in overall conception rate (Fig. 3c) is primarily driven by a change in the number of induced abortions and spontaneous fetal losses rather than by a change in the number of live births.
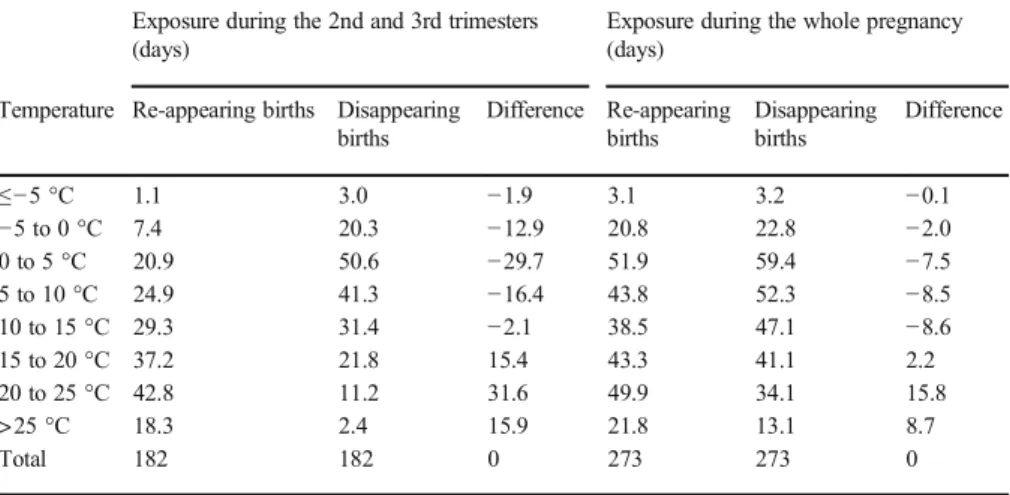
We note that although the annual conception rate based on live births (in other words, the number of births) will not change significantly as a result of climate change, the changing seasonal distribution of conceptions could have important consequences on the affected newborns. The warming climate will induce a shift in the timing of conception for a small fraction of live births. In general, concep- tions will disappear from the summer months and will re-appear mostly in the winter and late autumn months (Fig. S11 of the Supplementary Materials, Hajdu and Hajdu2020a).10 Because of this shift, as highlighted before, the exposure of fetuses to hot days during the second and third trimesters of pregnancy will substantially increase, whereas the first trimester exposure will drop (Fig. S12 of the Supplementary Materials, Hajdu and Hajdu2020a). A crude estimation sug- gests that the affected newborns will be exposed, on average, to around 16 additional hot days (> 25 °C) and 32 additional moderately hot days (20–25 °C) during the second and third trimesters due to the change in the conception date (Table 2, Appendix). Considering the whole pregnancy, these figures are 9 and 16 days, respectively. At the same time, the exposure to cold days will substan- tially decrease. Because there is a negative relationship between in utero exposure to hot weather (especially in the second and third trimesters) and health at birth (Deschênes et al. 2009; Sun et al. 2019; Hajdu and Hajdu 2020b; Barreca and Schaller2020; Chen et al.2020), the slight change in timing of conception could have a non-negligible impact. Further consequences are also possible, as temper- ature exposure during pregnancy influences adult outcomes too (Wilde et al.2017;
Isen et al.2017; Fishman et al.2019; Hu and Li2019).
5 Conclusion
Using complete administrative data from Hungary, we find that exposure to heat has a deteriorating effect on conception rates in the short term (up to 5 weeks after the exposure), showing a U-shaped pattern over this period with the strongest impact ranging from 2 to 4 weeks after the exposure. In addition, we find practically zero coefficients between weeks 6 and 10, and an increased conception rate from week 11 after the exposure, which suggests that exposure to hot temperatures changes the timing of some conceptions. However, we note that our results do not necessarily mean that hot temperature has a negative impact on the conception rate only up to 5 weeks following the exposure.
10The definition and calculation of disappearing and re-appearing live births are provided in the notes of Fig.
S11 of the Supplementary Materials (Hajdu and Hajdu2020a).
Some pregnancies that fail to start due to exposure to hot weather (in the first weeks after the exposure) might experience a shift in conception date as little as one menstrual cycle and might occur 5–10 weeks after the exposure. This shift might veil the negative effects over this period.
Our calculations suggest that climate change–induced shift in temperature distribution will influence human conception. Seasonal differences in conception rates will be larger by the mid-twenty-first century, and the annual conception rate is projected to decline. We also find that the overall live birth rate, unlike the overall rate of induced abortions and spontaneous fetal losses, seems to be unaffected. However, future warming will change the season of the conception of some newborns, which will influence their in utero temperature exposure and thus might reduce their health at birth and affect later life outcomes.
Finally, we note that our findings are based on data from Hungary and cannot necessarily be generalized to other countries. However, climatic condi- tions are very similar in many European countries; thus, our results might be relevant for a larger geographic area. Nevertheless, further studies should assess how temperature and climate change might influence conceptions in other parts of the world. In addition, more research is needed to analyze the specific mechanisms that drive the temperature–conception rate relationship.
Acknowledgments We are grateful to two anonymous referees and the editor, Shuaizhang Feng, for their help and guidance in the review process. We acknowledge climate scenarios from the NEX-GDDP dataset, prepared by the Climate Analytics Group and NASA Ames Research Center using the NASA Earth Exchange, and distributed by the NASA Center for Climate Simulation (NCCS). We also acknowledge the E-OBS dataset from the EU-FP6 project UERRA (http://www.uerra.eu) and the data providers in the ECA&D project (https://www.ecad.eu). The present study has been produced using the live birth, induced abortion, and fetal loss records of the Hungarian Central Statistical Office (HCSO). The calculations and the conclusions are the intellectual product of the authors.
Data and code availability All data and code necessary for replication of the results in this paper are available for download athttps://figshare.com/s/6a039f7a0bbfb8d5e3e1. The original climate projections data can be downloaded fromhttps://dataserver.nccs.nasa.gov/thredds/catalog/bypass/NEX-GDDP/catalog.html.
The original weather data can be downloaded fromhttps://www.ecad.eu//download/ensembles/download.
php. Conception data have been produced using the individual-level de-identified live birth, induced abortion, and fetal loss records of the Hungarian Central Statistical Office (HCSO). The de-identified microdata sets are available only for research purposes in a secure data environment (HCSO-CERS research room). Supple- mentary figures and tables (Hajdu and Hajdu2020a) are available for download athttps://doi.org/10.6084/m9.
figshare.13242002.
Author contributions T.H. and G.H. designed the research and wrote the paper. T.H. analyzed the data.
Funding Open access funding provided by ELKH Centre for Economic and Regional Studies. This work was supported by the Hungarian National Research, Development and Innovation Office–NKFIH (grant no.
FK 124310). Tamás Hajdu was also supported by the Momentum (“Lendület”) Program of the Hungarian Academy of Sciences (grant no. LP2018-2/2018) and the János Bolyai Research Scholarship of the Hungarian Academy of Sciences.
Compliance with ethical standards
Conflict of interest The authors declare that they have no conflict of interest.
Appendix
Baranya
Borsod−Abauj−Zemplen
Budapest
Bacs−Kiskun
Bekes Csongrad Fejer
Gyor−Moson−Sopron
Hajdu−Bihar Heves
Jasz−Nagykun−Szolnok Komarom−Esztergom
Nograd
Pest
Somogy
Szabolcs−Szatmar−Bereg
Tolna
Vas Veszprem
Zala
Fig. 5 The counties of Hungary
−0.012
−0.008
−0.004 0.000 0.004 0.008 0.012
Log conception rate
0 5 10 15 20 25
Lag (week)
a
≤−5°C−0.012
−0.008
−0.004 0.000 0.004 0.008 0.012
Log conception rate
0 5 10 15 20 25
Lag (week)
b
−5 to 0°C−0.012
−0.008
−0.004 0.000 0.004 0.008 0.012
Log conception rate
0 5 10 15 20 25
Lag (week)
c
0 to 5°C−0.012
−0.008
−0.004 0.000 0.004 0.008 0.012
Log conception rate
0 5 10 15 20 25
Lag (week)
d
5 to 10°C−0.012
−0.008
−0.004 0.000 0.004 0.008 0.012
Log conception rate
0 5 10 15 20 25
Lag (week)
e
10 to 15°C−0.012
−0.008
−0.004 0.000 0.004 0.008 0.012
Log conception rate
0 5 10 15 20 25
Lag (week)
f
15 to 20°C (ref.cat.)−0.012
−0.008
−0.004 0.000 0.004 0.008 0.012
Log conception rate
0 5 10 15 20 25
Lag (week)
g
20 to 25°Ch
−0.012
−0.008
−0.004 0.000 0.004 0.008 0.012
Log conception rate
0 5 10 15 20 25
Lag (week)
>25°C
Fig. 6 Historical relationship between temperature and conception rates. The estimated coefficients for all temperature categories applying the baseline specification (Eq. (3)). The squares show the effects of exposure to days with different average temperatures on current and future conception rates up to 25 weeks (relative to a day with a mean temperature of 15–20 °C). The error bars represent 95% confidence intervals. The outcome variable is the log conception rate. Conception rate is defined as the number of conceptions per week per 100,000 women aged 16–44 years. The model has county-by-year fixed effects, county-by-calendar-week fixed effects, and county-by-calendar-week quadratic time trends. We control for precipitation and the share of non-working days. We weight by the counties’average female population size (aged 16–44 years) between
1980 and 2015. Standard errors are clustered by county and time