DOI:10.28974/idojaras.2018.1.6
IDŐJÁRÁS
Quarterly Journal of the Hungarian Meteorological Service Vol. 122, No. 1, January – March, 2018, pp. 81–99
Climate change impacts on the water balance - case studies in Hungarian watersheds
Péter Csáki*, Márton Miklós Szinetár, András Herceg, Péter Kalicz, and Zoltán Gribovszki
Institute of Geomatics and Civil Engineering, University of Sopron, Bajcsy-Zs. u. 4., 9400 Sopron, Hungary
*Corresponding author E-mail: csaki.peter@uni-sopron.hu (Manuscript received in final form December 18, 2017)
Abstract—Climate change will alter various components of the water balance on global, regional, and local scales; these changes will be measurable mainly through alterations of the spatial distribution and temporal trends of temperature, precipitation, and evapotranspiration. We analyzed the water balance of two Hungarian watersheds (Zala and Bácsbokodi-Kígyós) based on a spatially distributed robust hydrological model that was calibrated using actual evapotranspiration values of CREMAP (Complementary- relationship-based Evapotranspiration Mapping Technique). During the model calibration period (2000‒2008), evapotranspiration (ET) and runoff (or recharge, R) were 92% and 8%
of the precipitation amount in the Zala watershed, while in the Bácsbokodi-Kígyós watershed it was 75% and 25%. A climate-runoff model was developed to evaluate the effects of climate change on the water balance. Long-term ET and R averages can be calculated applying a spatially distributed Budyko-model at a resolution of 1 km × 1 km. In the case of the surplus water affected areas where ET exceeds precipitation, ET and R can be calculated with another simple model that works on the analogy of pan evaporation.
Using precipitation and temperature results of regional climate model simulations as input data, we calculated the projections of the main components of the water balance. Increasing temperatures in the 21st century are projected to cause a slight increase in evapotranspiration relative to the reference period 1981‒2010; this may cause a substantial reduction of long-term runoff. The mean decrease can exceed 53% for the Zala and 38%
for the Bácsbokodi-Kígyós watersheds. The decreasing runoff/recharge could limit manageable or extractable groundwater resources, alter agricultural activities, and cause a water deficit in Balaton Lake.
Key-words: climate change, evapotranspiration, runoff, Budyko-model, water balance
1. Introduction
During the 20th century, there was a worldwide average temperature increase of 0.6 °C; even greater increases have been recorded in the recent decades. Without additional mitigation (baseline scenarios), this warming trend will result in a global mean surface temperature increase of 3.7 °C to 4.8 °C by 2100 compared to pre-industrial levels (IPCC, 2014). There is also general agreement concerning regional climate change projections for Europe that show statistically significant warming for all seasons. The highest temperature increases are expected in the southern Mediterranean region (van der Linden and Mitchell, 2009). The climate of Hungary has become warmer and drier as well, with an average annual temperature increase of 0.86 °C during the 20th century (Nováky and Bálint, 2013). The warming during the last 30 years was stronger than ever before, especially in the summer periods, during which the average temperature has increased by as much as 2 °C (Bartholy et al., 2011; HREX, 2012). Depending on climate scenarios, temperatures in Hungary are projected to increase by 2 °C to 5°C until the end of the 21stcentury (Nováky and Bálint, 2013).
In addition to rising temperatures, climate change also affects precipitation.
Nevertheless, those impacts are less obvious than impacts on temperature, since the higher spatial and temporal variability can hide the average trend of the changes (Pongrácz et al., 2014). In Europe, annual precipitation projections point to an increase in the northern regions, but a decrease in the southern regions towards to the end of the 21st century (Kjellström et al., 2011). In the transition zone, where Hungary is located, the changes are smaller and statistically insignificant. However, the mean annual precipitation of the entire country decreased by one month of average precipitation (~7%) during the 20th century.
Projections show that the transition zone shifts northwards during summer, which results in decreasing precipitation in Hungary. During winter, the transition zone shifts southwards, which leads to increasing precipitation (Bartholy et al., 2008;
Nováky and Bálint, 2013; Gálos et al., 2015).
The most significant effect of climate change is its impact on the water cycle through the alteration of precipitation patterns and evapotranspiration processes at multiple scales (Szilágyi and Józsa, 2008; Sun et al., 2011; Nováky and Bálint, 2013; Pongrácz et al., 2014). In arid climates, the hydrological balance will move toward evapotranspiration, while in more humid climates, it will move toward runoff (Keve and Nováky, 2010).
The global evapotranspiration rate for continental precipitation is 70%
(ranging from approximately 60% in Europe to over 90% in Australia) (McMahon et al., 2013). In Hungary, the evapotranspiration rate is 90%, while the remaining 10% is runoff (Szilágyi and Kovács, 2011). Evapotranspiration determines water availability on land surfaces and thus controls the large scale distribution of plant communities and primary production (Vörösmarty et al., 1998). The necessity of
process is unquestionable, particularly in the context of climate change projections (Dingman, 2002). In practice, situations such as rainfall-runoff modeling, small irrigation areas, irrigated crops within a large irrigation district, and catchment water balance studies require evapotranspiration estimations with different time steps (McMahon et al., 2013).
A robust Budyko-type model that is able to estimate hydrological changes (evapotranspiration and runoff) in Hungary in high spatial resolution has not been developed so far. However, hydrological projections would prove useful in analyzing the water balance of the Balaton Lake. They could also be applied to agriculture, a major economic sector in the Carpathian Basin that is highly vulnerable to droughts (Antofie et al., 2015). This paper presents a spatially distributed climate-runoff model. A further aim is to analyze the hydrological projections for selected watersheds in Hungary that could be useful in decisions concerning water resources management.
2. Materials and methods 2.1. Study areas
The watershed is the most appropriate unit to analyze the possible hydrological impacts of climate change. The Zala and Bácsbokodi-Kígyós watersheds in Hungary were selected for comparison in this study, because they met two important criteria: the availability of regular streamflow data, and differing climatic and land use properties.
2.1.1. Zala watershed
The Zala River watershed is located in the western part of Hungary (Fig. 1) and it provides the largest inflow of water to the Balaton Lake (Virág, 1997). The area above the “Zalaapáti gauging station” (Fig. 2) covers 1520.7 km2 with a main channel length of 104 km. The long-term (1980‒2008) mean discharge is 4.6 m3s–1. The climate of the watershed is characterized as moderately cool and moderately humid with a mean annual temperature of 10.4 °C and an annual precipitation of 730 mm. The altitude ranges from 100 m a.s.l. to 334 m a.s.l.; the average is 195 m a.s.l.
The dominant land use is agriculture (57.5%; Fig. 2, Table 1), followed by forest and semi-natural areas (36.5%), and artificial surfaces (5.1%). The areas belonging to wetlands and water bodies are rather small: 0.3% and 0.6% of the total area, respectively.
Fig. 1. Location of the study areas within Hungary.
1: Zala River watershed, 2: Bácsbokodi-Kígyós watershed
Fig. 2. Land cover (by the Corine Land Cover 2006) and location of the gauging stations of the Zala River watershed (left) and the Bácsbokodi-Kígyós watershed (right).
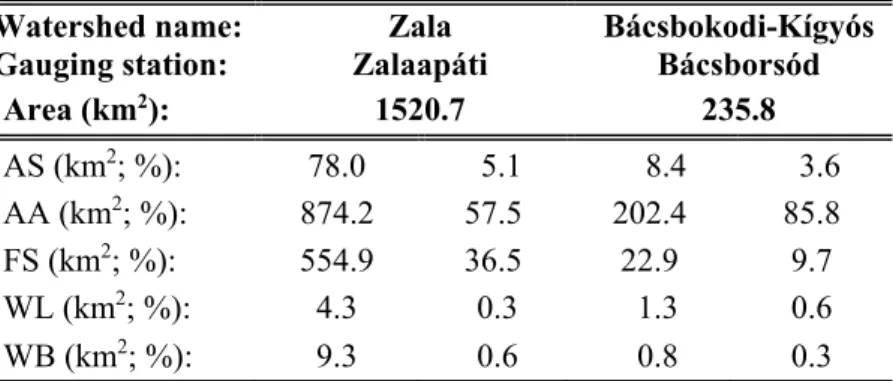
Table 1. The land cover distribution of the study areas based on the Corine Land Cover types (CLC, 2006): AS - Artificial surfaces, AA - Agricultural areas, FS - Forest and semi- natural areas, WL - Wetlands, WB - Water bodies
Watershed name: Zala Bácsbokodi-Kígyós Gauging station: Zalaapáti Bácsborsód
Area (km2): 1520.7 235.8
AS (km2; %): 78.0 5.1 8.4 3.6 AA (km2; %): 874.2 57.5 202.4 85.8 FS (km2; %): 554.9 36.5 22.9 9.7 WL (km2; %): 4.3 0.3 1.3 0.6 WB (km2; %): 9.3 0.6 0.8 0.3
2.1.2. Bácsbokodi-Kígyós watershed
The Bácsbokodi-Kígyós watershed is located in the southern part of the Great Hungarian Plain, right above the Hungarian-Serbian border (Fig. 1). The water from this area is collected by the Bácsbokodi-Kígyós Canal, from where it discharges to the Tisza through the Ferenc Canal. Long-term discharge data was available from the “Bácsborsód gauging station” at stream-km 9.2 (Fig. 2);
therefore, the investigated watershed was delineated above this point, making the area 235.8 km2 and the length of the canal 30.65 km. The long-term (1964‒2008) mean discharge is 0.126 m3 s–1. The area lies on the border of the dry and moderately dry climatic regions. The mean annual temperature is 11.7 °C, and the annual precipitation is 590 mm. The area can be described as rather flat with altitude ranges from 104 m a.s.l. to 171 m a.s.l., with an average altitude of 132 m a.s.l.
The area is famous for its outstanding agricultural potential; consequently, the dominant land use is agriculture (85.8%; Fig. 2, Table 1), followed by forest and semi-natural areas (9.7%), artificial surfaces (3.6%), wetlands (0.6%), and water bodies (0.3%).
2.2. Spatially distributed evapotranspiration and runoff
Monthly actual evapotranspiration (ETA) rates over Hungary between 2000 and 2008 have been mapped (in a resolution of 1 km × 1 km) by Szilágyi and Kovács (2010) with the Complementary-relationship-based Evapotranspiration Mapping (CREMAP) technique (Szilágyi and Kovács, 2011). It is based on a linear transformation of MODIS daytime land surface temperature values into ETA rates (Szilágyi and Józsa, 2009) using the complementary relationship of evaporation (Bouchet, 1963). The CREMAP model has been validated using water balance calculations and eddy-covariance station measurements across Hungary (Kovács,
2011). Using the monthly maps, a nine-year (2000‒2008) mean annual ETA map has been prepared. Furthermore, nine-year mean annual R (runoff) has been calculated from the long-term water balance equation as the difference between P (precipitation) and ETA. The spatially distributed precipitation and temperature data was provided by the CarpatClim project (Lakatos et al., 2013); however, the target region of this project does not cover the whole Zala watershed, so data from further stations of the Hungarian Meteorological Service were also involved in the investigations.
2.3. Model description and application
In water resources modeling, the Budyko curve (Budyko, 1974) is often used to estimate the actual evapotranspiration (ETA) as a function of the aridity index ( ).
It can be derived from two balance equations, the water balance and the energy balance (Csáki et al., 2014). Many studies have been prepared regarding the determination of the ETA − relation; some of them are summarized in Gerrits et al. (2009). Among these,the Schreiber equation is one of the best known classical studies (Schreiber, 1904).
The potential evapotranspiration by Schreiber is
= − ln , (1)
where ETP is the potential evapotranspiration (mm y-–1), P is the precipitation (mm y–1), and ETA is the actual evapotranspiration (mm y–1).
Potential evapotranspiration can also be expressed as a function of pan evaporation, according to a general relation for Hungary (Nováky, 1985, 2002):
= = = 36400 + 104 , (2)
where Epan is the pan evaporation (mm y-1; class U pan: 3 m2 water surface area, 0.5 m depth), T is the mean annual temperature (°C), and is a calibration parameter. This parameter aggregates all the factors affecting evapotranspiration, dominantly the surface cover (Keve and Nováky, 2010).
From the above equations, can be calculated as
= = −
, (3)In cases where the ETA value is higher than the P value, the parameter cannot be determined, because the natural logarithm of a negative number is indeterminable in Eq. (3). For these surplus water affected pixels, an another calibration parameter, the parameter can be calculated, which gives the relationship between Epan and ETA:
= =
. (4)The and maps can be used for calculating ETA and R in spatially distributed way; for that, only T and P data are required (Eqs. (5), (6)).
ETA calculation with is
= 1 − exp − = 1 − exp . (5)
ETA calculation with is
= = 36400 + 104 . (6)
A more detailed description of the model can be found in Csáki et al. (2014).
The spatially distributed values of the and parameters were determined using ETA, P and T maps for the 2000‒2008 period with a resolution of 1 km2. The parameters were validated for the Zala watershed, using historical precipitation and streamflow (runoff) data (Csáki et al., 2015). The validation for the Bácsbokodi-Kígyós watershed ‒ due to its unique hydrogeological features ‒ can only be implemented by accepting the assumptions described in Section 3.1.
We used Eqs. (5) and (6) to calculate spatially distributed future ETA for the study areas. The temperature and precipitation data were obtained from 12 regional climate model (RCM) simulations assuming the SRES A1B emission scenario (IPCC, 2007, van der Linden and Mitchell, 2009). The original grid size of the RCM maps was 25 km × 25 km; therefore, they were disaggregated (downscaled) to 1 km × 1 km spatial resolution by the bicubic convolution interpolation technique. The runoff was calculated as the difference between precipitation and ETA (long-term water balance equation). We completed estimations for three future time periods (2011‒2040, 2041‒2070, 2071‒2100) and determined the expected changes relative to the reference period (1981–
2010).
3. Results and discussion
3.1. Evaluation of evapotranspiration and runoff (2000‒2008)
The nine-year (2000‒2008) mean annual actual evapotranspiration and runoff maps of the Zala and Bácsbokodi-Kígyós watersheds can be seen in Fig. 3 and Fig. 4, respectively. The mean values are summarized in Table 2.
Fig. 3. Mean annual actual evapotranspiration (mm, top) and mean annual runoff (mm, bottom) over the Zala River watershed (2000‒2008, spatial resolution: 1 km2).
During the period of interest, the mean annual ETA was 569 mm in Zala, which was 92% of the annual precipitation. Higher values (610−630 mm) can be seen in the forested areas (in the western and eastern parts of the watershed, Fig. 3); the artificial surfaces (e.g., the city of Zalaegerszeg in the middle area) are characterized by lower values (450−500 mm). The mean annual R was 51 mm, which amounted to only 8% of the annual precipitation. Higher R values (100−140 mm) belonged to higher elevations and slopes (the western half) and lower values (0−30 mm) to lower elevations (the eastern half of the Zala watershed). In the cases of some surplus water affected pixels, the evapotranspiration rates surpassed the precipitation rate the area receives, e.g., the forested areas in the northeastern and southeastern parts of the watershed.
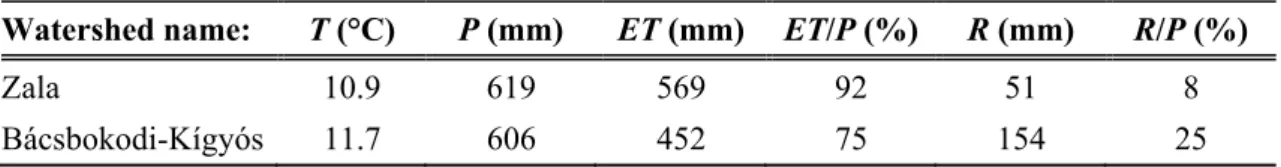
Table 2. Daily mean temperature (T), annual precipitation (P), mean annual evapotranspiration (ET) and runoff (R) for the study areas (2000‒2008)
Watershed name: T (°C) P (mm) ET (mm) ET/P (%) R (mm) R/P (%)
Zala 10.9 619 569 92 51 8
Bácsbokodi-Kígyós 11.7 606 452 75 154 25
The CREMAP ETA has been validated for the Zala watershed using the simplified water balance model. The difference between the CREMAP (569 mm y–1) and the calculated ETA (556 mm y–1; the measured streamflow is subtracted from the mean annual precipitation) was only 2.3%. The measured streamflow was available from the “Zalaapáti gauging station” (from the West- Transdanubian Water Directorate).
The mean annual ETA for the Bácsbokodi-Kígyós watershed was 452 mm, which was 75% of the annual precipitation (Table 2). The highest ETA values (550−570 mm) belong to a forested area (in the northwest corner of the watershed, Fig. 4). The artificial surfaces (e.g., Rém village in the north) and agricultural areas (on the two sides of the watershed) are characterized by lower ETA values (400−450 mm). From there, it gradually increases towards the channel system. The mean annual R was 154 mm, which was 25% of the annual precipitation amount. The R map (Fig. 4) can be considered as the inverse of the ETA map; thus, there are low R values (50−90 mm) in the case of the forested area (in the northwest corner), while higher values (150−200 mm) belong to artificial surfaces and agricultural areas.
There is a significant difference between the runoff (154 mm) and the measured streamflow (16 mm) values, which was available from the “Bácsborsód gauging station” (from the Lower Danube Valley Water Directorate). The special soil and
topological features of the area cause this deviation.The unbounded sandy soil that covers the majority of the watershed combined with the almost flat surface allows the rainwater to rapidly infiltrate the soil; thus, surface runoff occurs only in extreme situations (Pálfai, 2010). The rainwater reaching the surface can be divided into 3 categories, namely: (i) channel flow - water that reaches the channel (stream) through groundwater, (ii) vertical percolation, and (iii) deep percolation. The channel flow, as described above, was 16 mm y-1 between 2000 and 2008. The deep percolation has been induced by the increased water abstraction from the underlying confined aquifers. It was estimated to be 0 mm y-1 in the period of 1951‒1970 and has increased to 28 mm y-1 during the period 1971‒1992 (Szilágyi and Vörösmarty, 1997). Projection of this linear increment to 2000‒2008 results in an annual deep percolation of 63 mm. The vertical subsurface seepage was estimated based on two factors. One is that the value of the horizontal seepage has stayed constant (about 30 mm y-1) between 1951 and 1992. The other is that the hydraulic gradient of the groundwater surface in this area is about 2.3 times higher than the average gradient of the Danube-Tisza plateau (Szilágyi and Vörösmarty, 1997). According to Darcy’s Law, the 2.3 times higher gradient implies equally higher seepage velocity resulting in 66 mm annual value for the horizontal seepage. Summing up, these three values give a 145 mm y–1 runoff (or recharge) value for the period 2000‒2008, which differs by only 9 mm from R value determined by the CREMAP ETA (154 mm y–1).
Fig. 4. Mean annual actual evapotranspiration (mm, left) and mean annual runoff (mm,
The CREMAP ETA has been validated for the Bácsbokodi-Kígyós watershed using the simplified water balance model. The difference between the CREMAP (452 mm y–1) and the calculated ETA (461 mm y–1; the measured streamflow is subtracted from the mean annual precipitation) was only 2.0%.
3.2. Evaluation of and parameters
The and parameters have been calculated with the help of Eqs. (3) and (4).
The parameter maps for the Zala watershed can be seen in Fig. 5. Higher values appear where the land cover is mainly forest and semi-natural areas (see Fig. 2), e.g., in the western part of the Zala watershed. The parameter pixels (surplus water affected areas with higher evapotranspiration than precipitation) are situated for a forested area (in the northeast) and in the valley of the Zala River in the southeastern part of the watershed. For the Bácsbokodi-Kígyós region, we calculated only the map (Fig. 6), because there were no surplus water affected pixels. The highest values belong to the forested area in the northwest. In a previous study concerning the water balance of Bácsbokodi- Kígyós watershed, Keve and Nováky (2010) used a spatially distributed Budyko model for runoff estimation. They calibrated their model with the streamflow data without taking deep and horizontal percolating water into consideration.
Therefore, their varies in a different range, but the tendency of how its values increase from artificial areas through agricultural areas to forest areas appears to be similar.
If we compare the values of the two watersheds, the values belonging to Zala are much higher than the ones belonging to Bácsbokodi-Kígyós. The main reason for this can be the land cover as the Zala watershed has a larger forested area than the other watershed (Fig. 2, Table 1).
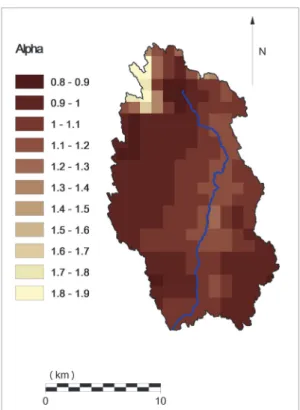
Fig. 5. The calculated Budyko-type α parameter (top) and the β parameter (bottom) over the Zala River watershed (spatial resolution: 1 km2).
Fig. 6. The calculated Budyko-type α parameter over the Bácsbokodi-Kígyós watershed (spatial resolution: 1 km2).
3.3. Evapotranspiration and runoff projections
As described above, we calculated the projected evapotranspiration using the and parameter maps (Eqs. (5) and (6)). The temperature and precipitation values for the calculations were acquired from 12 regional climate model simulations.
The long-term runoff (R) projections were calculated as the difference between precipitation and evapotranspiration. The results for three periods (2011‒2040, 2041‒2070, 2071‒2100) were compared to a reference period (1981‒2010).
Table 3 contains the mean of the projected changes (based on the 12 simulations) in mm, while Figs. 7 and 8 illustrate the projected changes of ETA and R in percent as box and whiskers plots (Venables and Ripley, 1999). According to the projections, the mean annual temperature will be higher and higher from period to period (Table 3). It is projected to be more than 3 °C higher in 2071‒2100 relative to the reference period for both study areas. However, the mean change of the annual precipitation sum is not significant; a small increase is projected for 2041‒2070, and a decrease by 9 and 12 mm for 2071‒2100, relative to the time period 1981–2010. (Compared to the period 2000‒2008, this amount of decrease
‒ 9 and 12 mm ‒ means about 1.5% and 2.0% of the annual precipitation in Zala and Bácsbokodi-Kígyós watersheds, respectively.)
Table 3. The mean projected changes (based on the simulations using the 12 regional climate models and the α−β parameter maps) of the annual temperature (dT), annual precipitation sum (dP), annual evapotranspiration (dET), and runoff (dR) for the study areas. Reference period: 1981‒2010
Watershed name: Period* dT (°C) dP (mm) dET (mm) dR (mm)
Zala 2011‒2040 0.9 1.2 10.7 –9.5
2041‒2070 2.0 9.7 28.1 –18.4
2071‒2100 3.2 –9.1 32.6 –41.7
Bácsbokodi-Kígyós 2011‒2040 0.9 –4.0 5.2 –9.2
2041‒2070 2.1 4.8 20.0 –15.2
2071‒2100 3.3 –12.2 19.5 –31.7
* Relative to the reference period (1981‒2010).
Fig. 7. The projected changes of the mean annual actual evapotranspiration (left) and runoff (right) for the Zala watershed based on the results of 12 regional climate model
Fig. 8. The projected changes of the mean annual actual evapotranspiration (left) and runoff (right) for the Bácsbokodi-Kígyós watershed based on the results of 12 regional climate model simulations. Reference period: 1981-2010. (Box: 50% of the results. Bars: minimum and maximum. Star: mean. Thick line: median.)
In the case of the Zala watershed (Fig. 7), the mean ETA change ‒ compared to the reference period (1981‒2010) ‒ shows 1.6%, 4.2%, and 4.4% increase in the first, second, and third future time period, respectively. According to the projections, the maximum increase of the ETA change can reach 12.0% by the end of the century. The spread of the ETA projections based on the simulation results of the 12 RCMs shows an increase from period to period. For R, a significant decrease can be detected in the investigated future climate periods; the mean values may decrease by 21.2%, 33.2% and 53.4% relative to the reference period.
In some extreme projections, the ETA of β-type pixels were reduced in consideration with the general rule that the long-term water balance cannot be
negative. The intensified ETA increase of the β-pixels can lead to possible serious consequences, such as the risk of the wetlands (e.g., Little-Balaton wetland area) drying out. The tendency is similar to Nováky's projections (Nováky, 2008), where the decreasing runoff and inflow from the catchments may not be enough to balance the increasing evaporation from the Balaton Lake.
The projected changes of ETA and R for the Bácsbokodi-Kígyós watershed are shown in Fig. 8. The ETA compared to the reference period shows 1.1%, 4.4%, and 4.3% mean relative increase in the first, second, and third future climate period, respectively. Spread of the ETA and R results (due to the range of the 12 regional climate model simulation results) is the largest in the last period of interest. For R, the arithmetic mean of the 12 projections shows a decrease by 15.0%, 18.5%, and 38.7%, in the investigated future periods relative to the period 1981‒2010. The maximum decrease can reach 85.3% by the end of the century.
The decrease likely not will be as strong as in the case of the Zala watershed − where the intensified ETA increase of the β-pixels will dominate −, but the decreasing usable water stock may limit agricultural activities and changes may be necessary (e.g., more irrigation, fewer water demanding crops).
4. Summary
The aim of this study was to examine the possible effects of climate change on the water balance in Hungary (for two selected watersheds), and to present a hydrological model that is able to estimate long-term evapotranspiration and runoff changes. The selected study areas were the Zala (which is the most important part of the Balaton Lake watershed) and Bácsbokodi-Kígyós watersheds.
The analysis was based on a spatially distributed robust hydrological model (1 km × 1 km resolution) which was calibrated using actual evapotranspiration values of CREMAP. In the period of 2000‒2008, the evapotranspiration (ET) and runoff (R) were 92% and 8% of the precipitation in the Zala watershed, and 75%
and 25% in the Bácsbokodi-Kígyós watershed. Higher ET rates were valid for the Zala due to the larger forest cover. The differences between the CREMAP and the watershed calculated ET (for the calibration period) for the Zala and for Bácsbokodi-Kígyós watershed were only 2.0% and 2.3%, respectively.
A climate-runoff model for evaluating the effects of climate change on ET and R was presented. The parameters of the Budyko model (α) were calculated for pixels without surplus water. For the extra water affected pixels, where the evapotranspiration exceeded the precipitation (e.g., by surface or subsurface inflow), a linear model with β parameters (actual evapotranspiration / pan evaporation) was introduced.
Since the development of the climate-runoff model includes some general
conditions. The and model parameters can be calculated if spatially distributed (long-term) evapotranspiration, temperature, and precipitation data are available. Then and can be used with regional climate models data for calculating ET and R projections in a spatially distributed way. The uncertainties of the projections stem from the following sources: uncertainty of the CREMAP ET and the measured meteorological data (used for calculating and ), and the uncertainty of the climate projections. The model ignores the land cover change in the future because there are only assumptions available about this (e.g. the extra water affected areas may decrease; there may be more artificial surfaces).
Hydrological projections for the Zala and Bácsbokodi-Kígyós watersheds have been achieved using the ‒ climate-runoff model. According to the projections, the mean annual temperature will be higher in the 21st century (by the end of the century more than 3 °C higher relative to the period 1981‒2010), while the projected change of the annual precipitation sum is not significant.
Although the spread of the projections increases with time, the tendency is clear:
the hydrological balance will move toward evapotranspiration, resulting in a decrease of the long-term runoff. By the end of the 21st century, the mean annual evapotranspiration is expected to increase by more than 4% for the Zala and Bácsbokodi-Kígyós watersheds relative to the reference period (1981‒2010). Due to the increasing temperature, the climate will be drier, a slight increase in evapotranspiration and a significant decrease in the long-term runoff can be detected; the mean decrease for the investigated watersheds can exceed 53% and 38%, respectively. This runoff decrease could lead to serious consequences for the Zala watershed including the risk of the wetlands drying out and the worsening of the average water balance of the Balaton Lake. Aridity may also increase in the Bácsbokodi-Kígyós watershed, where a reduction in utilizable water resources may limit or alter agricultural activities. These results can help provide long-term plans in several fields (water management, agriculture, forestry, etc.) and help decision makers recognize the necessary courses of action.
Acknowledgements: The research was supported by the “Agroclimate 2 (VKSZ_12-1-2013-00-34)”
EU-national joint funded research project. The research of Péter Csáki was supported by the ÚNKP-17- 3-III New National Excellence Program of the Ministry of Human Capacities. This paper was also supported by the János Bolyai Scholarship of the Hungarian Academy of Sciences. The research of Zoltán Gribovszki was supported by the European Union and the State of Hungary, co-financed by the European Social Fund in the framework of TÁMOP 4.2.4. A/2-11-1-2012-0001 'National Excellence Program'.
References
Antofie, T., Naumann, G., Spinoni, J., and Vogt, J., 2015: Estimating the water needed to end the drought or reduce the drought severity in the Carpathian region. Hydrol. Earth Syst. Sc. 19.1, 177–193.
https://doi.org/10.5194/hess-19-177-2015
Bartholy, J., Bozó, L., and Haszpra, L., 2011: Klímaváltozás – 2011, Klímaszcenáriók a Kárpát-medence térségére. MTA- ELTE Meteorológiai Tanszék. (in Hungarian)
Bartholy, J., Pongrácz, R., Gelybó, Gy., and Szabó, P., 2008: Analysis of expected climate change in the Carpathian basin using the PRUDENCE results. Időjárás 112, 249–264.
Bouchet, R.J., 1963: Evapotranspiration réelle et potentielle, signification climatique. IAHS Publ, 62, 134-142.
Budyko M.I., 1974: Climate and Life. Academic, Orlando, Fla.
CLC, 2006: Corine Land Cover. European Environment Agency, European Topic Centre for Spatial information and Analysis, Copenhagen, Denmark. Online: http://www.eea.europa.eu/data-and- maps/data/clc-2006-vector-data-version.
Csáki, P., Gyimóthy, K., Kalicz, P., Kisfaludi, B., and Gribovszki, Z., 2015: Development and validation of a climate-runoff model for the Zala River Basin. In: (Eds. Gribovszki, Z., Hlavčová, K., Kalicz, P., Kohnová, S., Carr, G.,) HydroCarpath-2015, Catchment processes in regional hydrology:
Linking experiments and modelling in Carpathian drainage basins. Vienna, Austria, University of West Hungary Press. Paper 3. 7 p.
Csáki, P., Kalicz, P., Brolly, G.B., Csóka, G., Czimber, K., and Gribovszki, Z., 2014: Hydrological impacts of various land cover types in the context of climate change for Zala County. Acta Silvatica et Lignaria Hungarica 10, 115–129. https://doi.org/10.2478/aslh-2014-0009
Dingman, S.L., 2002: Physical Hydrology (2nd edition). Prentice Hall.
Gálos, B., Führer, E., Czimber, K., Gulyás, K., Bidló, A., Hänsler, A., Jacob, D., and Mátyás, Cs., 2015:
Climatic threats determining future adaptive forest management – a case study of Zala County.
Időjárás 119, 425–441.
Gerrits, A.M.J., Savenije, H.H.G., Veling, E.J.M., Pfister, L., 2009: Analytical derivation of the Budyko curve based on rainfall characteristics and a simple evaporation model, Water Resour. Res., 45.4, W04403. https://doi.org/10.1029/2008WR007308
HREX, 2012: Éghajlati szélsőségek változásai Magyarországon: Közelmúlt és jövő. (eds. Lakatos, M., Szépszó, G., Bihari, Z., Krüzselyi, I., Szabó, P., Bartholy, J., Pongrácz, R., Pieczka, I., Torma, Cs.) http://www.met.hu/doc/IPCC_jelentes/HREX_jelentes-2012.pdf (in Hungarian)
IPCC, 2007: Climate change 2007: Synthesis Report. Contribution of Working Groups I, II and III to the Fourth Assessment Report of the Intergovernmental Panel on Climate Change (eds. Pachauri, R.K. and Reisinger) AIPCC, Geneva, Switzerland, 104 pp. http//:www.ipcc.ch.
IPCC, 2014: Climate Change 2014: Synthesis Report. Contribution of Working Groups I, II and III to the Fifth Assessment Report of the Intergovernmental Panel on Climate Change (eds. Core Writing Team, Pachauri R.K., Meyer L.A..). IPCC, Geneva, Switzerland.
Keve, G., and Nováky, B., 2010: Klímaváltozás hatásának vizsgálata a Bácsbokodi-Kígyós csatorna vízgyűjtőjén Budyko modell alkalmazásával. XXVIII. National Conference of Hungarian Hydrological Society, Sopron, 7–9th July, 2010. (in Hungarian)
Kjellström, E., Nikulin, G., Hansson, U.L.F., Strandberg, G., and Ullerstig, A., 2011: 21st century changes in the European climate: uncertainties derived from an ensemble of regional climate model simulations. Tellus A, 63, 24-40. https://doi.org/10.1111/j.1600-0870.2010.00475.x Kovács, Á., 2011: Tó- és területi párolgás becslésének pontosítása és magyarországi alkalmazásai. PhD
thesis, Budapest University of Technology and Economics. (in Hungarian)
Lakatos, M., Szentimrey, T., Bihari, Z., and Szalai, S., 2013: Creation of a homogenized climate database for the Carpathian region by applying the MASH procedure and the preliminary analysis of the data. Időjárás 117, 143-158., www.carpatclim-eu.org
van der Linden, P., and Mitchell, J.F.B. (eds.), 2009: ENSEMBLES: Climate Change and its Impacts:
Summary of research and results from the ENSEMBLES project. Met Office Hadley Centre, FitzRoy Road, Exeter EX1 3PB, UK.
McMahon, T.A., Peel, M.C., Lowe, L., Srikanthan, R., and McVicae, T.R., 2013: Estimating actual, potential, reference crop and pan evaporation using standard meteorological data: pragmatic synthesis, Hydrol. Earth Syst. Sci. 17, 1331–1363. https://doi.org/10.5194/hess-17-1331-2013 Nováky, B., 1985: A lefolyás éghajlati adottságai a Zagyva-Tarna vízrendszerben. Vízügyi Közlemények
1, 78–93 (in Hungarian)
Nováky, B., 2002: Mapping of mean annual actual evaporation on the example of Zagyva catchment area. Időjárás 106, 227–238.
Nováky, B., 2008: Climate change impact on water balance of Balaton Lake. Water Science and Technology 58, 1865–1869. https://doi.org/10.2166/wst.2008.563
Nováky, B., and Bálint, G., 2013: Shifts and Modification of the Hydrological Regime Under Climate Change in Hungary. INTECH Open Access Publisher. https://doi.org/10.5772/54768
Pálfai, I., 2010: Water-balance characteristics of the Danube-Tisza interfluvial region. Hidrol. Közl., 90, 40–44. (In Hungarian)
Pongrácz, R., Bartholy, J., and Kis, A., 2014: Estimation of future precipitation conditions for Hungary with special focus on dry periods, Időjárás 118, 305–321.
Schreiber, P., 1904: Über die Beziehungen zwischen dem Niederschlag und der Wasserführung der Flüsse in Mitteleuropa, Z. Meteorol. 21, 441–452.
Sun, G.K., Alstad, J., Chen, S., Chen, C.R., Ford, G., Lin, C., Liu, N., Lu, S.G., McNulty, H., Miao, A., Noormets, J.M., Vose, B., Wilske, M., Zeppel, Y., and Zhang Z., 2011: A general projective model for estimating monthly ecosystem evapotranspiration. Ecohydrol. 4, 245–255.
https://doi.org/10.1002/eco.194
Szilágyi, J. and Józsa, J., 2008: Klímaváltozás és a víz körforgása. Magyar tudomány, 2008, 698–-703.
(In Hungarian)
Szilágyi, J. and Józsa, J., 2009: Estimating spatially distributed monthly evapotranspiration rates by linear transformations of MODIS daytime land surface temperature data. Hydrology and Earth System Sciences, 13, 629-637.https://doi.org/10.5194/hess-13-629-2009
Szilágyi, J. and Kovács, Á., 2010: Complementary-relationship-based evapotranspiration mapping (cremap) technique for Hungary. Periodica Polytechnica. Civil Engineering, 54, 95.
https://doi.org/10.3311/pp.ci.2010-2.04
Szilágyi, J. and Kovács Á., 2011: A calibration-free evapotranspiration mapping technique for spatially- distributed regional-scale hydrologic modeling, J. Hydrol. Hydromech. 59,118–130.
Szilágyi, J. and Vörösmarty, C., 1997: Modelling unconfined aquifer level reductions in the area between Danube and Tisza rivers in Hungary, J. Hydrol. Hydromech. 45, 328–347.
Venables, W.N., and Ripley, B.D., 1999: Modern Applied Statistics with S– PLUS. Third Edition. New York: Springer. https://doi.org/10.1007/978-1-4757-3121-7
Virág, Á., 1997: A Balaton múltja és jelene. Egri Nyomda Kft., Eger. (in Hungarian)
Vörösmarty, C.J., Federer, C.A., and Schloss, A.L., 1998: Potential evaporation functions compared on US watersheds: Possible implications for global-scale water balance and terrestrial ecosystem modeling, Journal of Hydrology 207(3-4), 147-169.
https://doi.org/10.1016/S0022-1694(98)00109-7