CERS-IE WORKING PAPERS | KRTK-KTI MŰHELYTANULMÁNYOK
INSTITUTE OF ECONOMICS, CENTRE FOR ECONOMIC AND REGIONAL STUDIES, BUDAPEST, 2020
Temperature, climate change and birth weight: Evidence from Hungary
TAMÁS HAJDU – GÁBOR HAJDU
CERS-IE WP – 2020/32
July 2020
https://www.mtakti.hu/wp-content/uploads/2020/07/CERSIEWP202032.pdf
CERS-IE Working Papers are circulated to promote discussion and provoque comments, they have not been peer-reviewed.
Any references to discussion papers should clearly state that the paper is preliminary.
Materials published in this series may be subject to further publication.
ABSTRACT
We analyze the impact of in utero temperature exposure on the birth weight and prevalence of low birth weight using administrative data on singleton live births conceived between 2000 and 2016 in Hungary. We find that exposure to high temperatures during pregnancy decreases birth weight, but its impact on the probability of low birth weight is weaker. Exposure to one additional hot day (mean temperature >25°C) during the gestation period reduces birth weight by 0.5 grams.
The second and third trimesters appear to be slightly more sensitive to temperature exposure than the first trimester. We project that climate change will decrease birth weight and increase the prevalence of low birth weight by the mid-21st century. The projected impacts are the strongest for newborns conceived during the winter and spring months.
JEL codes: I10, J13, Q54
Keywords: birth weight; low birth weight; health at birth; temperature; climate change
Tamás Hajdu
Institute of Economics, Centre for Economic and Regional Studies, 1097 Budapest, Tóth Kálmán u. 4, Hungary
e-mail: hajdu.tamas@krtk.mta.hu
Gábor Hajdu
Institute for Sociology, Centre for Social Sciences, 1097 Budapest, Tóth Kálmán u. 4, Hungary
e-mail: hajdu.gabor@tk.mta.hu
Időjárás, klimaváltozás és születési súly Magyarországon HAJDU TAMÁS – HAJDU GÁBOR
ÖSSZEFOGLALÓ
Tanulmányukban a terhesség alatti hőmérséklet és a születési súly kapcsolatát vizsgáljuk a magyarországi élveszületési regiszter segítségével. Eredményeink szerint a magazti korban történő magas hőmérsékletnek való kitettség csökkenti a születési súlyt, ugyanakkor a megfigyelt hatás gyengébb az alacsony születési súllyal való születés valószínűsége esetében. A terhesség alatt a 25 fok feletti átlaghőmérsékletű napok (15-20 fokos napokhoz viszonyított) eggyel magasabb száma 0.5 grammal csökkenti a születési súlyt. A hőmérséklet hatása kissé erősebbnek tűnik második és harmadik trimeszter alatt. Becsléseink szerint a klímaváltozás hatására az átlagos születési súly csökkenése és az alacsony születési súlyú újszülöttek arányának emelkedése várható a 21. század közepére. A becsült hatások a télen és tavasszal fogant újszülöttek esetében jelentősebbek.
JEL: I10, J13, Q54
Kulcsszavak: születési súly; alacsony születési súly; születéskori egészség; időjárás;
klímaváltozás
1
Temperature, climate change and birth weight: Evidence from Hungary
Tamás Hajdua,* and Gábor Hajdub
a Institute of Economics, Centre for Economic and Regional Studies, Hungary (hajdu.tamas@krtk.mta.hu)
b Institute for Sociology, Centre for Social Sciences, Hungary (hajdu.gabor@tk.mta.hu)
* corresponding author
Abstract
We analyze the impact of in utero temperature exposure on the birth weight and prevalence of low birth weight using administrative data on singleton live births conceived between 2000 and 2016 in Hungary. We find that exposure to high temperatures during pregnancy decreases birth weight, but its impact on the probability of low birth weight is weaker. Exposure to one additional hot day (mean temperature >25°C) during the gestation period reduces birth weight by 0.5 grams. The second and third trimesters appear to be slightly more sensitive to temperature exposure than the first trimester. We project that climate change will decrease birth weight and increase the prevalence of low birth weight by the mid-21st century. The projected impacts are the strongest for newborns conceived during the winter and spring months.
JEL codes: I10, J13, Q54
Keywords: birth weight; low birth weight; health at birth; temperature; climate change
Acknowledgment
This work was supported by the Hungarian National Research, Development and Innovation Office – NKFIH (grant no. FK 124310). Tamás Hajdu was also supported by the "Lendület" program of the Hungarian Academy of Sciences (grant no. LP2018–2/2018) and the János Bolyai Research Scholarship of the Hungarian Academy of Sciences. The sources of funding had no role in study design; in the collection, analysis, and interpretation of data; in the writing of the article; and in the decision to submit it for publication. We acknowledge climate scenarios from the NEX-GDDP dataset, prepared by the Climate Analytics Group and NASA Ames Research Center using the NASA Earth Exchange, and distributed by the NASA Center for Climate Simulation (NCCS). We acknowledge the E-OBS dataset from the EU-FP6 project UERRA (http://www.uerra.eu) and the Copernicus Climate Change Service, and the data providers in the ECA&D project (https://www.ecad.eu). The present study has been produced using the live birth register of the Hungarian Central Statistical Office (HCSO). We accessed the de-identified dataset in the secure data environment of the HCSO after an accreditation process. The calculations and conclusions are the intellectual product of the authors.
2 1. Introduction
Birth weight and other indicators of health at birth predict important outcomes in later life, including childhood, adolescent and adult health, as well as educational attainment and labor market outcomes (Almond and Currie 2011; Almond, Currie, and Duque 2018; Behrman and Rosenzweig 2004; Bharadwaj, Lundborg, and Rooth 2018; Black, Devereux, and Salvanes 2007; Case, Fertig, and Paxson 2005; Currie 2009, 2011; Figlio et al. 2014). Recognizing the importance of these indicators, a growing number of papers examine how different shocks in utero influence health at birth. These studies showed that environmental factors—among others air pollution, drinking water contamination, agricultural fires, earthquakes, radiation, and toxic releases—are among the key determinants of health at birth (Coneus and Spiess 2012; Currie et al. 2013, 2014, 2015; Currie and Schmieder 2009; DeCicca and Malak 2020; Quansah et al.
2015; Rangel and Vogl 2019; Torche 2011; Tsou et al. 2019; Yang et al. 2003).
As the Earth’s climate is projected to warm rapidly in the next decades (IPCC 2014, 2018), a notable research line focuses on the impact of in utero temperature exposure on birth weight (Andalón et al. 2016; Chen et al. 2020; Davenport, Dorélien, and Grace 2020;
Deschênes, Greenstone, and Guryan 2009; Grace et al. 2015; Molina and Saldarriaga 2017;
Ngo and Horton 2016; Sun et al. 2019). These studies found that exposure to heat during pregnancy decreases birth weight and increases the probability of being born with low birth weight. However, the results regarding the impact of cold temperatures are mixed. Some studies have found that in utero exposure to cold temperatures increases birth weight (Deschênes, Greenstone, and Guryan 2009). Others have found a negative (Ngo and Horton 2016; Sun et al.
2019) or zero impact (Andalón et al. 2016; Chen et al. 2020; Molina and Saldarriaga 2017).
The results are also mixed in terms of which trimester is the most sensitive to temperature exposure.
A handful of papers examine the impacts of in utero exposure to other weather indicators on birth weight: e.g., sunshine (Trudeau, Conway, and Kutinova Menclova 2016; Zhang et al.
2020), or storms and hurricanes (Beuermann and Pecha 2020; Currie and Rossin-Slater 2013;
Simeonova 2011). Furthermore, other related literature analyzes the long-term impacts of in utero temperature exposure (Fishman, Carrillo, and Russ 2019; Hu and Li 2019; Isen, Rossin- Slater, and Walker 2017; Wilde, Apouey, and Jung 2017).
Despite the numerous studies on the relationship between in utero temperature exposure and birth weight, only two papers have dealt with the impacts of climate change. One of them quantified the impact of climate change using projections from a single climate model
3
(Deschênes, Greenstone, and Guryan 2009), by which it failed to account for the full extent of the uncertainty of future climate (Burke et al. 2015). The other one used predictions from 33 climate models (Ngo and Horton 2016), but even this study ignored regression uncertainty, which is, in this case, uncertainty in the historical relationship between temperature exposure and birth weight (Burke et al. 2015).
In this paper, we explore the impacts of in utero temperature exposure on birth weight and the probability of low birth weight. We use administrative data of the Hungarian Central Statistical Office that cover more than 1.5 million singleton live births conceived between 2000 and 2016 in Hungary. We find that temperature exposure during pregnancy has a significant impact on birth weight, whereas its effect on the probability of low birth weight is weaker.
Using historical estimates, we project the impact of climate change by the middle of the 21st century. Our calculations show that average birth weight will decrease, whereas the prevalence of low birth weight is likely to increase by 2040-2059. In addition, the projected impacts of climate change vary across births conceived in different parts of the year.
Our paper contributes to the existing literature in several ways. We explore the impact of in utero temperature exposure in a Central European country. This region was missing from the literature until now. More importantly, this is one of few papers that project the impact of climate change on birth weight and low birth weight. In these calculations, we account for both climate and regression uncertainty and show the importance of this approach. Furthermore, for the first time in the literature, we also explore the impact of climate change across the calendar weeks of conception.
2. Data
2.1. Live births
Live birth data come from the administrative registers of the Hungarian Central Statistical Office. The birth records contain detailed information on the newborns and their parents. We have information on the exact birth date, sex, birth weight, and gestational age of the newborn babies, as well as on the level of education, employment, residence, and birth date of both the mother and the father, and on the pregnancy history and marital status of the mother.
We consider two outcome variables: (1) birth weight (measured in grams), and (2) an indicator for low birth weight (LBW, birth weight<2500 g). For this analysis from the individual level birth records, we create a dataset that shows the average birth weight and prevalence of LBW in a given conception year, conception week, and county of Hungary. This dataset also contains information on the characteristics of the parents (education, employment, age, marital
4
status, pregnancy history) and the sex of the newborn. One record of our dataset shows the average characteristics of those newborns (and their parents) whose mothers lived in the same county and who were conceived in the same week of the same year.
To estimate the date of conception, we use the information on the date of birth and pregnancy length (reported in completed weeks). First, we estimate the first day of the last menses. Next, based on the medical literature (Cole, Ladner, and Byrn 2009; Fehring, Schneider, and Raviele 2006; Lenton, Landgren, and Sexton 1984; Stirnemann et al. 2013), we assume that conception occurs on the 15th day of the menstrual cycle. Using the estimated conception dates, we define the conception year and the conception week of every live birth.
For further details, see the Supplementary Materials.
We use data of newborns conceived between 2000 and 2016. The county of a live birth record is defined by the place of residence of the mother (at the time of the birth). We excluded twin births and birth records with non-Hungarian or unknown places of residence, as well as births with missing information on gestational age or birth date (less than 3% of all births in total). Our dataset covers more than 1.5 million singleton newborns (N=1,533,134) incorporated into 17,680 county-year-week cells.
We note that each year is divided into 52 weeks, which means that the last week is 8 days long (except in leap years when it lasts 9 days). In accordance with the Nomenclature of Territorial Units for Statistics (NUTS) classification system, Budapest (the capital of Hungary) is considered an individual county.
2.2. Weather data
Weather data come from the E-OBS 19.0e dataset of the European Climate Assessment &
Dataset project (Cornes et al. 2018). It provides daily weather measures for Europe with a spacing of 0.1° × 0.1° in regular latitude/longitude coordinates. Using information on mean temperatures, eight weekly level temperature indicators are created that show the number of days in a given year-week and given county when the daily mean temperature falls in a certain temperature bin (below −5°C, −5 to 0°C, 0 to 5°C, …, 15 to 20°C, 20 to 25°C, over 25°C). In addition, we create four precipitation variables that indicate the number of days when the amount of daily precipitation falls in a certain precipitation bin (0 mm, 0-1 mm, 1-5 mm, over 5 mm). For further details, see the Supplementary Materials.
2.3. Climate change projections
To calculate the impact of climate change by the mid-21st century (2040-2059), we use climate projections of 21 climate models of the NASA Earth Exchange Global Daily Downscaled
5
Projections (NEX-GDDP) dataset. This dataset provides daily maximum and minimum temperatures for the period from 2006 to 2100 and retrospectively simulated temperatures for the period of 1950-2005 (Thrasher et al. 2012). We use projected temperature changes under the representative concentration pathway scenario (RCP) 8.5, which represents a business-as- usual scenario (greenhouse gas emissions continue to rise in the twenty-first century) (Moss et al. 2010).
As for the historical weather data, we created eight temperature indicators to describe the temperature distributions in the periods of 2040-2059 and 1986-2005 by county and calendar week for each climate model. The mean temperature is calculated as the mean of the maximum and minimum temperatures. The period of 1986-2005 serves as a baseline and the within-model changes in temperatures are calculated by differencing the temperature distributions (the eight temperature variables) between 2040-2059 and 1986-2005. To make a projection for the whole country, we average the county-level temperature changes. For this aggregation, we use the counties’ average number of births conceived between 2000 and 2016 as weights. As a result, we have calendar-week-level temperature changes by climate model.
For the calculation of the projected impacts of climate change, we use these country-level changes. For further details, see the Supplementary Materials.
3. Methods
3.1. Historical relationship between temperature and birth weight
We estimate the effect of in utero temperature exposure on birth weight as follows:
38 38
j j k k
ct c(t i) c(t i) ct cy cw ct
j i 0 k i 0
Y T + P + X
= =
=
+
+ + + + (1)where Y is the average birth weight or prevalence of LBW for live births conceived at time t (year y, week w) in county c. T is a vector of weekly level temperature variables that shows the number of days in temperature category j (below −5°C, −5–0°C, 0–5°C, 5–10°C, 10–
15°C, 15–20°C, 20–25°C, or above 25°C). The temperature variables entered in the regression show the temperature exposure during the entire pregnancy, assuming a 39-week-long gestation period (started with the week of conception). In this analysis, the number of days with a mean temperature of 15-20°C is the omitted category. That is, coefficient βj shows the effect of one additional day during a 39-week-long gestation period when the daily mean temperature falls into temperature bin j on birth weight/LBW (relative to a day with a mean temperature of 15- 20°C). We use temperature exposure during a 39-week-long gestation period rather than
6
temperature exposure during the observed average gestation length, as there is a mechanical correlation between pregnancy length and the number of days when the daily mean temperature falls into different temperature bins. This approach is frequently used in the empirical in utero exposure literature (Chen et al. 2020; Currie and Rossin-Slater 2013; Deschênes, Greenstone, and Guryan 2009). The descriptive statistics of the dependent and main right-hand-side variables are shown in Table A1 of the Supplementary Materials.
P is a vector of precipitation controls, which shows the number of days where the amount of daily precipitation falls in precipitation bin k (0 mm, 0−1 mm, 1−5 mm, over 5 mm).
X is a vector of the characteristics of the parents and births and includes the education of the mother, her employment status, her age, her marital status, and her history of pregnancies (number of previous pregnancies, live births, and abortions). We control for education, age, and employment of the father and sex of the newborns. All of these characteristics are captured by categorical variables. These control variables are used, on the one hand, to improve the precision of the estimations. On the other hand, they help to partially control the fact that in utero temperature exposure might change the composition of fetuses that survive to live birth (Basu, Sarovar, and Malig 2016; Davenport, Dorélien, and Grace 2020; Ha et al. 2017; Li et al.
2018; Rammah et al. 2019; Strand, Barnett, and Tong 2012), often called the “culling” effect.
As in utero selection is likely to remove fetuses with below-average health (Almond and Currie 2011; Bruckner and Catalano 2018; Catalano et al. 2012), and we aim to estimate the “scarring”
effect of in utero temperature exposure on birth weight (the effect on “survivors”), the culling effect should be controlled for as much as possible. By including the sex of the newborn and the characteristics of the parents, we capture some of the impacts of in utero selection.
Time-invariant seasonal differences in average birth weight and prevalence of low birth weight across counties are captured by county-by-calendar-week fixed effects (ρcw). County- by-year fixed effects (μcy) control for county-specific shocks in a given year. In sum, we exploit the presumably random year-to-year variation in the calendar-week-specific in utero temperature exposure. The effect of temperature is identified from this interannual temperature variation after adjusting for differences in county-specific seasonality and county-specific shocks to health at birth at the year level.
We also examine the impact of temperature exposure by trimesters. Trimester 1 is defined as the first 13 weeks of the gestation (including the conception week), whereas weeks 14-26 and weeks 27-39 are assigned to trimesters 2 and 3, respectively:
7
12 25 38 12
1j 1j 2 j 2 j 3 j j 1k 1k
ct c( t i) c( t i) c( t i) c( t i)
j i 0 j i 13 j i 26 k i 0
25 38
2k 2k 3k 3k
c( t i) c( t i) ct cy cw ct
k i 13 k i 26
Y T T T P
P P X
+ + + +
= = = =
+ +
= =
= + + +
+ + + + + +
(2)
From this estimation, we can infer which pregnancy period is the most sensitive to temperature exposure.
We weight by the number of births in the county-by-year-by-week cells. Therefore, our results will be almost identical to the results of a similar regression run on individual-level data.
The primary reason to use an aggregated dataset is to reduce computing time, which is important for the projection of the impact of climate change (see below). Standard errors are clustered by county and time (two-way clustering). For the estimations, we use STATA package reghdfe (Correia 2014).
3.2. Projected impacts of climate change
The impacts of climate change are quantified by combining the historical estimates of the effect of in utero temperature exposure on birth weight/LBW with the projected within-model changes in temperature distribution between the periods of 1986–2005 and 2040–2059. Specifically, we take β coefficients from Eq. 1 and multiply them by the projected temperature changes, assuming a 39-week-long pregnancy period:
38
j j
mw m(w i)
j i 0
Y T +
=
=
(3)where m denotes the climate model and w denotes calendar week. ∆Y is the projected change in birth weight or prevalence of LBW for live births started in calendar week w. βj is the estimated historical relationship between temperature category j and the birth weight or prevalence of LBW (from Eq. 1). ∆T is a vector that shows the projected change in weekly temperature distribution between 1986–2005 and 2040–2059 for calendar week w and climate model m. That is, the results of this calculation are the projected impact of climate change by the calendar week of conception.
The average (overall) impact of climate change is calculated by averaging the projected calendar-week-level impacts. For this calculation, we use a weight (denoted by f; scaled to mean 1) based on the calendar weeks’ average number of live births in our sample:
w mw
m w
f Y
Y 52
=
(4)8
We use projections from 21 climate models to account for climate uncertainty.
Furthermore, we account for uncertainty in the historical relationship between temperature exposure and birth weight/LBW by bootstrapping the coefficient estimates of Eq. 1 (1,000 times, sampling with replacement). Using the coefficients from the 1,000 estimations and the projections of the 21 climate models, we construct 21,000 possible projections of the impact of climate change (21*1,000) by which we can incorporate both climate and regression uncertainty into the projected impacts of climate change (Burke et al. 2015).
In these calculations, we assume that the future relationship between temperature and birth weight/LBW will be the same as in the past. We cannot rule out that future adaptation might change the observed temperature-birth weight/LBW relationship. However, credible empirical estimates are missing regarding a possible future adaptation process. In addition, projecting impacts in the absence of future adaptation is a standard approach in the empirical literature on the impacts of climate change (Barreca and Schaller 2020; Burke et al. 2018;
Burke, Hsiang, and Miguel 2015; Deschênes, Greenstone, and Guryan 2009; Ngo and Horton 2016; Obradovich et al. 2017).
4. Results
4.1. Impact of in utero temperature exposure
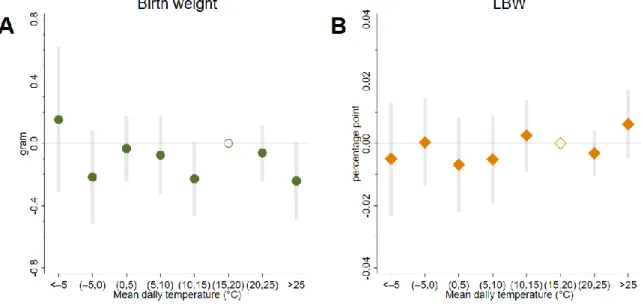
Figure 1 summarizes the impact of in utero temperature exposure on birth weight (Panel A) and low birth weight (Panel B). We find that temperature exposure during pregnancy has a significant influence on birth weight. Exposure to one additional >25°C day in utero, relative to a day with a mean temperature of 15-20°C, reduces birth weight by 0.46 grams (95% CI:
−0.72 to −0.21, p=0.001). The effect of exposure to an additional 20-25°C day is also negative but slightly lower in magnitude: −0.34 grams (95% CI: −0.53 to −0.15, p=0.001). Colder temperatures below the omitted category (15-20°C) seem to have small positive effects;
however, all the 95% confidence intervals include zero. Thus, our findings suggest that temperature has a nonlinear effect on birth weight.
Regarding the impacts on low birth weight, we find no significant effects. However, the estimated impacts are in line with the harmful effect of exposure to heat. The point estimates for temperature categories above the reference category are positive, whereas they are negative for colder temperature bins below the reference category.
9
Figure 1: Effect of in utero temperature exposure on birth weight/LBW
The effect of in utero exposure to one additional day with different mean temperatures on birth weight (A) and LBW (B) relative to a day with a mean temperature of 15–20°C. The circles/diamonds are the point estimates, and the error bars represent 95% confidence intervals. The estimations come from Eq. 1. The model has county-by- year fixed effects and county-by-calendar-week fixed effects. Precipitation, sex of the newborns, and the characteristics of the parents (age, education, employment, marital status of the mother, pregnancy history of the mother) are controlled for. The in utero exposure period is defined as a 39-week-long period starting with the week of conception. We weight by the number of live births in the county-by-year-by-week cells. Standard errors are clustered by county and time.
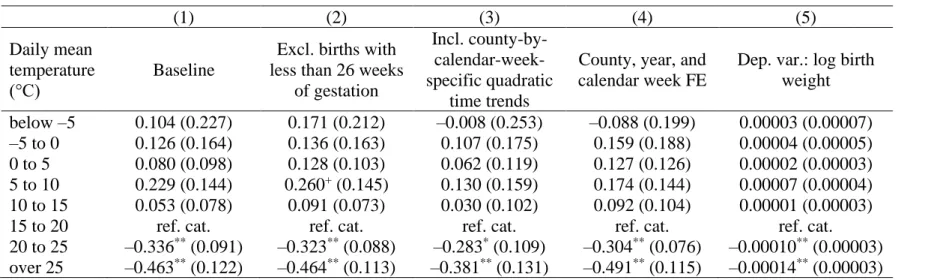
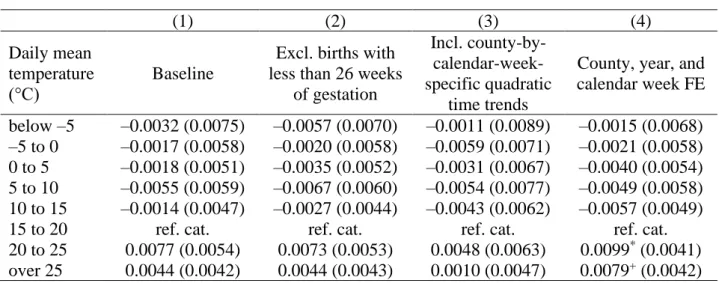
The sensitivity of the results is tested by additional model specifications: excluding live births with less than 26 weeks of gestation, including county-by-calendar-week-specific quadratic time trends, and using less restrictive fixed effects. We also use log birth weight as a dependent variable. The results of these estimations for the two outcome variables are summarized separately in Table A2 and Table A3 (Supplementary Materials). We also apply alternative clustering of the standard errors (Table A4 and Table A5, Supplementary Materials).
None of the changes alter the main conclusion. The alternative specifications give very similar results to the baseline estimations.
Next, we estimate the impacts of in utero temperature exposure by trimester. These estimations come from Eq. 2 and are summarized in Figure 2. In general, these estimations show large uncertainty, which is indicated by the large standard errors. The coefficients are not different from each other across trimesters. Nevertheless, temperature exposure may have a weaker impact during the first trimester than during the second and third trimesters. It is especially apparent for LBW; however, even for birth weight, the impacts of cold and hot temperatures are less different in the first trimester.
10
Figure 2: Effect of in utero temperature exposure by trimester
The effect of in utero exposure to one additional day with different mean temperatures on birth weight (A) and LBW (B) relative to a day with a mean temperature of 15–20°C. The circles/diamonds/squares are the point estimates, and the error bars represent 95% confidence intervals. The estimations come from Eq. 2. The model has county-by-year fixed effects and county-by-calendar-week fixed effects. Precipitation, sex of the newborns, and the characteristics of the parents (age, education, employment, marital status of the mother, pregnancy history of the mother) are controlled for. The in utero exposure period is defined as a 39-week-long period starting with the week of conception. We weight by the number of live births in the county-by-year-by-week cells. Standard errors are clustered by county and time.
Finally, as a placebo test, we estimate Eq. 1 with exposure to temperature in the future instead of exposure to temperature during the actual gestation period. Specifically, the exposure variables (temperature and precipitation) are replaced with weather data that were measured exactly one year later. Since the birth weight of the newborns could not have been affected by temperature exposure one year after conception (that is, several months after the birth), insignificant and close to zero coefficients are expected in these placebo regressions if our model is correctly specified. In general, the estimated impacts are substantially different from the baseline results (Figure A1, Supplementary Materials). All coefficients are statistically insignificant at the 5% level. More importantly, we do not observe similar patterns as in Figure 1. The estimated impacts show fairly random patterns, and positive and negative point estimates can be found both below and above the reference category. We can conclude that temperature 1 year later does not have any impact on birth weight or LBW. In sum, these estimations support the credibility of the baseline results.
11 4.2. Impacts of climate change
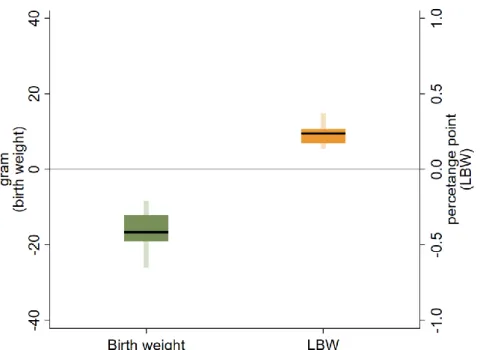
Figure 3 depicts the projected impacts of climate change on birth weight and prevalence of LBW by the mid-21st century from Eq. 4. We present medians, interquartile ranges, and the ranges containing 99% of the projections.1 For birth weight, the projections suggest a sizeable decline. The median projection is −15.4 grams. The interquartile range of the projections spreads from −20.5 to −11.3 grams. The upper bound of the ranges containing 99% of the projections is −35.8 grams, whereas the lower bound is −4.7 grams.
For LBW, some of the projections predict a decrease by 2040-2059, but most of them project an increased prevalence of LBW. The median projection is an increase of 0.21 percentage points. The interquartile range spread from 0.10 to 0.35 percentage points, whereas some projections are as high as 0.84 percentage points. The lower bound of the ranges containing 99% of the projections is −0.23 percentage points. These are nonnegligible changes considering that 6.7% of the newborns were born with low birth weight in our sample, which means that the interquartile range represents an increase of 1.5-5.2%.
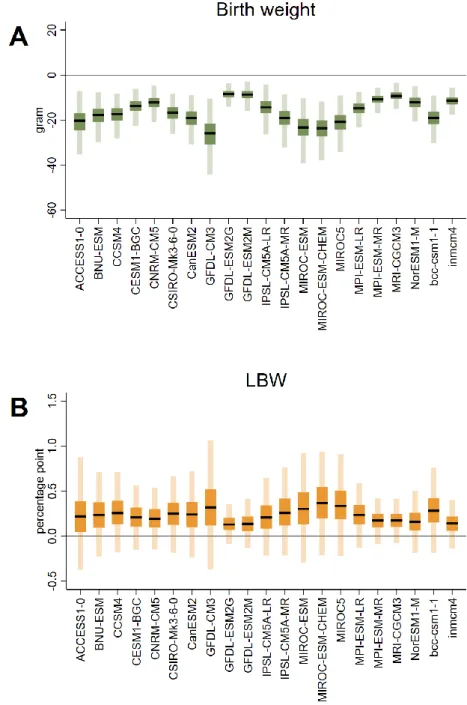
The projected impacts vary considerably across climate models. Figure A2 (Supplementary Materials) shows that projecting the impacts of climate change separately by the 21 climate models results in a wide range of projections. For example, the median projections regarding the impact on birth weight range between −25.8 and −8.5 grams, whereas for LBW, they range between 0.13 and 0.37 percentage points. These differences stress the importance of accounting for climate uncertainty (Burke et al. 2015). However, accounting only for climate uncertainty might also lead to false certainty regarding the possible impacts of climate change. In Figure A3 (Supplementary Materials), we show projections where regression uncertainty is excluded by using the coefficients from the baseline estimation (depicted in Figure 1). The ranges containing 99% of the projections are much narrower in this case, which might be positive from a certain analytic point of view (higher degree of precision), but these projections would serve as misleading inputs for climate policy. In sum, credible projections on the impact of climate change require accounting for both climate and regression uncertainty.
1 We took the 0.5th and 99.5th percentiles to calculate the ranges containing 99% of the projections.
12
Figure 3: Projected impacts of climate change by the mid-21st century
Impacts of climate change by 2040–2059 on birth weight and prevalence of low birth weight. The impacts are calculated using (i) the projected within-model differences in the temperature distribution between the periods of 1986–2005 and 2040–2059 by 21 climate models under RCP 8.5 and (ii) the historical relationship between in utero temperature exposure and birth weight/LBW from Eq. 1 (estimated by 1,000 bootstrap samples). The black lines show the median projections. The dark shaded areas show the interquartile range of the projections. The hollow shaded bars represent the range containing 99% of the projections. The projected impacts for birth weight are shown on the left horizontal axis. The projected impacts for LBW are shown on the right horizontal axis.
Next, we investigate the impact of climate change-induced temperature changes by the calendar week of conception. These calculations are based on Eq. 3. The results of these exercises suggest that although the impacts on births conceived in different parts of the year are all negative, the magnitudes are somewhat different. The impacts are projected to be more severe for births conceived during the winter and spring months. For example, the largest impacts are projected for calendar week 10: the median projection in terms of the impact on birth weight is −21.3 grams, whereas the interquartile range spreads between −28.2 and −15.5 grams. In contrast, the median projection for calendar week 38 is −7.4 grams and the interquartile range is −10.8 to −4.7 grams, an almost three-fold difference. For LBW, we observe similar differences but that are lower in magnitude. However, we note that the 99%
ranges of the projections overlap for all calendar weeks. Nevertheless, these projections indicate that there is a nonnegligible difference in the severity of impacts of climate change across conception weeks.
13
Figure 4: Projected impacts of climate change by conception week of the year
Impacts of climate change by 2040–2059 on birth weight (A) and prevalence of low birth weight (B) by the week of conception. The impacts are calculated using (i) the projected within-model differences in the temperature distribution between the periods of 1986–2005 and 2040–2059 by 21 climate models under RCP 8.5 and (ii) the historical relationship between in utero temperature exposure and birth weight/LBW from Eq. 1 (estimated by 1,000 bootstrap samples). The black lines show the median projections. The dark shaded areas show the interquartile range of the projections. The hollow shaded areas represent the range containing 99% of the projections.
5. Discussion and conclusion
In this paper, we studied the effect of in utero temperature exposure on birth weight and the prevalence of low birth weight. We used administrative data that covers more than 1.5 million singleton live births conceived between 2000 and 2016 in Hungary. We showed that exposure to one additional day with a mean temperature >25°C reduces birth weight by 0.46 grams, whereas the impact of a 20-25°C day is −0.34 grams. Colder temperatures below the omitted category (15-20°C) seem to have positive, but insignificant effects on birth weight. The impacts of LBW are more modest.
We also projected the impacts of climate change by the mid-21st century (2040−2059).
We showed that the average birth weight is likely to decrease due to climate change in Hungary, whereas we project an increase in the prevalence of low birth weight. Accounting for both climate and regression uncertainty, the interquartile ranges of the projections spread from −20.5 to −11.3 grams for birth weight, and from 0.10 to 0.35 percentage points (or 1.5-5.2%) for LBW. We also showed that the impacts of climate change vary across births conceived in
14
different parts of the year. Births conceived during the winter and spring months are projected to be affected more severely.
To put the magnitude of the projected impacts of climate change into context, we note that workplace smoking bans increase the birth weight of the most affected newborns by 50-60 grams (Bharadwaj, Johnsen, and Løken 2014; Hajdu and Hajdu 2018). A recent study shows that a 1000 dollar increase in annual family income from the minimum wage increases birth weight by 4 grams in the US, while it has no effect on LBW (Wehby, Dave, and Kaestner 2020).
The Women, Infants, and Children (WIC) program is reported to increase the birth weight of the participants’ newborns by 20-60 grams (Bitler and Currie 2005; Hoynes, Page, and Stevens 2011), while the estimated impacts on LBW are mixed (Bitler and Currie 2005; Currie and Rajani 2015; Hoynes, Page, and Stevens 2011). An Uruguayan social assistance program that targeted the poorest and increased household income by 25% is reported to decrease LBW by 20% and increase birth weight by 30 grams (Amarante et al. 2016). The Food Stamp Program (FSP) increased birth weight by 15-40 grams and decreased LBW by approximately 8%
(Almond, Hoynes, and Schanzenbach 2011).
Finally, as discussed earlier, in utero temperature exposure are likely to cause in utero selection that removes fetuses with below-average health (Almond and Currie 2011; Bruckner and Catalano 2018; Catalano et al. 2012). Therefore, our estimates can be considered as a lower bound of the true scarring effect of temperature exposure. Even though we used control variables to capture the culling effect to some extent, we likely could not completely control for it. As most fetal losses occur during the early period of pregnancy, even before clinical recognition (Jarvis 2016; Wilcox et al. 2020), the first trimester estimates are more likely to be affected by selection-induced bias.
References
Almond, D. and Currie, J. (2011). Killing Me Softly: The Fetal Origins Hypothesis. Journal of Economic Perspectives 25(3):153–172. doi:10.1257/jep.25.3.153.
Almond, D., Currie, J., and Duque, V. (2018). Childhood Circumstances and Adult Outcomes: Act II. Journal of Economic Literature 56(4):1360–1446. doi:10.1257/jel.20171164.
Almond, D., Hoynes, H.W., and Schanzenbach, D.W. (2011). Inside the War on Poverty: The Impact of Food Stamps on Birth Outcomes. Review of Economics and Statistics 93(2):387–403.
doi:10.1162/REST_a_00089.
Amarante, V., Manacorda, M., Miguel, E., and Vigorito, A. (2016). Do Cash Transfers Improve Birth Outcomes?
Evidence from Matched Vital Statistics, Program, and Social Security Data. American Economic Journal:
Economic Policy 8(2):1–43. doi:10.1257/pol.20140344.
Andalón, M., Azevedo, J.P., Rodríguez-Castelán, C., Sanfelice, V., and Valderrama-González, D. (2016). Weather Shocks and Health at Birth in Colombia. World Development 82:69–82.
doi:10.1016/j.worlddev.2016.01.015.
15
Barreca, A. and Schaller, J. (2020). The impact of high ambient temperatures on delivery timing and gestational lengths. Nature Climate Change 10(1):77–82. doi:10.1038/s41558-019-0632-4.
Basu, R., Sarovar, V., and Malig, B.J. (2016). Association Between High Ambient Temperature and Risk of Stillbirth in California. American Journal of Epidemiology 183(10):894–901. doi:10.1093/aje/kwv295.
Behrman, J.R. and Rosenzweig, M.R. (2004). Returns to Birthweight. The Review of Economics and Statistics 86(2):586–601. doi:10.1162/003465304323031139.
Beuermann, D.W. and Pecha, C.J. (2020). The effects of weather shocks on early childhood development:
Evidence from 25 years of tropical storms in Jamaica. Economics & Human Biology 37:100851.
doi:10.1016/j.ehb.2020.100851.
Bharadwaj, P., Johnsen, J.V., and Løken, K.V. (2014). Smoking bans, maternal smoking and birth outcomes.
Journal of Public Economics 115:72–93. doi:10.1016/j.jpubeco.2014.04.008.
Bharadwaj, P., Lundborg, P., and Rooth, D.-O. (2018). Birth Weight in the Long Run. Journal of Human Resources 53(1):189–231. doi:10.3368/jhr.53.1.0715-7235R.
Bitler, M.P. and Currie, J. (2005). Does WIC work? The effects of WIC on pregnancy and birth outcomes. Journal of Policy Analysis and Management 24(1):73–91. doi:10.1002/pam.20070.
Black, S.E., Devereux, P.J., and Salvanes, K.G. (2007). From the Cradle to the Labor Market? The Effect of Birth Weight on Adult Outcomes. The Quarterly Journal of Economics 122(1):409–439.
doi:10.1162/qjec.122.1.409.
Bruckner, T.A. and Catalano, R. (2018). Selection in utero and population health: Theory and typology of research.
SSM - Population Health 5:101–113. doi:10.1016/j.ssmph.2018.05.010.
Burke, M., Dykema, J., Lobell, D.B., Miguel, E., and Satyanath, S. (2015). Incorporating Climate Uncertainty into Estimates of Climate Change Impacts. The Review of Economics and Statistics 97(2):461–471.
doi:10.1162/REST_a_00478.
Burke, M., González, F., Baylis, P., Heft-Neal, S., Baysan, C., Basu, S., and Hsiang, S. (2018). Higher temperatures increase suicide rates in the United States and Mexico. Nature Climate Change 8(8):723–
729. doi:10.1038/s41558-018-0222-x.
Burke, M., Hsiang, S.M., and Miguel, E. (2015). Global non-linear effect of temperature on economic production.
Nature 527(7577):235–239. doi:10.1038/nature15725.
Case, A., Fertig, A., and Paxson, C. (2005). The lasting impact of childhood health and circumstance. Journal of Health Economics 24(2):365–389. doi:10.1016/j.jhealeco.2004.09.008.
Catalano, R., Goodman, J., Margerison-Zilko, C.E., Saxton, K.B., Anderson, E., and Epstein, M. (2012). Selection against small males in utero: a test of the Wells hypothesis. Human Reproduction 27(4):1202–1208.
doi:10.1093/humrep/der480.
Chen, X., Tan, C.M., Zhang, Xiaobo, and Zhang, Xin (2020). The effects of prenatal exposure to temperature extremes on birth outcomes: the case of China. Journal of Population Economics. doi:10.1007/s00148- 020-00768-4.
Cole, L.A., Ladner, D.G., and Byrn, F.W. (2009). The normal variabilities of the menstrual cycle. Fertility and Sterility 91(2):522–527. doi:10.1016/j.fertnstert.2007.11.073.
Coneus, K. and Spiess, C.K. (2012). Pollution exposure and child health: Evidence for infants and toddlers in Germany. Journal of Health Economics 31(1):180–196. doi:10.1016/j.jhealeco.2011.09.006.
Cornes, R.C., Schrier, G. van der, Besselaar, E.J.M. van den, and Jones, P.D. (2018). An Ensemble Version of the E-OBS Temperature and Precipitation Data Sets. Journal of Geophysical Research: Atmospheres 123(17):9391–9409. doi:10.1029/2017JD028200.
Correia, S. (2014). REGHDFE: Stata Module to Perform Linear or Instrumental-Variable Regression Absorbing Any Number of High-Dimensional Fixed Effects. Boston College Department of Economics.
https://ideas.repec.org/c/boc/bocode/s457874.html.
Currie, J. (2009). Healthy, Wealthy, and Wise: Socioeconomic Status, Poor Health in Childhood, and Human Capital Development. Journal of Economic Literature 47(1):87–122. doi:10.1257/jel.47.1.87.
Currie, J. (2011). Inequality at Birth: Some Causes and Consequences. American Economic Review 101:1–22.
doi:10.1257/aer.101.3.1.
Currie, J., Davis, L., Greenstone, M., and Walker, R. (2015). Environmental Health Risks and Housing Values:
Evidence from 1,600 Toxic Plant Openings and Closings. American Economic Review 105(2):678–709.
doi:10.1257/aer.20121656.
Currie, J., Graff Zivin, J., Meckel, K., Neidell, M., and Schlenker, W. (2013). Something in the water:
contaminated drinking water and infant health. Canadian Journal of Economics 46(3):791–810.
doi:10.1111/caje.12039.
Currie, J. and Rajani, I. (2015). Within-Mother Estimates of the Effects of Wic on Birth Outcomes in New York City. Economic Inquiry 53(4):1691–1701. doi:10.1111/ecin.12219.
Currie, J. and Rossin-Slater, M. (2013). Weathering the storm: Hurricanes and birth outcomes. Journal of Health Economics 32(3):487–503. doi:10.1016/j.jhealeco.2013.01.004.
16
Currie, J. and Schmieder, J.F. (2009). Fetal Exposures to Toxic Releases and Infant Health. American Economic Review 99(2):177–183. doi:10.1257/aer.99.2.177.
Currie, J., Zivin, J.G., Mullins, J., and Neidell, M. (2014). What Do We Know About Short- and Long-Term Effects of Early-Life Exposure to Pollution? Annual Review of Resource Economics 6(1):217–247.
doi:10.1146/annurev-resource-100913-012610.
Davenport, F., Dorélien, A., and Grace, K. (2020). Investigating the linkages between pregnancy outcomes and climate in sub-Saharan Africa. Population and Environment 41(4):397–421. doi:10.1007/s11111-020- 00342-w.
DeCicca, P. and Malak, N. (2020). When good fences aren’t enough: The impact of neighboring air pollution on infant health. Journal of Environmental Economics and Management 102:102324.
doi:10.1016/j.jeem.2020.102324.
Deschênes, O., Greenstone, M., and Guryan, J. (2009). Climate Change and Birth Weight. American Economic Review 99(2):211–17. doi:10.1257/aer.99.2.211.
Fehring, R.J., Schneider, M., and Raviele, K. (2006). Variability in the Phases of the Menstrual Cycle. Journal of Obstetric, Gynecologic & Neonatal Nursing 35(3):376–384. doi:10.1111/j.1552-6909.2006.00051.x.
Figlio, D., Guryan, J., Karbownik, K., and Roth, J. (2014). The Effects of Poor Neonatal Health on Children’s Cognitive Development. American Economic Review 104(12):3921–3955. doi:10.1257/aer.104.12.3921.
Fishman, R., Carrillo, P., and Russ, J. (2019). Long-term impacts of exposure to high temperatures on human capital and economic productivity. Journal of Environmental Economics and Management 93:221–238.
doi:10.1016/j.jeem.2018.10.001.
Grace, K., Davenport, F., Hanson, H., Funk, C., and Shukla, S. (2015). Linking climate change and health outcomes: Examining the relationship between temperature, precipitation and birth weight in Africa.
Global Environmental Change 35:125–137. doi:10.1016/j.gloenvcha.2015.06.010.
Ha, S., Liu, D., Zhu, Y., Soo Kim, S., Sherman, S., Grantz, K.L., and Mendola, P. (2017). Ambient Temperature and Stillbirth: A Multi-Center Retrospective Cohort Study. Environmental Health Perspectives 125(6).
doi:10.1289/EHP945.
Hajdu, T. and Hajdu, G. (2018). Smoking ban and health at birth: Evidence from Hungary. Economics & Human Biology 30:37–47. doi:10.1016/j.ehb.2018.05.003.
Hoynes, H., Page, M., and Stevens, A.H. (2011). Can targeted transfers improve birth outcomes?: Evidence from the introduction of the WIC program. Journal of Public Economics 95(7–8):813–827.
doi:10.1016/j.jpubeco.2010.12.006.
Hu, Z. and Li, T. (2019). Too hot to handle: The effects of high temperatures during pregnancy on adult welfare outcomes. Journal of Environmental Economics and Management 94:236–253.
doi:10.1016/j.jeem.2019.01.006.
IPCC (2014). Climate Change 2014: Synthesis Report. Contribution of Working Groups I, II and III to the Fifth Assessment Report of the Intergovernmental Panel on Climate Change. Geneva, Switzerland.
IPCC (2018). Global Warming of 1.5°C. An IPCC Special Report on the Impacts of Global Warming of 1.5°C above Pre-Industrial Levels and Related Global Greenhouse Gas Emission Pathways, in the Context of Strengthening the Global Response to the Threat of Climate Change, Sustainable Development, and Efforts to Eradicate Poverty. Geneva, Switzerland.
Isen, A., Rossin-Slater, M., and Walker, R. (2017). Relationship between season of birth, temperature exposure, and later life wellbeing. Proceedings of the National Academy of Sciences 114(51):13447–13452.
doi:10.1073/pnas.1702436114.
Jarvis, G.E. (2016). Estimating limits for natural human embryo mortality. F1000Research 5:2083.
doi:10.12688/f1000research.9479.2.
Lenton, E.A., Landgren, B.-M., and Sexton, L. (1984). Normal variation in the length of the luteal phase of the menstrual cycle: identification of the short luteal phase. BJOG: An International Journal of Obstetrics &
Gynaecology 91(7):685–689. doi:10.1111/j.1471-0528.1984.tb04831.x.
Li, S., Chen, G., Jaakkola, J.J.K., Williams, G., and Guo, Y. (2018). Temporal change in the impacts of ambient temperature on preterm birth and stillbirth: Brisbane, 1994–2013. Science of The Total Environment 634:579–585. doi:10.1016/j.scitotenv.2018.03.385.
Molina, O. and Saldarriaga, V. (2017). The perils of climate change: In utero exposure to temperature variability and birth outcomes in the Andean region. Economics & Human Biology 24:111–124.
doi:10.1016/j.ehb.2016.11.009.
Moss, R.H., Edmonds, J.A., Hibbard, K.A., Manning, M.R., Rose, S.K., van Vuuren, D.P., Carter, T.R., Emori, S., Kainuma, M., Kram, T., Meehl, G.A., Mitchell, J.F.B., Nakicenovic, N., Riahi, K., Smith, S.J., Stouffer, R.J., Thomson, A.M., Weyant, J.P., and Wilbanks, T.J. (2010). The next generation of scenarios for climate change research and assessment. Nature 463(7282):747–756. doi:10.1038/nature08823.
17
Ngo, N.S. and Horton, R.M. (2016). Climate change and fetal health: The impacts of exposure to extreme temperatures in New York City. Environmental Research 144, Part A:158–164.
doi:10.1016/j.envres.2015.11.016.
Obradovich, N., Migliorini, R., Mednick, S.C., and Fowler, J.H. (2017). Nighttime temperature and human sleep loss in a changing climate. Science Advances 3(5):e1601555. doi:10.1126/sciadv.1601555.
Quansah, R., Armah, F.A., Essumang, D.K., Luginaah, I., Clarke, E., Marfoh, K., Cobbina, S.J., Nketiah- Amponsah, E., Namujju Proscovia, B., Obiri, S., and Dzodzomenyo, M. (2015). Association of Arsenic with Adverse Pregnancy Outcomes/Infant Mortality: A Systematic Review and Meta-Analysis.
Environmental Health Perspectives 123(5):412–421. doi:10.1289/ehp.1307894.
Rammah, A., Whitworth, K.W., Han, I., Chan, W., Hess, J.W., and Symanski, E. (2019). Temperature, placental abruption and stillbirth. Environment International 131:105067. doi:10.1016/j.envint.2019.105067.
Rangel, M.A. and Vogl, T.S. (2019). Agricultural Fires and Health at Birth. The Review of Economics and Statistics 101(4):616–630. doi:10.1162/rest_a_00806.
Simeonova, E. (2011). Out of Sight, Out of Mind? Natural Disasters and Pregnancy Outcomes in the USA. CESifo Economic Studies 57(3):403–431. doi:10.1093/cesifo/ifr005.
Stirnemann, J.J., Samson, A., Bernard, J.-P., and Thalabard, J.-C. (2013). Day-specific probabilities of conception in fertile cycles resulting in spontaneous pregnancies. Human Reproduction 28(4):1110–1116.
doi:10.1093/humrep/des449.
Strand, L.B., Barnett, A.G., and Tong, S. (2012). Maternal Exposure to Ambient Temperature and the Risks of Preterm Birth and Stillbirth in Brisbane, Australia. American Journal of Epidemiology 175(2):99–107.
doi:10.1093/aje/kwr404.
Sun, S., Spangler, K.R., Weinberger, K.R., Yanosky, J.D., Braun, J.M., and Wellenius, G.A. (2019). Ambient Temperature and Markers of Fetal Growth: A Retrospective Observational Study of 29 Million U.S.
Singleton Births. Environmental Health Perspectives 127(6):067005. doi:10.1289/EHP4648.
Thrasher, B., Maurer, E.P., McKellar, C., and Duffy, P.B. (2012). Technical Note: Bias correcting climate model simulated daily temperature extremes with quantile mapping. Hydrology and Earth System Sciences 16(9):3309–3314. doi:https://doi.org/10.5194/hess-16-3309-2012.
Torche, F. (2011). The Effect of Maternal Stress on Birth Outcomes: Exploiting a Natural Experiment.
Demography 48(4):1473–1491. doi:10.1007/s13524-011-0054-z.
Trudeau, J., Conway, K.S., and Kutinova Menclova, A. (2016). Soaking Up the Sun: The Role of Sunshine in the Production of Infant Health. American Journal of Health Economics 2(1):1–40.
doi:10.1162/AJHE_a_00032.
Tsou, M.-W., Liu, J.-T., Hammitt, J.K., Lu, C.-H., and Kao, S.-Y.Z. (2019). The effect of prenatal exposure to radiation on birth outcomes: exploiting a natural experiment in Taiwan. The Japanese Economic Review.
doi:10.1007/s42973-019-00016-9.
Wehby, G.L., Dave, D.M., and Kaestner, R. (2020). Effects of the Minimum Wage on Infant Health. Journal of Policy Analysis and Management 39(2):411–443. doi:10.1002/pam.22174.
Wilcox, A.J., Harmon, Q., Doody, K., Wolf, D.P., and Adashi, E.Y. (2020). Preimplantation loss of fertilized human ova: estimating the unobservable. Human Reproduction 35(4):743–750.
doi:10.1093/humrep/deaa048.
Wilde, J., Apouey, B.H., and Jung, T. (2017). The effect of ambient temperature shocks during conception and early pregnancy on later life outcomes. European Economic Review 97:87–107.
doi:10.1016/j.euroecorev.2017.05.003.
Yang, C.-Y., Chang, C.-C., Tsai, S.-S., Chuang, H.-Y., Ho, C.-K., and Wu, T.-N. (2003). Arsenic in drinking water and adverse pregnancy outcome in an arseniasis-endemic area in northeastern Taiwan. Environmental Research 91(1):29–34. doi:10.1016/S0013-9351(02)00015-4.
Zhang, Xin, Wang, Y., Chen, X., and Zhang, Xun (2020). Associations between prenatal sunshine exposure and birth outcomes in China. Science of The Total Environment 713:136472.
doi:10.1016/j.scitotenv.2019.136472.
18
Supplementary Materials
Additional details regarding the data Estimation of the conception dates
We estimate the date of conception of each live birth using the information on the date of birth and pregnancy length. First, because gestation length is calculated from the first day of the last menses, and it is reported in completed weeks, we estimate the first day of the menstrual cycle as follows:
M= −L (G 7 3) + ,
where M is the first day of the last menses, L is the last day of the pregnancy (date of birth), and G is the gestation length. It is important to note that the actual gestational age is 0–
6 days longer than the reported one, as G is recorded in completed weeks. Therefore, M is calculated by adding 3 days (the average bias) to the reported pregnancy length (G).
Next, we estimate the conception date (F) based on M. As conception (fertilization) occurs within hours after ovulation (Stirnemann et al. 2013) and the day of ovulation is most likely to be between the 11th and 19th day of the menstrual cycle (Cole, Ladner, and Byrn 2009;
Fehring, Schneider, and Raviele 2006; Lenton, Landgren, and Sexton 1984; Stirnemann et al.
2013), we assume that conceptions occur on the 15th day:
F=M 14+ .
Weather data
The E-OBS 19.0e dataset of the European Climate Assessment & Dataset project provides daily weather measures for Europe with a spacing of 0.1° × 0.1° in regular latitude/longitude coordinates from 1950. The E-OBS dataset contains information on the mean, maximum and minimum temperatures, and precipitation. To describe the daily weather conditions at the grid points within Hungary, we create eight binary temperature variables based on the mean temperature (below −5°C, −5–0°C, 0–5°C, 5–10°C, 10–15°C, 15–20°C, 20–25°C, over 25°C) and four precipitation variables indicating the amount of daily precipitation (0 mm, 0–1 mm, 1–5 mm, over 5 mm). Next, to preserve the variation in temperature, we average the new temperature and precipitation variables for each day over grid points within the twenty counties of Hungary (including Budapest). Finally, the weekly level measures are constructed from the
19
daily data by summing the variables over the weeks for each county. Accordingly, eight temperature variables show the number of days in a given year-week and given county when the daily mean temperature falls in a certain temperature bin, and four precipitation variables show the number of days when the amount of daily precipitation falls in a certain precipitation bin. Formally, the weakly level temperature variables are calculated as follows:
j cgywd j
cyw
d g c
T T
N
=
where c denotes the county, g the grid points, y the year, w the calendar week, and d represents the day of the week. T* is an indicator variable that shows whether the mean temperature in a given year-week-day and given county-grid point falls into temperature category j (below −5°C, −5–0°C, 0–5°C, 5–10°C, 10–15°C, 15–20°C, 20–25°C, or above 25°C). N is the number of grid points located within the counties.
Climate change projections
The NASA NEX-GDDP data contain projections of 21 climate models: ACCESS1-0, BCC- CSM1-1, BNU-ESM, CanESM2, CCSM4, CESM1-BGC, CNRM-CM5, CSIRO-MK3-6-0, GFDL-CM3, GFDL-ESM2G, GFDL-ESM2M, INMCM4, IPSL-CM5A-LR, IPSL-CM5A- MR, MIROC-ESM, MIROC-ESM-CHEM, MIROC5, MPI-ESM-LR, MPI-ESM-MR, MPI- ESM–MR, MRI-CGCM3, and NorESM1-M. They were developed for the Fifth Assessment Report of the IPCC. Each climate projection is downscaled to a spatial resolution of 0.25° × 0.25°.
The mean temperature is calculated as the mean of the maximum and minimum temperatures. We create eight temperature indicators that describe the daily temperature conditions at the grid points located within the borders of Hungary (mean temperature is below
−5°C, −5–0°C, 0–5°C, 5–10°C, 10–15°C, 15–20°C, 20–25°C, over 25°C). To obtain the projected temperature on a specific day in a given county, we average the temperature variables over the grid points located within the counties. Using these daily level estimations, we calculate the distribution of the mean temperature in the periods of 1986–2005 and 2040–2059 for the 21 climate models by county and calendar week. The within-model temperature changes are calculated as the difference between the periods of 2040–2059 and 1986–2005. Finally, to make a projection for the whole country, we average the county-level temperature changes. For this aggregation, we use the counties’ average number of births conceived between 2000 and
20
2016 as weights (scaled to mean 1). Specifically, the within-model temperature changes are calculated as follows:
j,2040 2059 j,1986 2005
mcgywd mcgywd
j
mw c
c y d g c y d g c
T T
1 1
T f
20 N 20 N
− −
=
−
where m denotes the climate model, c the county, g the grid points, y the year, w the calendar week, and d represents the day of the week. T* is an indicator variable that shows whether the projected mean temperature in a given year-week-day and given county-grid point falls into temperature category j (below −5°C, −5–0°C, 0–5°C, 5–10°C, 10–15°C, 15–20°C, 20–25°C, or above 25°C). N is the number of grid points located within the counties, whereas f is a weight variable (scaled to mean 1) based on the counties’ average number of births in our sample.
21 Figures
Figure A1: Placebo regressions with weather 1 year later of the actual exposure period
The effect of in utero exposure to one additional day with different mean temperatures on birth weight (A) and LBW (B) relative to a day with a mean temperature of 15–20°C. We use weather variables measured exactly 1 year later of the actual exposure period. The circles/diamonds are the point estimates, and the error bars represent 95% confidence intervals. The estimations are based on Eq. 1. The model has county-by-year fixed effects and county-by-calendar-week fixed effects. Precipitation, sex of the newborns, and the characteristics of the parents (age, education, employment, marital status of the mother, pregnancy history of the mother) are controlled for.
The in utero exposure period is defined as a 39-week-long period starting with the week of conception. We weight by the number of live births in the county-by-year-by-week cells. Standard errors are clustered by county and time.
22
Figure A2: Projected impacts of climate change across climate models
Impacts of climate change by 2040–2059 on birth weight (A) and prevalence of low birth weight (B) across climate models. The impacts are calculated using (i) the projected within-model differences in the temperature distribution between the periods of 1986–2005 and 2040–2059 under RCP 8.5 and (ii) the historical relationship between in utero temperature exposure and birth weight/LBW from Eq. 1 (estimated by 1,000 bootstrap samples). The black lines show the median projections. The dark shaded areas show the interquartile range of the projections. The hollow shaded bars represent the range containing 99% of the projections.
23
Figure A3: Projected impacts of climate change by accounting only for climate uncertainty
Impacts of climate change by 2040–2059 on birth weight and prevalence of low birth weight. The impacts are calculated using (i) the projected of within-model differences in the temperature distribution between the periods of 1986–2005 and 2040–2059 by 21 climate models under RCP 8.5 and (ii) the historical relationship between in utero temperature exposure and birth weight/LBW from Eq. 1. The black lines show the median projections. The dark shaded areas show the interquartile range of the projections. The hollow shaded bars represent the range containing 99% of the projections. The projected impacts for birth weight are shown on the left horizontal axis.
The projected impacts for LBW are shown on the right horizontal axis. Regression uncertainty is excluded by using the main coefficients estimations depicted in Figure 1.
24 Tables
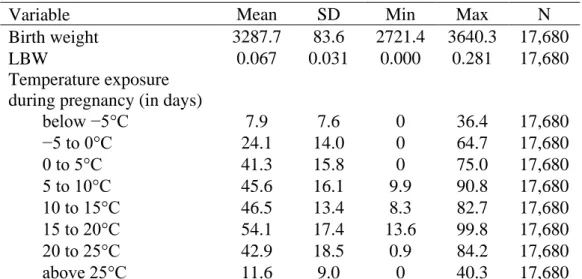
Table A1: Descriptive statistics
Variable Mean SD Min Max N
Birth weight 3287.7 83.6 2721.4 3640.3 17,680
LBW 0.067 0.031 0.000 0.281 17,680
Temperature exposure during pregnancy (in days)
below −5°C 7.9 7.6 0 36.4 17,680
−5 to 0°C 24.1 14.0 0 64.7 17,680
0 to 5°C 41.3 15.8 0 75.0 17,680
5 to 10°C 45.6 16.1 9.9 90.8 17,680
10 to 15°C 46.5 13.4 8.3 82.7 17,680
15 to 20°C 54.1 17.4 13.6 99.8 17,680
20 to 25°C 42.9 18.5 0.9 84.2 17,680
above 25°C 11.6 9.0 0 40.3 17,680
Units of observations: county-by-year-by-week. Weighted by the number of births in the county-by-year-by-week cells. The in utero exposure period is defined as a 39-week-long period starting with the week of conception.