2
Soproni Egyetem
Kitaibel Pál Környezettudományi Doktori Iskola
„Biokörnyezet-tudomány” program
THE EFFECT OF VEGETATION ON THE WATER BALANCE IN CONTEXT OF CLIMATE CHANGE
A NÖVÉNYZET VÍZKÖRFORGALOMRA GYAKOROLT HATÁSA A KLÍMAVÁLTOZÁS
TÜKRÉBEN
DOKTORI (PhD) ÉRTEKEZÉS
Készítette:
Herceg András
Témavezető:
Prof. Dr. Gribovszki Zoltán
Sopron 2017
3
The effect of vegetation on the water balance in context of climate change A növényzet vízkörforgalomra gyakorolt hatása a klímaváltozás
tükrében
Értekezés doktori (PhD) fokozat elnyerése érdekében készült
a Soproni Egyetem Kitaibel Pál Környezettudományi Doktori Iskolája Biokörnyezet- tudomány programja keretében.
Írta:
Herceg András
Témavezetők: Prof. Dr. Gribovszki Zoltán
Elfogadásra javaslom (igen / nem)
A jelölt a doktori szigorlaton …... % -ot ért el, Sopron,
(aláírás)
………..
a Szigorlati Bizottság elnöke Az értekezést bírálóként elfogadásra javaslom (igen /nem)
Első bíráló: igen/nem
Második bíráló igen/nem
(Esetleg harmadik bíráló (Dr. ...) igen /nem
A jelölt az értekezés nyilvános vitáján…...% - ot ért el
(aláírás)
(aláírás)
(aláírás)
Sopron, ………..
a Bírálóbizottság elnöke A doktori (PhD) oklevél minősítése…...
………..
Az EDHT elnöke
4
NYILATKOZAT
Alulírott …………Herceg András…..…, jelen nyilatkozat aláírásával kijelentem, hogy a(z)
……The effect of vegetation on the water balance in context of climate change
……….. című PhD értekezésem önálló munkám, az értekezés készítése során betartottam a szerzői jogról szóló 1999. évi LXXVI. törvény szabályait, valamint a
…Kitaibel Pál Környezettudományi… Doktori Iskola által előírt, a doktori értekezés készítésére vonatkozó szabályokat, különösen a hivatkozások és idézések tekintetében.1
Kijelentem továbbá, hogy az értekezés készítése során az önálló kutatómunka kitétel tekintetében témavezető(i)met, illetve a programvezetőt nem tévesztettem meg.
Jelen nyilatkozat aláírásával tudomásul veszem, hogy amennyiben bizonyítható, hogy az értekezést nem magam készítettem, vagy az értekezéssel kapcsolatban szerzői jogsértés ténye merül fel, a Soproni Egyetem megtagadja a PhD értekezés befogadását és ellenem fegyelmi eljárást indíthat.
Az értekezés befogadásának megtagadása nem érinti a szerzői jogsértés miatti egyéb (polgári jogi, szabálysértési jogi, büntetőjogi) jogkövetkezményeket.
Sopron, 2017……….
………..
doktorjelölt
1 1999. évi LXXVI. tv. 34. § (1) A mű részletét – az átvevő mű jellege és célja által indokolt terjedelemben és az eredetihez híven – a forrás, valamint az ott megjelölt szerző megnevezésével bárki idézheti.
36. § (1) Nyilvánosan tartott előadások és más hasonló művek részletei, valamint politikai beszédek tájékoztatás céljára – a cél által indokolt terjedelemben – szabadon felhasználhatók. Ilyen felhasználás esetén a forrást – a szerző nevével együtt – fel kell tüntetni, hacsak ez lehetetlennek nem bizonyul.
5
Contents
Contents ... 5
List of symbols and abbreviations ... 7
Abstract ... 9
Kivonat ... 10
1. Introduction ... 10
1.1. Background and objective ... 11
1.2. Structure of the dissertation ... 12
2. Climate change and evapotranspiration ... 13
2.1. The climate change ... 13
2.2. Climate models ... 14
2.3. Hydrological effects of climate change ... 16
2.3.1. Floods, inland inundation and droughts ... 17
2.3.2. Climate change impacts on soil moisture, groundwater level and plants physiology ... 18
2.4. Water-balance approaches and the role of the evapotranspiration in them ... 22
2.5. Significance of evapotranspiration ... 24
2.6. Physical process of the evaporation and the turbulent energy exchange ... 24
2.6.1. Vapor-pressure relations ... 26
2.6.2. Latent heat exchange and sensible heat exchange... 27
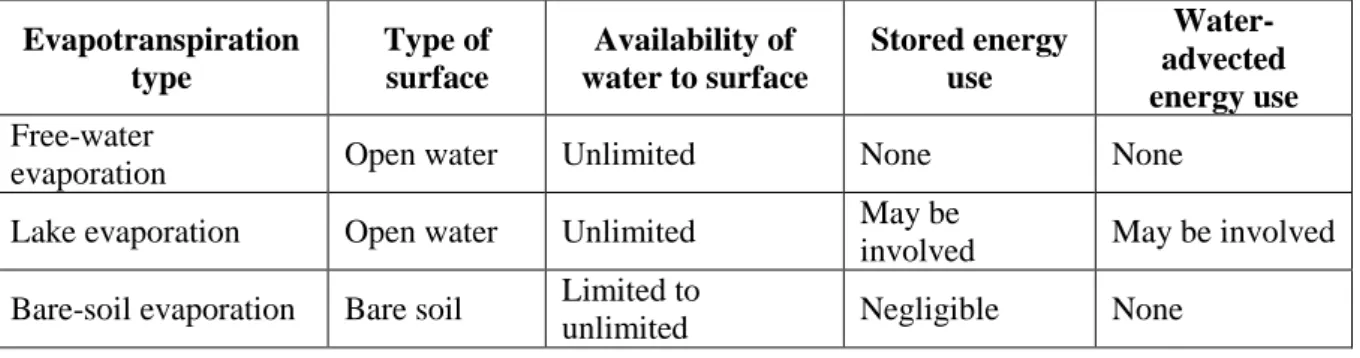
2.7. Categorization of evapotranspiration process ... 28
2.7.1. Free-water evaporation ... 29
2.7.2. Lake evaporation ... 29
2.7.3. Bare-soil evaporation ... 29
2.7.4. Transpiration ... 29
2.7.5. Interception and interception loss ... 30
2.8. Evapotranspiration ... 31
2.8.1. Lysimeters ... 33
2.8.2. Satellite or aircraft based remote sensing measurements ... 34
2.8.3. Potential evapotranspiration ... 35
2.9. Impact of climate changes on the hydrological cycle: results of water balance models 38 2.10. Discussion and research need ... 42
3. Objectives and research questions ... 44
4. Data and methods ... 45
4.1. Databases for calibration and validation ... 45
4.1.1. CREMAP ... 45
4.1.2. Weighing lysimeter ... 49
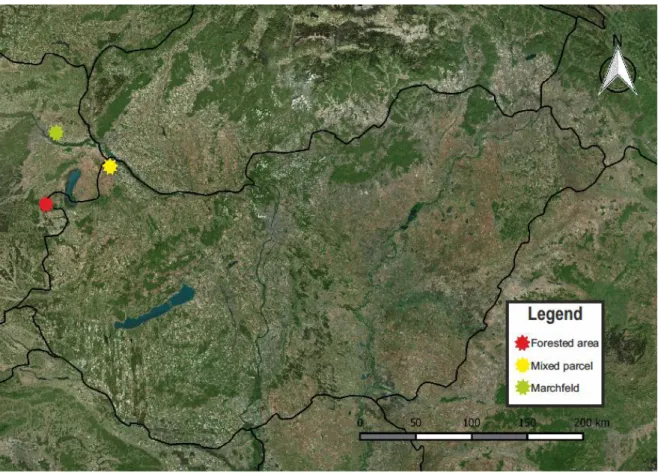
4.2. Study areas ... 52
4.2.1. Forested area ... 53
4.2.2. Mixed parcel ... 54
4.2.3. Marchfeld ... 55
6
4.3. The Thornthwaite-type hydrological model description ... 56
4.4. Model calibration and validation ... 59
4.5. Projection procedure ... 60
4.5.1. FORESEE database ... 60
4.5.2. Regional Climate Models ... 61
4.6. Water stress ... 63
4.7. Evaluating model performance ... 63
4.8. Rooting depth parameterisation of the Marchfeld ... 63
4.9. Summary of objectives and methods ... 64
5. Results ... 65
5.1. Methodical results ... 65
5.1.1. Calibration of the potential evapotranspiration ... 65
5.1.2. Calibration of the actual evapotranspiration ... 65
5.2. Results of calibration of potential evapotranspiration ... 66
5.3. Results of the calibration of actual evapotranspiration ... 67
5.4. Results of validation ... 67
5.5. Results of the model adjustments ... 68
5.6. Results and tendencies of the Regional Climate Models ... 70
5.7. Results of the projections for the 21st century ... 71
5.8. Results of the water stress analyses ... 77
5.9. Comparison of the static rooting depth and the adaptive rooting depth of the plants at Marchfeld ... 82
6. Discussion and Conclusions ... 86
7. Outlook ... 91
8. Theses of the dissertation ... 92
Acknowledgement ... 94
References ... 95
List of figures ... 110
List of tables ... 113
Annex ... 114
Annex 1. The identification numbers (ID) of the grid cells over Hungary with the involved areas (The IDs are illustrated on Figure 4.6.) ... 114
Annex 2. The original model with snowpacks and snowmelts ... 115
Annex 3. Input and results databases of study areas for present ... 116
Annex 4. The script of the model ... 133
Annex 5. Annual mean values of temperature and precipitation derived from the regional climate models at the 3 study area from 1985 to 2100 with standard deviations in parentheses ... 153
7
List of symbols and abbreviations
a first parameters of the linear transformations (dimensionless)
AET actual evapotranspiration (mm)
b second parameters of the linear transformations (dimensionless) c Priestley-Taylor constant (dimensionless)
CRAN Comprehensive R Archieve Network
CREMAP Calibration-Free Evapotranspiration Mapping
DW drainage (mm)
daylenght (hour)
E evaporation (m · s-1); (mm · month-1); (kg · m-2 s-1) ea vapor pressure of overlaying air (Pa)
saturation vapor pressure at the air temperature (kPa) es vapor pressure of evaporating surface (Pa)
e*s saturation vapor pressure at the surface temperature (kPa) em* saturation vapor pressure (kPa)
ET evapotranspiration (mm)
ETCREMAP remote-sensing based actual evapotranspiration (mm)
ETLYSIMETER actual evapotranspiration values measured by weighing-lysimeter (mm)
Es simulated evapotranspiration (mm)
ETMSR_i time series of measured ET values (mm)
ETM monthly actual evapotranspiration (mm · month-1) ETSIM_i time series of simulated values (mm)
ETW wet environment evaporation (mm)
EWM maximum extractable water (mm)
FAO United Nations Food and Agricultural Organization f(u) wind function (mm · day-1 · hPa-1)
GHG greenhouse gas
GCM general circulation model
GOUT groundwater outflow (mm)
H upward rate of sensible heat exchange (J)
KE coefficient that reflects the efficiency of vertical transport of water vapor by the turbulent eddies of the wind (1· Pa-1)
LE latent heat exchange (J · s-1 m-2)
mMSR_i average value of ET measured in the study period (mm) MODIS Moderate Resolution Imaging Spectroradiometer
OMSZ Országos Meteorológiai Szolgálat (Hungarian Meteorological Service) P precipitation (mm); (mm· year −1)
PAW plant available water (mm)
PET potential evapotranspiration (mm)
PETCREMAP remote-sensing PET based on actual evapotranspiration at well-watered conditions (mm)
PETLYSIMETER actual evapotranspiration values measured by weighing-lysimeter at well-watered conditions (mm)
Hamon type potential evapotranspiration (mm) PETM calibrated monthly potential evapotranspiration (mm)
PM Penman-Monteith method
PM monthly summed precipitation (mm)
PT potential transpiration (mm · day-1)
8
Q runoff (mm)
Qm mean measured runoff (mm· year −1) Qn available energy at the surface (mm · day-1) R2 coefficient of determination (dimensionless) ra aerodynamic resistance (s · m-1)
RCM regional climate model
REW Relative Extractable Water (dimensionless)
Nash-Sutcliffe coefficients (dimensionless) SOILM monthly soil moisture (mm)
soil-water storage capacity (mm)
SOILM_10Percentile 10th percentile soil moisture minimum values (mm)
SWD Soil Water Deficit (mm)
T actual transpiration (mm · day-1)
Ta air temperature (˚C)
TM monthly summed temperature (˚C)
Ts temperature of the surface (˚C)
Tsw temperature based on the spatial averaging of coldest pixel values (˚C)
Tw water body temperature (˚C)
u2 mean horizontal wind velocity (m · s-1)
va wind speed (m · s-1)
VITUKI Környezetvédelmi és Vízgazdálkodási Kutató Intézet Nonprofit kft.
(Environment and Water Management Research Institute Nonprofit Ltd.)
relative humidity (dimensionless)
Wa relative humidity of the air (dimensionless) Y psychrometric constant (hPa · °C-1)
zi ith variable of segmented relationship (dimensionless) zrz rooting depth (vertical extent of root zone (mm)) zu; zt reference elevations (m)
Greek symbols:
β1 left slope of segmented relationship (dimensionless) β2 right slope of segmented relationship (dimensionless)
βe annual bias (mm· year−1)
ΔWlys daily change of soil water (mm · day−1) ΔWdrain daily change of drainage water (mm · day−1) ΔPlys daily change of precipitation (mm · day−1) ΔIlys daily change of irrigation (mm · day−1)
ΔETlys daily change of evapotranspiration (mm · day−1)
∆S change in soil water content (mm)
∆SOIL decrease in soil storage (mm)
slope of es curve at the temperature of air (hPa · °C-1)
latitude (°)
Γ day angle (°)
σ declination (°)
θfc water content at field capacity (dimensionless)
θpwp water content at permanent wilting point (dimensionless) λv latent heat vaporization (MJ · kg-1)
ψ break-point of segmented regression (dimensionless)
9
Abstract
Aim: The main purposes of this dissertation are (1) to establish a monthly step water balance model; (2) and to project the components of the water balance for the 21st century.
Methods: A Thornthwaite type monthly step water balance model (that requires only temperature and precipitation time series as inputs) has been utilized. The base model was calibrated and validated using measured actual evapotranspiration data. The key parameter is the water storage capacity of the soil, which can be also calibrated using measured actual evapotranspiration data. The maximal rooting depth is determinable if the physical properties of the soil are available. For testing the model, I utilized 3 different surface cover types, which are located in the western part of the Pannonian Basin (‘forested area’, ‘mixed parcel’, and an agricultural field called ‘Marchfeld’). Using the calibrated and validated model, projections were done for the 21st century for actual evapotranspiration and soil moisture. The projections are based on 4 bias-corrected regional climate models assuming on the A1B greenhouse gas emission scenario of the IPCC. I have done two model runs for the Marchfeld: the first is for the calibrated rooting depth situation, the second is with the assumption that the plants may try to adapt to the water stress by growing deeper roots.
Results: The base water balance model was successfully calibrated for the three different surface cover types. The determined relationship between the calculated and the measured actual evapotranspiration was tested on a validation data set, and it proved to be reliable for each study area. The projections demonstrate increasing actual evapotranspiration values in each case (forested area: +9%; mixed parcel: +6%; and Marchfeld: +8%) at the end of the 21st century. In the context of the 10th percentile minimum soil moisture values, I found an increasing trend for the forested area (+11%), whereas a strong decrease in case of Marchfeld (-41%) and the mixed parcel (-29%). The 30-year monthly means of evapotranspiration shows the maximum values in June and July, while in case of soil moisture, the minimum is in September. The water stress analysis indicates that water stress assumed to occur only in the Marchfeld during the 21st century. The comparison of the two run in the case of Marchfeld reveals that however the second run also projects increasing evapotranspiration values (+10%), and strongly decreasing soil moisture minimum values (10th percentile: -23%) for the 21st century, but calculation of the potential stress revealed that significant water stress may occur only in case of the first run.
Main conclusion: The developed model can estimate the soil-water storage capacity.
According to the projections of the water balance model less water stress is assumed to occur in case of vegetation with deep rooting depth, than with shallow rooting depth.
10
Kivonat
Cél: A disszertáció fő céljai (1) egy Thornthwaite típusú vízmérleg-modell létrehozása; (2) és annak paramétereire való előrejelzés a 21. századra.
Módszer: Egy Thornthwaite-típúsú, havi időlépcsős víz-mérleg modell (csak hőmérséklet és csapadék adatokat igényel bemeneti paraméterként) került felhasználásra. Az alap modellt mért aktuális párolgás adatokkal kalibráltam és validáltam. A kulcsparaméter a talaj maximális víztartó képessége, mely szintén az aktuális párolgás adatokkal kalibrálható. Ha a talaj fizikai paraméterei ismertek, a maximális gyökérmélység is meghatározható. Három különböző felszínborításon futattam a modellt, melyek a Kárpát-medence nyugati részén találhatóak (erdős terület, ”vegyes” parcella, és mezőgazdasági terület (Marchfeld)). A kalibrált és a validált modellt felhasználva, projekciókat végeztem a 21. századra, az aktuális párolgás és talaj-nedvesség paramétereire. A projekciókhoz 4 korrigált regionális klímamodell adatait használtam, melyek az A1B üvegházgáz kibocsátási forgatókönyvön alapulnak. Két külön modell-futtatást alkalmaztam a Marchfeld területén. Az első a kalibrált gyökérmélységre vonatkozik, míg a második azon a feltételezésen alapszik, hogy a növényzet próbál a vízhiányhoz alkalmazkodni a gyökérmélysége növelésével.
Eredmények: Az alap vízmérleg-modellt sikeresen kalibráltam a három különböző felszínborításra. A kalkulált és a mért aktuális párolgás között meghatározott kapcsolat a validációs időszakon került tesztelésre, és minden kutatási területen hiteles eredményt mutatott. Az előrejelzés mindhárom esetben emelkedő aktuális párolgás értékeket mutat (erdős terület: +9%; ’vegyes parcella’: +6%; Marchfeld: +8%), a 21. század végére. A talajnedvesség 10%-os percentilis minimumai esetén emelkedő tendencia várható az erdős területen (+11%), de erős csökkenés tapasztalható a „vegyes” parcella (-29%) és a Marchfeld esetén (-41%). A párolgás 30 éves havi dinamikája szerint június és július hónapokban jelentkezik a maximum, míg a talajnedvesség esetén a minimum értékek szeptemberben jelentkeznek. A víz stressz elemzés kimutatta, hogy egyedül a Marchfeld az a terület, ahol jelentős szárazság stressz prognosztizálható, a 21. század végére. A Marchfeld esetén, a két futtatás összehasonlításából kiderült, hogy a második futtatás is emelkedő aktuális párolgás értékeket (+10%), és erősen csökkenő talajnedvesség (10%-os percentilis) minimumokat (- 23%) mutat, de a potenciális stressz számítások rámutattak, hogy szignifikáns vízhiány csak az első futtatás esetén várható.
Fő konklúzió: A kifejlesztett modell révén becsülhető a talaj víztározó kapacitása. A klímamodellek eredményeinek felhasználásával történt futtatások szerint a jövőben, a nagyobb gyökerezési mélységű vegetációformákat a víz stressz kevésbé súlyosan érinti, mint a sekély gyökérmélységgel rendelkező társulásokat.
11
1. Introduction
1.1. Background and objective
The current and ongoing climate change can be characterized by a global temperature rise (an increase of 3.7 °C to 4.8 °C until 2100 relative to the period 1850-1900, according to the baseline scenarios – those without additional mitigation) (IPCC, 2014). Larger temperatures also reflect larger energy potentials in the atmosphere, which will accelerate the hydrological cycle. This acceleration means changes of the temporal distribution of the precipitation, which often results in an increase of the amount within a single precipitation event; however, the annual rainfall amount shows no significant change (Bartholy and Pongrácz, 2006).
Consequently, the most significant effect of climate change is its impact on the water cycle through altering precipitation patterns and the evapotranspiration processes at multiple scales (Sun et al., 2011a). The supposed changes in the distribution and amount of precipitation with the continuously increasing temperature may induce a higher rate in water consumption of the plants. In addition, this higher rate will generate changes in soil moisture, groundwater and after all in the water cycle.
Globally circa 62% of the precipitation that falls on the continents is evapotranspired and nevertheless, it exceeds runoff on all continents except of Antarctica (Dingman, 2002). In the Carpathian Basin 90% is evapotranspired, while the remaining 10% is runoff (Kovács, 2011).
Therefore, evapotranspiration plays an important role in the water availability on the land surface, thereby controlling the large scale distribution of plants and primary production (Vörösmarty et al., 1998). Evapotranspiration also plays a key role in runoff and water availability in agriculture. Furthermore, most of the world’s food supply is grown on irrigated land; thus, efficient irrigation requires reliable information on transpiration (Dingman, 2002).
Although evapotranspiration is a major component of the hydrologic water balance, it is not well understood (Wilson and Brown, 1992). Accordingly, the necessity of modeling and attaining a quantitative understanding of the evapotranspiration process is unquestionable, particularly in context of climate change projections. Consequently, further studies are required, especially on regional scale.
The overall objective of my dissertation is to reveal the impacts of climate change on water- cycle, considering the Carpathian Basin’s special climatic attributes in case of the agrarian and forestry sectors in the 21st century. To achieve this purpose, a robust water balance model has to be established. The model have to be calibrated and validated with measured actual evapotranspiration data for the 3 chosen study areas, which represent three different surface covers in the North-western part of the Carpathian basin and therefore, they can be assured reliable basis for projections for the 21st century with the help of the simulation results of 4 bias corrected regional climate model. Nevertheless, different kinds of water stress indices have to be determined to quantify the impacts of climate change on the vegetation.
12 1.2. Structure of the dissertation
Chapter 1 focuses on the background and the main objective of my dissertation. After the Introduction in Chapter 2 the processes and tendencies of climate change as well as its modeling possibilities, particularly for the future, are discussed. Furthermore, the physical process of evapotranspiration, its types and importance in context of water balance modeling as well as the recent studies and the required researches are described. Based on the main purpose of my dissertation, I formulated the objectives of my dissertation (Chapter 3).
Chapter 4 demonstrates the three case study areas, their input data and the used method in detail. After the model runs in Chapter 5, I introduce the methodical results and evaluate the concrete results of calibrations, validations and projections with comparison of the 3 study sites. In addition, another aspect of evaluation has been executed with taking into account the static rooting depth and the adaptive rooting depth of the plants in case of the Marchfeld, where water stress assumed to occur. Chapter 6 is the discussion of the results of recently released similar studies and a comparison with our results. The final conclusions are given in Chapter 6 as well. The outlook (Chapter 7) focuses on the potentials of the model development to a more accurate reliable phase, and the possible further utilization of it.
Finally, the Chapter 8 summarizes the theses of the dissertations.
13
2. Climate change and evapotranspiration
2.1. The climate change
There is a general agreement in regional climate change projections over Europe with the results of statistically significant warming in all seasons (Christensen et al., 2007; Jacob et al., 2008; Linden van der and Mitchell, 2009). Vautard et al. (2014) analyzed the changes in European regional climate associated with a 2 °C global warming relative to preindustrial climate. They used 30 years periods of an ensemble of global climate simulations of the SRES Scenario A1B, which downscaled at 25 km resolution using regional climate models (RCMs).
In context of the temperature, the main feature of the changes in Europe expected for a 2 °C global warming relative to a reference period (1971–2000) is higher warming (more than 2
°C) than the global average; however, significant differences were found across Europe. This difference means slightly weaker amplitude than the global warming over Northwestern Europe, although a more intense warming (up to 3 °C) in Southern Europe in summer as well as in Northern and Eastern Europe in winter (Vautard et al., 2014).
It has to be noted that the European society is nevertheless particularly vulnerable to changes in the frequency and intensity of extreme events like heat waves, heavy precipitation, droughts, and wind storms (Beniston, 2007). The 2003 heat wave (Beniston 2004; Schär et al., 2004), the “1999 wind-storm of the century” (Goyette et al., 2003; Ulbrich et al., 2000) and the recurring flood events in numerous parts of Europe (e.g., Christensen and Christensen, 2003; Kundzewicz et al., 1999), are great examples of extremes and can be the cause for concern.
In Hungary, the warming process in question was the most intense in the last 30 years, and the most significant increase in temperatures occurred during the summer when temperature have risen by as much as 2 °C (Bartholy et al., 2011; Lakatos et al., 2012). This warming process induced the more frequent appearance of aridity as well as extreme weather events during 20th century (Nováky and Bálint, 2013).
Nonetheless, a consensus emerged on the climate projections, which indicated the further increase of temperature (expected in all of the seasons) and of climatic aridity for the 21st century in Hungary. The projected warming can be between 2-5 °C depending on the applied climate model and emission scenario (Nováky and Bálint, 2013; Pongrácz et al., 2011).
Consequently, in our country in case of the largest projected change the annual average temperature can be equal with recent averages of south Mediterranean areas in the end of the 21st century (Mika, 1999; URL1).
In general, one of the most significant political, scientific and social challenges of the 21st century is the climate change (IPCC, 2014). To mitigate the intensity of this change, humanity has made many efforts to ease their anthropogenic greenhouse gas emissions down. However, it is not expected to be reduced to the desired level. In order to reduce the potential damages of the changing environmental conditions, the policy-makers has to evaluate the effects of the climate change as well as needs to apply adaptation strategies (IPCC, 2007). Nonetheless, when the policy-makers determine those adaptation and mitigation responses to climate
14
change, the uncertainty in the projections of future climate have to be considered and quantified (Christensen and Christensen, 2007). Furthermore, many natural and socio- economic systems are affected by the meteorological conditions, moreover there is an increasing demand on impact studies, and thus the requirement of a reliable climate database (especially in context of the future projections) is unquestionable.
2.2. Climate models
Climate models are mathematical representations of the climate, which divide the Earth’s atmosphere and oceans into a grid. The models calculate every point’s values of projected variables for the future over time - surface pressure, temperature, wind, humidity, rainfall.
The best known climate models are the “atmospheric general circulation models” (GCMs) (URL2; URL3). Therefore, GCMs are the main tools that project future climate change information (Chen et al., 2013).
A main limitation of GCMs is the relatively rough horizontal resolution (run at coarse spatial resolution; from 250 to 600 km (URL4). Consequently, GCMs are unable to capture sub-grid cell features and fine scale, topography-induced local characteristics. Because of this, GCM results are not feasible to demonstrate and evaluate local-scale changes; consequently several downscaling methods were developed. In case of dynamical downscaling, higher spatial resolution models (so called regional climate models, RCMs) are run using GCM outputs as driver (Giorgi, 1990). The RCMs are able to simulate smaller-scale atmospheric processes, due to their higher resolution topography and physics (Olsson, 2014). RCMs typically cover a 10 · 10 km2 area (URL3).
In context of the hydrological models in order to evaluating the hydrological impacts of climate change, the GCMs’ outputs cannot be directly applied (Sharma et al., 2007; Hansen et al., 2006; Feddersen and Andersen, 2005; Chen et al., 2011a). The reason is that data provided by GCMs with spatial resolution below 200 km is not reliable for most hydrological- relevant variables (Fowler et al., 2007; Grotch and MacCracken, 1991; IPCC, 2007; Salathé, 2003). Therefore, when assessing the effects of climate change on a watershed scale, the use of RCMs instead of GCMs is recommended, because RCMs have proven to provide more reliable results for impact studies of climate change on regional water resources (Buytaert et al., 2010; Elguindi et al., 2011). RCMs are more consistent at reproducing relevant mesoscale patterns of local precipitation, thus they can much better represent the topographic effects on precipitation at a regional scale (Frei et al., 2003, 2006; Intergovernmental Panel on Climate Change, 2007; Buonomo et al., 2007).
It is important to note that all numerical models (as climate models) have systematic error (in varying extent), which means the difference between the simulated value and the observed (Christensen et al., 2008; Teutschbein and Seibert, 2010; Varis et al., 2004). These systematic errors are quite stable in time (e. g. equals in the past and in the future (Maraun, 2012)), consequently if just the projectable changes are studied, the caused problem by those errors are negligible. Nevertheless, problems arise if realistic data are needed for a climate change related impact study (Dobor et al., 2012). Consequently, the output of climate models cannot be applied in numerous hydrological simulations and in climate change impact studies
15
without any preprocessing in order to remove the occurring biases (Chen et al., 2013; Haerter et al. 2011; Sharma et al., 2007; Hansen et al., 2006; Christensen et al., 2008). Bias is defined as the time independent component of the mentioned systematic error (Haerter et al., 2010).
Nevertheless, RCMs may also have significant biases when comparing the simulated and the observed climate data at the same period (Christensen et al., 2008; Teutschbein and Seibert, 2010; Varis et al., 2004). The biases include systematic model errors caused by imperfect conceptualization, discretization and spatial averaging within grid cells. Besides, the observed precipitation and temperature data can be subjected to biases as well. The direct applying of RCMs for hydrological impact studies is possible, if a calibrated hydrological model (utilizing RCM outputs) is able to appropriately reproduce the observed data with realistic internal parameters. Hence, the temperature and precipitation of RCM are no more biased than observed data.
During the bias correction procedures, a transformation algorithm is utilized for adjusting RCM output. The main concept is the recognition of possible biases between observed and simulated climate variables, which is the basis for correcting control and scenario RCM runs as well (Teutschbein and Seibert, 2012). According to Haerter (2007), the sole purpose of bias correction is to eliminate the time independent component of the systematic error if it exists. Bias correction methods have to be stationary. This means that the correction algorithm and parameterization of it are valid for present climate conditions as well as for future conditions (Teutschbein and Seibert, 2012).
The inappropriate representations of dynamical and/or physical processes cannot be corrected by bias correction and model data must provide a suitable representation of the physical system from the outset, which ensure the applicability of the statistical bias correction (Haerter et al. 2011). Employ of uncorrected model output can lead to serious implications for various applications.
It is well known that several bias correction techniques have been developed to downscale meteorological variables from the RCMs, ranging from the simple scaling approach to sophisticated distribution mapping (Teutschbein and Seibert, 2012; Sharma et al., 2007; Piani et al., 2010; Mpelasoka and Chiew, 2009; Ryu et al., 2009; Chen et al., 2011b, 2013; Salvi et al., 2011; Iizumi et al., 2011; Lafon et al., 2012).
The most popular bias correction methods are the following:
Linear scaling (for precipitation and temperature) (Lenderink et al., 2007).
Local intensity scaling (for precipitation) (Schmidli et al., 2006).
Power transformation (for precipitation) (Teutschbein and Seibert, 2012).
Variance scaling (for temperature) (Terink et al., 2010; Teutschbein and Seibert, 2012).
Distribution mapping (for precipitation and temperature) (Themeßl et al., 2012).
Quantile mapping (for precipitation): (Chen et al., 2013; Sun et al., 2011b; Themeßl et al., 2012; Wilcke et al., 2013).
Considering the overall objective of this dissertation (evaluating the hydrological impacts of climate change), regional climate models were required with their fine scale as inputs for
16
projections. I have chosen a bias-corrected database as input to achieve reliable, realistic projections, namely ‘FORESEE’, which was established for Central Europe. The details about the FORESEE database can be found on Chapter 4.5.1.
2.3. Hydrological effects of climate change
In Europe the annual precipitation sum is projected to increase in the northern, and decrease in the southern regions towards the end of the 21st century (Kjellström et al., 2011). In context of the heavy precipitation there may be robust increase everywhere in Europe and in all seasons, except Southern Europe in summer (Vautard et al., 2014).
In the transition zone, where the Carpathian Basin is located, the changes are smaller and statistically insignificant. However, the mean annual precipitation for the whole country decreased during the 20th century by one average monthly precipitation (~7%) (Szalai, 2011).
Projections show a northward shift of the transition zone in summer resulting in a decrease of the precipitation amount in the Carpathian Basin, while the southward shift of the transition zone in winter may results in increase of precipitation. The Carpathian Basin has nevertheless irregular precipitation distribution that may lead equally to more frequent heavy precipitation events or severe droughts (Gálos et al., 2015; Nováky and Bálint, 2013).
In Hungary, the extreme events have become more prevalent in the last 30 years and this tendency is expected to continue in the 21st century (Gálos et al., 2007; Lakatos et al., 2012).
Based on the special report of the IPCC (IPCC, 2012) it is very likely that natural disasters - floods, droughts, extreme precipitation events (intense rainfalls and severe droughts) etc. –, can be more frequent due to climate change, because these are influenced by the expected intensification of the hydrological cycle. Therefore, the most significant effect of climate change is its impact on the water cycle through altering precipitation patterns and the evapotranspiration processes at multiple scales (Pongrácz et al., 2014; Sun et al., 2011a). The water cycle has been becoming more intense, therefore the atmosphere contains more water at the same time and/or the retention time of the water vapor in atmosphere will be shorter.
Either process will affect to ocean-land and meridional energy transfer, which might change the range and condition of climate. Thus, the climate change can cause changes in the water balance equations structure. In case of arid climates the hydrological balance can move to the direction of the evapotranspiration, while the more humid conditions may move to the direction of runoff (Keve and Nováky, 2010).
The most important hydrological effects of the climate change can be summarized as follows:
- The water quality can be worse, due to the higher water temperature and lower water level with constant water pollution (pollutant and thermal pollution).
- The dynamic groundwater storage might be decreased.
- Increasing probability of extremes (e.g. floods, droughts, inland inundation).
- The required water in agriculture and fishponds may strongly increase.
- The watercourses low-stage water resources can decrease in summer, as well as the low-water periods are expected to become more frequent (ponds and shallow water lakes may dry out) (Somlyódy et al., 2010).
17
Consequently, the climate change may cause a great impact on water management as fresh water demand for irrigation in summer (Somlyódy et al., 2010).
2.3.1. Floods, inland inundation and droughts
Management of the risk connected with hydrological extremes, i.e. droughts and floods are great challenges for the modern society in context of the changing climate (Vörösmarty et al., 2000; Oki and Kanae, 2006).
According to the IPCC SREX report (IPCC, 2012), floods are defined as: “the overflowing of the normal confines of a stream or other body of water or the accumulation of water over areas that are not normally submerged. Floods include river (fluvial) floods, flash floods, urban floods, pluvial floods, sewer floods, coastal floods, and glacial lake outburst floods.”
Floods are affected by various characteristics of the climatic system, particularly the precipitation (intensity, duration, amount, timing, phase), but temperature patterns (responsible for such phenomena as soil freezing, snow and ice melt and ice jam formation) as well. In addition, floods are also affected by drainage basin conditions (pre-existing water levels in rivers, the snow and ice cover, the soil character and status (permeability, soil moisture content and its vertical distribution)), the rate of urbanization, and the presence of dikes, dams and reservoirs (Bates et al., 2008).
In Hungary the triggers and effects of the floods can be categorized to large, medium and small rivers, furthermore spring and summer transit times. In the case of large rivers the spring floods are determined by the thickness of the stored snow mass, its melting speed and greater precipitations in early spring (Somlyódy et al., 2010).
If the snow accumulation, sudden melting in large areas and significant precipitation appear in spring, there will be higher probability of the occurrence of the countrywide extreme inland inundations (exceeding 250.000 ha). Moreover, the drainage system capacity of the inland inundation is limited; therefore, a flood wave can be also an additional factor to the occurrence of the extreme inland inundations. Considering the climate change predictions for Hungary, the significant inland inundations mainly appear in the late of the winter or in the early spring. These periods generally related to floods. However, this process will be compensated somewhat with the drying up. The occurrence of years followed by each other with highly or moderate inland waters affections will probably decrease, but inland inundations generated by the intensive great precipitations in summer, may slightly increase (Somlyódy et al., 2010).
As a climate related natural hazard, drought is a frequent, widespread as well as recurring event. It can occur in all climate zones and impacts the local ecological and social environment (Namias, 1966; Riebsame et. al, 1991; Wang et al., 2003).
Drought is usually defined based on the degree of dryness, plus the duration of the dry period (Palmer, 1965). Landsberg (1982) considered drought as a shortage of precipitation over an extended period of time, which may results in a water deficiency for some activity, group or environmental sector (Liu et al., 2011).
18
In the future, the occurrence of drought periods can increase with high probability. The reasons as follows:
- Increase in temperature and therefore in evapotranspiration - Decrease of summer precipitation
- Days without precipitation will increase (Lakatos et al., 2012).
Droughts are recurrent event in the climate of the Carpathian Basin, and might be more frequent and severe until the end of the century (Gálos et al., 2007, Gálos et al., 2015).
2.3.2. Climate change impacts on soil moisture, groundwater level and plants physiology Revealing the potential effects of climate variability and change on groundwater is more difficult than on surface water, since the most noticeable impacts of climate change can be observed in surface water levels and quality (Holman, 2006; Winter, 1983; Leith and Whitfield, 1998). However, there are potential effects on the quantity and quality of groundwater as well (Zektser and Loaiciga, 1993; Bear and Cheng, 1999). Although, the groundwater-residence times can range from days to tens of thousands of years or even more, which delays and disperses the effects of climate and makes difficult to determine the responses in the groundwater to climate variability and change (Chen et al., 2004).
In the context of groundwater recharge, the precipitation and the evapotranspiration are especially important, since they have direct effect on it. Even small changes in precipitation may alter greatly the recharge in semiarid and arid regions (Woldeamlak et al., 2007).
During the 1990s, several studies on groundwater figured out that climate change will have a negative impact on groundwater reserves in many parts of the Earth (Goderniaux et al., 2009a, 2009b; Van Roosmalen et al., 2009; Scibek et al., 2007; Serrat-Capdevila et al., 2007;
Woldeamlak et al., 2007; Holman, 2006; Scibek and Allen, 2006b, 2006a; Allen et al., 2004;
Brouye`re et al., 2004a; Chen et al., 2004; Loaiciga, 2003; Chen et al., 2002; Yusoff et al., 2002; Loaiciga et al., 2000).
Nevertheless, the groundwater has some buffer capacity against extremes for short term, but if several extremely dry years follow each other, the buffer capacity may deplete (Somlyódy et al. 2010).
Soil moisture is stored water amount in the unsaturated soil zone/vadose zone (where the pores contain water and air as well) (Seneviratne et al., 2010). However, soil water (particularly in the recharge zone) is an essential component of the hydrologic cycle, especially in those climates where the available precipitation is insufficient to meet the demands of plants (Keables and Mehta, 2010). Plant available water (PAW) is the maximum amount of water that plants can extract from the soil, and nevertheless the water amount which is potentially available to the atmosphere through evapotranspiration. Furthermore, PAW is the function of soil texture, soil structure and rooting depth (Nebo and Sumaya, 2012). The plant available water is determined by hydraulic properties of soil, the nature of soil and the water retention capacity.
Precipitation, ground and surface water refill the water that stored in the soils under natural conditions (Nebo and Sumaya, 2012). Consequently, the recharge – induced mainly by the
19
infiltration from the precipitation – plays a key role not just in the condition of groundwater, but even in case of the available water for the plants. This recharge depends on the difference of winter half term’s precipitation and potential evapotranspirations and on the soil moisture conditions in late autumn (Simonffy, 2003).
Moreover, in the dormancy, the ordinary refilled soil water level will also decrease due to climate change, therefore the water amount that moves up to the roots of the plants through the capillary zone can also decrease. This process may intensify the drought probability (Somlyódy et al. 2010).
The intense aridity in summer will decrease the soil moisture in the late of autumn; therefore higher rate of winter precipitation will be consumed to replenishment of the water that stored in the soil, and lower rate for infiltration remains to supply the groundwater (Figure 2.1.).
Figure 2.1. The saturated and the unsaturated zones (URL7)
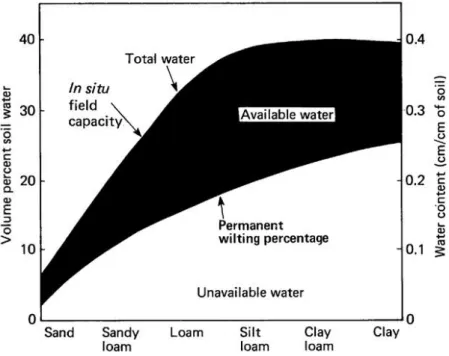
The plant available water can be calculated as the difference between the field capacity and the permanent wilting point (Figure 2.2.).
The Glossary of Soil Science Terms (2008) defined field water or field capacity as “the content of water, on a mass or volume basis, remaining in a soil 2 or 3 days after having been wetted with water and after free drainage is negligible.” Field capacity is the upper limit of the available soil water reservoir, from which water can be released, but not necessarily absorbed by plants, until the permanent wilting point is reached. The matric potential at the field capacity is around -1/10 to – 1/3 bar. In equilibrium, this potential would be applied on the soil capillaries at the soil surface when the water table is between 3 to about 10 feet below the soil surface, respectively. The larger pores drain first the gravity drainage, if not restricted, it may only take hours; while in clay soils (without macropores), gravity drainage may take even two to three days. The volumetric soil moisture content remaining at field capacity is about 15 to 25% for sandy soils, 35 to 45% for loam soils, and 45 to 55% for clay soils (URL5).
20
The permanent wilting point is the water content of a soil when most plants (corn, wheat, sunflowers) wilt and fail to recover their turgor upon rewetting. The matric potential at this soil moisture condition is commonly estimated at -15 bar. Most agricultural plants will generally show signs of wilting long before this moisture potential or water content is reached (more typically at around -2 to -5 bars) because the rate of water movement to the roots decreases and the stomata tend to lose their turgor pressure and begin to restrict transpiration.
This water is strongly retained and trapped in the smaller pores and does not readily flow. The volumetric soil moisture content at the wilting point will have dropped to around 5 to 10% for sandy soils, 10 to 15% in loam soils, and 15 to 20% in clay soils (URL6).
Figure 2.2. The available water in the different case of physical soil types (URL8) In the soil-plant-atmosphere continuum water fluxes are controlled by atmospheric evaporative demand but limited by soil water supply. The ratio of actual transpiration (T) and potential transpiration (PT) and therefore relative transpiration (T/TP) is converging to 1, under wet soil condition (Figure 2.3.). That means the roots of plants can supply enough water into the canopy to maintain the evaporation generated by atmospheric demand, consequently the wilting of the plants is prevented. This is an atmospheric demand limited phase. The value of relative transpiration is starting to decrease below 1, when the soil dries beyond field capacity, therefore this process is water supply limited. Beyond the permanent wilting point, the relative transpiration value is equal to 0 and the transpiration discontinues (Nebo and Sumaya, 2012).
21
Figure 2.3. Actual yield/maximum yield (Nebo and Sumaya, 2012)
In regard to the previously written facts, the climate change also influences the plants physiology:
- By reason of the high temperature values in summer, the constraint of transpiration will increase, but the decreased amount of precipitation blocks the process simultaneously.
- For certain plants, the large amount of precipitation falls in winter cannot be utilized, because of its infiltration. That results in high soil water level.
- The combination of species will be changing that means there will be more frequent occurrence of heat tolerant species. In addition, they will change the water balance (runoff, soil water) through the altered transpiration conditions.
Consequently, climate change influences the richness and distribution of plants as well (Sommer et al., 2010).
Climate change is having significant and widespread impacts on the forest (as the most complex ecosystems on the Earth) worldwide and consequently, on the forest sector as well (Moore and Allard, 2008). These impacts of the climate change on the forest management can be studied analyzing interdependent processes. In Hungary climate change can lead to increasing temperature, decreasing precipitation amount for summer as well as to increasing probability of extreme events that affect the distribution, vitality and growth of forest ecosystems (Mátyás and Czimber, 2000, 2004; Berki et al., 2009; Czúcz et al., 2010; Gálos et al., 2015, Mátyás, 2010; Mátyás et al., 2010, Molnár and Lakatos, 2007, Führer, 1995;
Manninger, 2004; Solymos, 2009; Somogyi, 2009; Csáki et al., 2014).
In addition, the vegetation is not just an indicator of the climate, but plays a key role in the weather and climate change. The reason is because in case of plant covered surfaces, the albedo is lower, but the roughness as well as the evaporating surface is higher than on a bare soil. Consequently, the plant covered surfaces affect to the atmosphere energy and hydrological cycle (Bonan, 2004). In Hungary the impact of vegetation on water balance was analyzed in the frame of small catchment research (Gribovszki et al., 2006) as well as paired plot analysis (Móricz et al., 2012).
22
As we have seen the climate change may strongly modify the water cycle through many different but connected processes. Considering the overall objective of my dissertation to reveal the impacts of climate change on water-cycle, a water balance model has to be established. Before the establishment, we have to introduce how a water balance equation is working.
2.4. Water-balance approaches and the role of the evapotranspiration in them
The water balance modeling is essential in the assessment and management of water resources, especially under the effects of human disturbed land use as well as in context of climate change. The quantification of water balance is basically a challenge, because of its complexity, variability of its spatial and temporal dimensions and uncertainties as well (Nebo and Sumaya, 2012).
In the case of a land surface the classic form of the long-term water-balance equation is what follows:
– – (eq. 2.1.)
Where:
ET: evapotranspiration P: precipitation
Q: streamflow
GOUT: groundwater outflow (Dingman, 2002)
Considering eq. 2.1., the measurement of water inputs, outputs and solving the water-balance equation for a given region and time period (∆T) is a common way to determine the actual evapotranspiration. Nevertheless, it is essential to provide a reliable estimate of regional precipitation, measurement of liquid outflows (particularly if the groundwater flow is significant) as well as assuring that the changes in storage can be neglected in the given period. The changes in storage is negligible, if the given time period is only few years and the storage is in the form of soil water, hence this assumption leads to only small errors in estimating ET. Nonetheless, those errors can be minimized if one chooses a hydrological year that begins and ends during the dormant season, when soil moisture is near the soil-water storage capacity (Dingman, 2002).
23
Figure 2.4. The water-cycle (URL9)
Based on the previously written facts and considering Figure 2.4., it can be said that in the global hydrologic cycle between the atmosphere and land surface, the evapotranspiration is the primary link (Dingman, 2002). Nevertheless, 97% of the evapotranspiration is derived from land surfaces, and 3% from open-water evaporation. Although evapotranspiration is a major component of hydrologic water balance, it is not well understood (Wilson and Brown, 1992). In addition, evapotranspiration is a very effective vehicle for mass and energy transfer (due to the high latent heat of vaporization value of water) between the land- or vegetation surface and the ambient atmosphere (Szilágyi and Józsa, 2009; Csáki et al., 2014).
Here, the terms of evaporation, transpiration and evapotranspiration have to be defined.
Evaporation covers all processes in which liquid water is transferred to the atmosphere as water vapor. Considering that evaporation is a collective term, thus it includes: evaporation of water from reservoirs, lakes, soil surfaces and also from water intercepted by vegetative surfaces. Most of the time evaporation’s dimension is depth per unit time, such as mm day-1. It can be expressed as energy during a day and noting that the latent heat of water is 2.45 MJ · kg-1 (at 20 °C) it follows 1 mm · day-1 of evaporation equals 2.45 MJ · m-2 · day-1 (McMahon et al., 2013).
Transpiration means the evaporation from within the leaves of plants with water vapor flux through leaf stomata (Maidment, 1993).
The sum of the transpiration and evaporation can be defined as evapotranspiration (Allen et al.
1998). Nonetheless, evaporation and transpiration occur simultaneously.
24 2.5. Significance of evapotranspiration
Globally circa 62% of the precipitation that falls on the continents is evapotranspired (from over 90% in Australia to approximately 60% in Europe (McMahon et al., 2013)). In Hungary, the evapotranspired rate for fallen precipitation is 90% while the remaining 10% is runoff (Dingman, 2002; Kovács, 2011). The runoff is exceeded by evapotranspiration on all continent (except Antarctica) and most of the river basins. Consequently, the evapotranspiration determines the water availability at land surfaces and controls the large scale distribution of plant communities and primary production (Vörösmarty, 1998). Thus, the necessity of modelling and attaining a quantitative understanding of the evapotranspiration process is unquestionable in many practical contexts:
Evapotranspiration is the main component of the energy and water-vapor exchange between the atmosphere and land surfaces, therefore climate change projections need to consider the related processes. Furthermore, impact assessments should relay on appropriate modeling of evapotranspiration.
The difference between precipitation and evapotranspiration over long term means the availability of water for direct human use as well as for management. Hence, quantitative assessments of water resources and the effects of climate change and land use alteration on those resources require quantitative understanding of evapotranspiration.
Most of the water that consumed by plants is a water “loss” through evapotranspiration. The plants that form the base of the earth’s land ecosystem use this water to their growing process. Thus, comprehension of the relations between evapotranspiration and ecosystem type is necessary for prediction of the ecosystem’s response to climate change.
Irrigation means one of the highest water usage all over the world, and the world’s food supply is grown mainly on irrigated lands, therefore efficient irrigation needs accurate information of crop water uses (transpiration).
The yield of water-supply reservoirs and consequently the economics of building reservoirs of various sizes are significantly influenced by the evaporation.
The “wetness” of the land determines considerably the fraction of water falling in a given rainstorm that contributes to streamflow and to groundwater. To quantify this wetness, the evapotranspiration has to be determined, which has occured since the previous storm (Dingman, 2002).
2.6. Physical process of the evaporation and the turbulent energy exchange
The exchange of water molecules between air and water surfaces includes two processes. First is condensation, which means the capturing process of molecules that move from the air towards the surface. The second is vaporization, which is the molecules movement away from surface. The vaporization rate is a function of temperature, while the condensation rate is a function of vapor pressure. The difference between those rates is the evaporation rate. The condensation and the evaporation occur simultaneously. They are dynamic process, but with increasing of the temperature (what also means greater molecular kinetic energy) the
25
evaporation dominates and with decreasing of the temperature the condensation dominates (Maidment, 1993).
The rate of evaporation from wet surfaces are determined by
surrounding airs physical state,
net available heat,
wetness of the evaporating surface (McMahon et al., 2013).
The physical state of surrounding air is determined by its vapor pressure, temperature and velocity (Monteith, 1991).
Quantifying the available heat energy for evaporation requires the understanding of surface radiation balance (Maidment, 1993). Therefore, the available heat energy for evaporation is equal with the net incoming radiation plus net input of water advected energy (associated with inflows and outflows to a water body), minus net output of sensible heat exchange to the atmosphere minus net output with conduction to the ground and minus the change in heat storage in the water body. The incoming shortwave solar radiation minus outgoing shortwaves makes the net incoming radiation. Moreover, the outgoing shortwave radiation is a function of surface albedo and can be calculated by the incoming longwave less the outgoing longwave.
Nonetheless, in case of the net incoming radiation, the heat for plant evaporation can be supplied by turbulent transfer by conduction from the soil as well as from the air (McMahon et al., 2013).
Besides the energy need for the latent heat, a process that removes the water vapor from the evaporating surface is required for the occurrence of evaporation. The atmospheric boundary layer is continually responding to large scale weather movements. That process sustain humidity deficit even over the oceans, and provide a sink for the water vapor (McMahon et al.
2013).
Directly above the surface there is thin non-turbulent layer, what generates the main resistance (called aerodynamic or atmospheric resistance) to evaporation flux (turbulent transfer) (Penman, 1948). In the case of leaves, the major resistance is the surface resistance, which is the function of stomatal opening in leaves (Monteith, 1991).
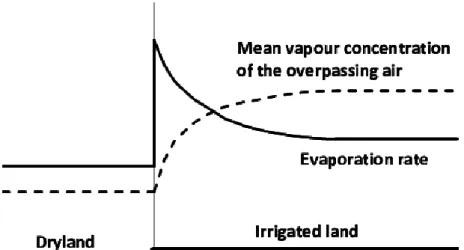
If air moves across the landscape, the water vapor is transported at the rate equal to the product of the water vapor content and the wind speed (Figure 2.5.). This transport is called advective flow. When air moves from a dry area to a wetter region, the concentration of water vapor increases at the transition to a higher value downwind. Furthermore, at the transition, the evaporation level immediately increases to a much higher level (because this originally dry air is unsaturated), and then slowly decreases to a value representative of the wetter region (McMahon et al., 2013). The low evaporation over the dryland means the overpassing air will be hotter and drier, thus increasing the available heat energy to increase evaporation in the downwind wetter (Morton, 1983).
26
Figure 2.5. The effect of advected air that passing from dryland over an irrigated land (McMahon et al., 2013)
Evaporation is basically a diffusive process considering the Fick’s first law.
E = KE∙ va∙ (es – ea) (eq. 2.2)
Where:
E: evaporation rate [m ∙ s-1] va: wind speed [m ∙ s-1]
KE: coefficient that reflects the efficiency of vertical transport of water vapor by the turbulent eddies of the wind [1∙ Pa-1]
es: vapor pressure of evaporating surface [Pa]
ea: vapor pressure of overlaying air [Pa]
It should be noted that there is a vapor transfer from higher to lower concentration (the transfer is “down the gradient”), the gradient would become smaller and smaller with time, and finally go away. Thus, to sustain evaporation, a process is required in which the evaporated water molecules blown away, consequently a vertical gradient can be maintained.
This explains why evaporation and the latent heat flux depend so critically on the turbulent wind field (Dingman, 2002).
2.6.1. Vapor-pressure relations
The vapor pressure of an evaporating surface (es) is equivalent to the saturation vapor pressure at the surface temperature (e*s) [kPa]. The saturation vapor pressure is a function of the temperature (Allen, 1998).
es = e*s (eq. 2.3.)
(eq. 2.4.)
Where:
Ts: temperature of the surface [˚C]
27
Nonetheless, the vapor pressure in the air is a function of air temperature (Ta) [˚C] and relative humidity of the air (Wa).
(eq. 2.5.)
saturation vapor pressure at the air temperature [kPa]
If we divide the actual vapor pressure of the air with the saturation vapor pressure of the air ones get relative humidity of the air (Bowen, 1926).
(eq. 2.6.)
Another important definition is the dew point, which is a temperature TD, where the air parcel is as cool as to become saturated. After further cooling down, condensation occurs (URL10).
2.6.2. Latent heat exchange and sensible heat exchange
The attractive intermolecular forces hold the molecules close together in liquid water. In this liquid phase, the molecules are circa 10 times closer to each other (and for that very reason the intermolecular forces are much more stronger) than in the water vapor. Latent heat of evaporation is the energy, which is needed to separate the molecules, or in other words, to work against the intermolecular forces.
Latent heat transfer from the evaporating body into the air is always accompanying the evaporation. This is a heat loss, which tends to reduce the surface temperature. However, this reduction partially or completely compensated by heat transfer to the surface from within the evaporating body or by radiative or sensible-heat transfer from the overlying air.
To calculate the latent heat exchange, the evaporation rate must be multiple by mass density of water (ρw) [kg · m3] and latent heat vaporization (λv [MJ · kg-1]; (2.501 · 106 J · kg-1)). The latter is the energy that is needed to break the hydrogen bonds.
LE = λv∙ ρw∙ E = λv ∙ ρw ∙ KE ∙ va ∙ (es – ea) (eq. 2.7.) LE [W· m-2 = J · s-1 m-2] and E [kg · m-2 s-1] (eq. 2.8.) When the temperature of evaporating surface increases, the latent heat of vaporization decreases.
The upward rate of sensible heat exchange (H) [J] by turbulent transfer can be expressed as:
H = KH∙ va∙ (Ts – Ta) (eq. 2.9.)
Normally, H is upward from the ground during the day, and downward at night to support radiant energy loss from the land surface (Maidment, 1993).
To enable and maintain evapotranspiration 4 basic conditions are needed:
Accessible liquid water;
Energy to break hydrogen bonds;
Vertical vapor pressure gradient;
Turbulence to blow out vapor molecules to sustain the vertical vapor pressure gradient (Dingman, 2002).