materials
Article
E ff ect of pH in the Hydrothermal Preparation of Bi 2 WO 6 Nanostructures
Teodóra Nagyné-Kovács1,* , Gubakhanim Shahnazarova1, István Endre Lukács2, Anna Szabó3, Klara Hernadi3 , Tamás Igricz4, Krisztina László5, Imre M. Szilágyi1 and György Pokol1,6
1 Department of Inorganic and Analytical Chemistry, Budapest University of Technology and Economics, M ˝uegyetem rakpart 3., H-1111 Budapest, Hungary; gubakhanim.shahnazarova@gmail.com (G.S.);
imre.szilagyi@mail.bme.hu (I.M.S.); pokol.gyorgy@ttk.mta.hu (G.P.)
2 Research Institute for Technical Physics and Materials Science, Hungarian Academy of Sciences, Konkoly Thege M.út 29-33., H-1121 Budapest, Hungary; lukacs.istvan@energia.mta.hu
3 Department of Applied and Environmental Chemistry, University of Szeged, Rerrich B.tér 1., H-6720 Szeged, Hungary; szabo.anna@chem.u-szeged.hu (A.S.); hernadi@chem.u-szeged.hu (K.H.)
4 Department of Organic Chemistry and Technology, Budapest University of Technology and Economics, M ˝uegyetem rakpart 3., H-1111 Budapest, Hungary; igricz.tamas@oct.bme.hu
5 Department of Physical Chemistry and Materials Science, Budapest University of Technology and Economics, M ˝uegyetem rakpart 3., H-1111 Budapest, Hungary; klaszlo@mail.bme.hu
6 Research Centre for Natural Sciences, Hungarian Academy of Sciences, Magyar tudósok körútja 2., H-1117 Budapest, Hungary
* Correspondence: kovacs.teodora@mail.bme.hu
Received: 26 April 2019; Accepted: 23 May 2019; Published: 28 May 2019 Abstract:In this study, Bi2WO6was prepared by the hydrothermal method. The effects of reaction temperature (150/170/200◦C) and reaction time (6/12/24 h) were investigated. The role of strongly acidic pH (1 >) and the full range between 0.3 and 13.5 were studied first. Every sample was studied by XRD and SEM; furthermore, the Bi2WO6samples prepared at different temperatures were examined in detail by EDX and TEM, as well as FT-IR, Raman and UV-vis spectroscopies. It was found that changing the temperature and time slightly influenced the crystallinity and morphology of the products. The most crystallized product formed at 200 ◦C, 24 h. The pure, sheet-like Bi2WO6, prepared at 200◦C, 24 h, and 0.3 pH, gradually transformed into a mixture of Bi2WO6and Bi3.84W0.16O6.24with increasing pH. The nanosheets turned into a morphology of mixed shapes in the acidic range (fibers, sheets, irregular forms), and became homogenous cube- and octahedral-like shapes in the alkaline range. Their band gaps were calculated and were found to vary between 2.66 and 2.59 eV as the temperature increased. The specific surface area measurements revealed that reducing the temperature favors the formation of a larger surface area (35.8/26/21.6 m2/g belonging to 150/170/200◦C, respectively).
Keywords: Bi2WO6; hydrothermal synthesis; full pH range; nanostructures; morphology
1. Introduction
Metal tungstates (MWO4, M=Ca, Sr, Mn, Cd, Pb, Fe, Bi, etc.) belong to a family of compounds rich in potential applications, and thus are the focus of many studies. Among their valuable features, one can find favorable photocatalytic and magnetic properties [1–7], as well as excellent luminescent activity [8–12], making them a candidate for luminescence thermometry, optical heaters, and appropriate media for lasers. Furthermore, they have potential in the field of gas or humidity sensing [13–18], but can be also used as an electrode material in Li+/Na+ion batteries, or as supercapacitors thanks to their great electrochemical properties [19–24].
Materials2019,12, 1728; doi:10.3390/ma12111728 www.mdpi.com/journal/materials
Materials2019,12, 1728 2 of 13
Among them, Bi2WO6is one of the most studied materials because of its remarkable photocatalytic activity and favorable band gap (approximately 2.70 eV) [25–34]. It can be synthetized in many ways such as sol-gel [25,35,36], the solvo- and hydrothermal method [33,37–43], spray pyrolysis [44], precipitation [1,45], or even solid-state reaction [1,46]. The most popular among them is the hydrothermal process, because of its simple apparatus and easy implementation. It also has the benefit of tailoring the crystalline structure, morphology, size of the specific surface area, and other characteristics of products through changing the synthesis parameters. Therefore, knowledge about the role of these parameters is essential. So far, numerous studies have reported on the effect of temperature, time, amount of raw materials/additives and pH in changing the morphology (flakes, sheets, spherical figures, rods, flower or nest-like architectures, etc.) [24,43–52]. There are some studies focusing on the effect of changing the pH at 200◦C, however, in these works, the very acidic (below pH 1) and very alkaline (above pH 13) ranges were not studied. In addition, in these works, the full pH range was not investigated, but rather only a part of it, that is, between pH 1–11, 2–12, 4–8, and 4–11 [26,53–59].
In this report, we present the study of the effect of the full pH range (0.3–13.5) in the hydrothermal preparation of Bi2WO6. We also examined the effect of reaction temperature (150/170/200◦C) and reaction time (6/12/24 h), in order to find the most appropriate parameters for the highly crystallized products. We studied the crystalline phases and the obtained morphology of the products by XRD and SEM, respectively. Moreover, the Bi2WO6samples prepared at different temperatures were further examined by EDX, TEM, FT-IR, Raman, and UV-vis, and their band gaps and specific surface areas were also determined.
2. Experimental
2.1. Hydrothermal Treatment
All of the chemicals were purchased from Sigma Aldrich (Darmstadt, Germany) and used without any further purifications.
For a typical synthesis, 0.49 g (0.0015 mol) Na2WO4·2H2O was dissolved in 9 mL 2 M HNO3 (solution A) and 1.50 g (0.0030 mol) Bi(NO3)3·5H2O was dissolved in 30 mL ion-exchanged water (solution B). Then, solution A was added drop by drop to solution B, which was followed by the formation of a light yellow precipitate. The pH was adjusted to the specified value by NaOH solution.
After stirring for 30 minutes at 500 rpm (DLAB MS-H-PRO+) (DLAB. Instruments Ltd., Beijing, China), 30 mL of solution was transferred into a 45 mL stainless steel Teflon-lined autoclave (Parr Instruments, Moline, United States) and put into an electric furnace (Nabertherm L9/11/B410) (Nabertherm Ltd., Lilienthal, Germany) at particular temperatures and times. After the heat treatment, the autoclave was cooled down to room temperature, the solution was filtered, and the yellowish precipitate was washed several times with water and ethanol. Finally, the sample was dried in a drying oven (Memmert Ltd., Schwabach, Germany) at 60◦C for 2 h.
The hydrothermal synthesis and their conditions are listed in Table1.
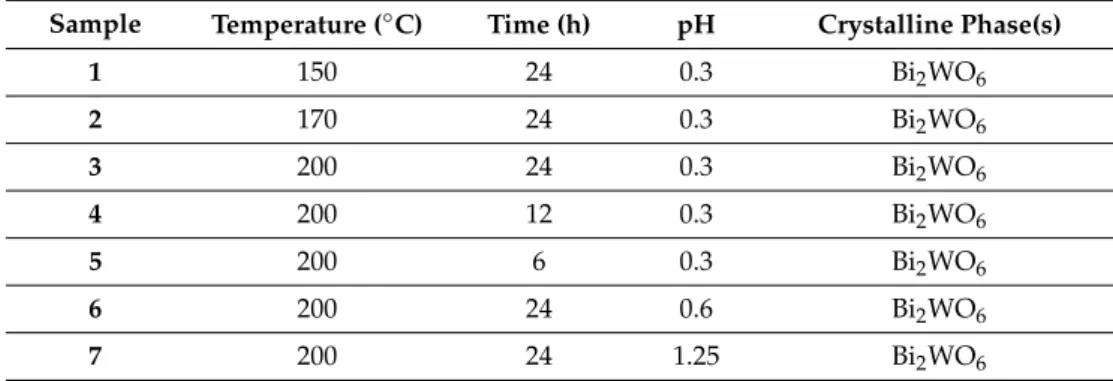
Table 1.Summary of the carried out hydrothermal reactions.
Sample Temperature (◦C) Time (h) pH Crystalline Phase(s)
1 150 24 0.3 Bi2WO6
2 170 24 0.3 Bi2WO6
3 200 24 0.3 Bi2WO6
4 200 12 0.3 Bi2WO6
5 200 6 0.3 Bi2WO6
6 200 24 0.6 Bi2WO6
7 200 24 1.25 Bi2WO6
Materials2019,12, 1728 3 of 13
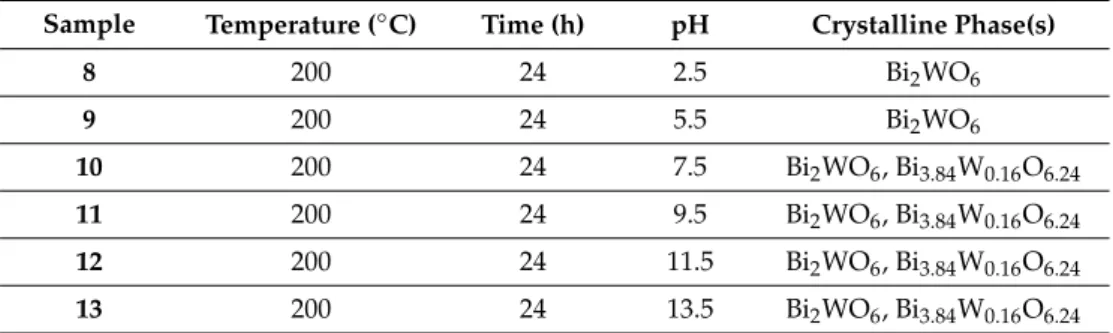
Table 1.Cont.
Sample Temperature (◦C) Time (h) pH Crystalline Phase(s)
8 200 24 2.5 Bi2WO6
9 200 24 5.5 Bi2WO6
10 200 24 7.5 Bi2WO6, Bi3.84W0.16O6.24
11 200 24 9.5 Bi2WO6, Bi3.84W0.16O6.24
12 200 24 11.5 Bi2WO6, Bi3.84W0.16O6.24
13 200 24 13.5 Bi2WO6, Bi3.84W0.16O6.24
2.2. Characterization
The crystalline phases were studied by XRD (X-ray Diffraction) using a PANanalytical X’Pert Pro MPD X-ray diffractometer (Malvern Pananalytical, Almelo, The Netherlands) with Cu Kα radiation (λ=0.15418 nm). For SEM (Scanning Electron Microscopy) and TEM (Transmission Electron Microscopy) measurements, a LEO1540 XB (LEO Electron Microscopy Inc., Thornwood, United States) and an FEI Tecnai G2 20 X-TWIN electron microscope (BIONAND, Malaga, Spain) operated at 200 keV, respectively, were used.
For determination of the specific surface area, the as-prepared samples were evacuated at 150 ◦C for 24 h before the measurement. Then, low temperature N2 adsorption/desorption isotherms were measured at−196◦C on a Nova2000e (Quantachrome) computer-controlled apparatus (Anton Paar Ltd., Graz, Austria). The specific surface area (SBET) calculations were made using the Brunauer–Emmett–Teller (BET) model [60].
Crystallite sizes were determined using the Scherrer formula: D=kλ/(β_mcosθ), where D (Å) is the thickness of the crystallite size, k a constant (0.9),λthe wavelength of the X-ray source (1.5418 Å), βthe broadening of the XRD reflection (full width at half maximum), andθ(rad) the diffraction angle.
The (131) main reflection was chosen for the calculations.
For the elemental composition examinations (EDX), we applied a JEOL JSM 5500-LV instrument (Jeol Ltd., Musashino, Japan). FT-IR (Fourier-Transformation Infra Red) spectra were recorded by a Perkin Elmer 2000 FT-IR spectrometer (Perkin Elmer, Waltham, United States) between 4000 and 450 cm−1applying KBr pellets (1 mg sample/300 mg KBr). Raman measurements were carried out by a Jobin Yvon LabRam spectrometer (Horiba, Miyanohigashi, Japan) equipped with an Olympus BX41 optical microscope using a frequency doubled Nd-YAG laser (532 nm). Diffuse reflectance UV-vis spectra were taken by a Jasco V-570 UV/VIS/NIR spectrometer (Jasco, Easton, United States).
3. Results and Discussion
3.1. Effect of Time and Temperature
The crystalline phases of1–5were investigated by XRD (Figure1). On the basis of the XRD patterns,1–5have five strong diffraction peaks at 28.4, 33.0, 47.3, 56.1, and 58.7◦, respectively, which can be attributed to the orthorhombic Bi2WO6phase (ICDD 01-079-2381, the main reflection (131) is labeled). Sharp, well distinguished XRD peaks indicate the well-crystallized structure without other peaks referring to impurities. Although the crystalline phases did not change, the crystallinity increased as a result of the higher reaction temperature and time, confirmed by the reflections of3 which are the sharpest and narrowest.
In Figure2, the SEM images show the featuring morphology of1–5. It is clear that the sheet-like morphology is characteristic of all samples, independent of the applied reaction temperature and time.
At 150 and 170◦C, the sheets are 10–20 nm thick and have various sizes, and fiber-like forms also appear (1–2, Figure2). However, a homogenous sheet-like morphology formed at 200◦C consisting of 10–20 nm thick and 200–400 nm wide angular forms (3, Figure2). Decreasing the time from 24 h to 12
Materials2019,12, 1728 4 of 13
and 6 h, the obtained morphology changed, because not only angular sheets, but also curved discs and fibers appear (4–5, Figure2).
Materials 2017, 10, x FOR PEER REVIEW 4 of 13
Figure 1. XRD patterns of the prepared Bi2WO6 samples applying different temperatures and times.
In Figure 2, the SEM images show the featuring morphology of 1–5. It is clear that the sheet-like morphology is characteristic of all samples, independent of the applied reaction temperature and time. At 150 and 170 °C, the sheets are 10–20 nm thick and have various sizes, and fiber-like forms also appear (1–2, Figure 2). However, a homogenous sheet-like morphology formed at 200 °C consisting of 10–20 nm thick and 200–400 nm wide angular forms (3, Figure 2). Decreasing the time from 24 h to 12 and 6 h, the obtained morphology changed, because not only angular sheets, but also curved discs and fibers appear (4–5, Figure 2).
Figure 1.XRD patterns of the prepared Bi2WO6samples applying different temperatures and times.
Materials 2017, 10, x FOR PEER REVIEW 4 of 13
Figure 1. XRD patterns of the prepared Bi2WO6 samples applying different temperatures and times.
In Figure 2, the SEM images show the featuring morphology of 1–5. It is clear that the sheet-like morphology is characteristic of all samples, independent of the applied reaction temperature and time. At 150 and 170 °C, the sheets are 10–20 nm thick and have various sizes, and fiber-like forms also appear (1–2, Figure 2). However, a homogenous sheet-like morphology formed at 200 °C consisting of 10–20 nm thick and 200–400 nm wide angular forms (3, Figure 2). Decreasing the time from 24 h to 12 and 6 h, the obtained morphology changed, because not only angular sheets, but also curved discs and fibers appear (4–5, Figure 2).
Figure 2.SEM images of Bi2WO6samples prepared at different temperatures and times.
Materials2019,12, 1728 5 of 13
3.2. Effect of pH
When changing the pH, both the crystalline phases and the morphology go through significant transformations.
On the basis of the XRD patterns of6–12, in the acidic range from 0.6 to 5.5 pH, all samples were identified as pure orthorhombic Bi2WO6(ICDD 01-079-2383, the main reflection (131) is labeled, Figure3). In the alkaline pH range, from a pH value of 7.5 to 13.5, the crystalline phases of the samples turned to a mixture of Bi2WO6and Bi3.84W0.16O6.24(ICDD 43-0447,10–13, the main peak (111) is labeled, Figure3). It can clearly be seen that the XRD peaks of the Bi3.84W0.16O6.24phase become gradually stronger along with the increasing pH, and finally develop into the most significant reflections.
Materials 2017, 10, x FOR PEER REVIEW 5 of 13
Figure 2. SEM images of Bi2WO6 samples prepared at different temperatures and times.
3.2. Effect of pH
When changing the pH, both the crystalline phases and the morphology go through significant transformations.
On the basis of the XRD patterns of 6–12, in the acidic range from 0.6 to 5.5 pH, all samples were identified as pure orthorhombic Bi2WO6 (ICDD 01-079-2383, the main reflection (131) is labeled, Figure 3). In the alkaline pH range, from a pH value of 7.5 to 13.5, the crystalline phases of the samples turned to a mixture of Bi2WO6 and Bi3.84W0.16O6.24 (ICDD 43-0447, 10–13, the main peak (111) is labeled, Figure 3). It can clearly be seen that the XRD peaks of the Bi3.84W0.16O6.24 phase become gradually stronger along with the increasing pH, and finally develop into the most significant reflections.
The distinct, sharp XRD peaks of the samples prepared in the alkaline range (10–13) indicate well-crystallized materials, in contrast with 6–9, which were synthetized using acidic pH (Figure 3).
Figure 3. XRD patterns of the Bi2WO6 samples prepared at 200 °C, 24 h using different pH values.
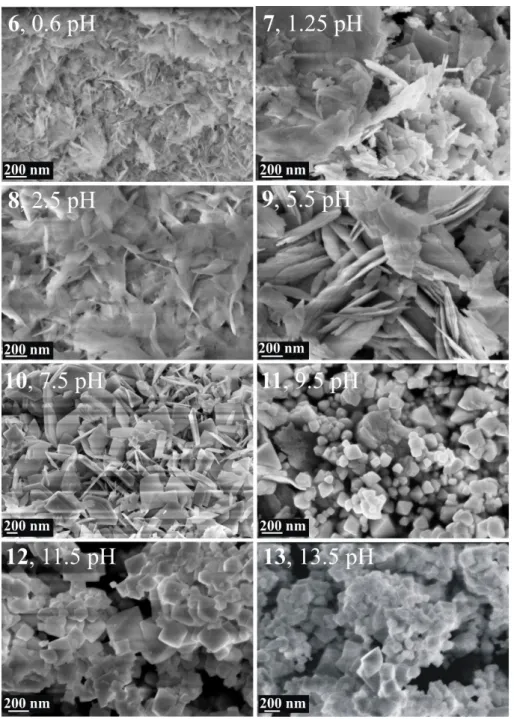
Significant changes were also observed in the obtained morphology of 6–13 (Figure 4). In the case of 6, 100–200 nm long fibers and other irregular shapes formed, while the morphology of 7 and 8 is composed of various sheet-like forms, together with irregular, curved figures of different sizes.
In 9, however, the Bi2WO6 phase appeared in the form of only sheets with 10–20 nm thickness. This morphology is similar to 3, where the Bi2WO6 phase was also obtained with a nanosheet morphology.
Here, in the case of 9, however, the appearance of sheets is not so uniform, and the sheets have mostly curved edges, not strictly angular.
Further increasing the pH, it was found that the sheet-like morphology gradually transformed into small cubic and octahedral shapes. In the case of 10, where the Bi3.84W0.16O6.24 phase also appears beside Bi2WO6, the morphology becomes a mixture of thin, only 10–50 nm and larger, even 100–300 nm thick sheets (10, Figure 4). As the ratio of crystalline Bi3.84W0.16O6.24 phase increases in 11–13, the crystalline appearance turns into a cube and octahedral-like morphology (Figure 4). In 11, these forms are uniform in size, between 100–200 nm, but in 12 and 13, where the ratio of the Bi3.84W0.16O6.24 phase is much stronger than Bi2WO6, larger figures, with 200–300 nm edges, can be observed as well.
It is known that at low pH values, the hydrolysis of Bi3+ is restrained because of the great amount of H+ ions, and thus the nucleation rate of Bi2WO6 is favored against crystal growth. This indicates the formation of many nanometer-sized Bi2WO6 nuclei whose sheet-like formation is derived from the intrinsic anisotropic layered structure. In the alkaline range, however, the facile hydrolysis of Bi3+
ions favors the crystal growth through precipitation with the also soluble WO42- anion, resulting not Figure 3.XRD patterns of the Bi2WO6samples prepared at 200◦C, 24 h using different pH values.
The distinct, sharp XRD peaks of the samples prepared in the alkaline range (10–13) indicate well-crystallized materials, in contrast with6–9,which were synthetized using acidic pH (Figure3).
Significant changes were also observed in the obtained morphology of6–13(Figure4). In the case of6, 100–200 nm long fibers and other irregular shapes formed, while the morphology of7and 8is composed of various sheet-like forms, together with irregular, curved figures of different sizes.
In9, however, the Bi2WO6phase appeared in the form of only sheets with 10–20 nm thickness. This morphology is similar to3, where the Bi2WO6phase was also obtained with a nanosheet morphology.
Here, in the case of9, however, the appearance of sheets is not so uniform, and the sheets have mostly curved edges, not strictly angular.
Further increasing the pH, it was found that the sheet-like morphology gradually transformed into small cubic and octahedral shapes. In the case of 10, where the Bi3.84W0.16O6.24 phase also appears beside Bi2WO6, the morphology becomes a mixture of thin, only 10–50 nm and larger, even 100–300 nm thick sheets (10, Figure4). As the ratio of crystalline Bi3.84W0.16O6.24 phase increases in11–13, the crystalline appearance turns into a cube and octahedral-like morphology (Figure4).
In11, these forms are uniform in size, between 100–200 nm, but in12and13, where the ratio of the Bi3.84W0.16O6.24phase is much stronger than Bi2WO6, larger figures, with 200–300 nm edges, can be observed as well.
It is known that at low pH values, the hydrolysis of Bi3+is restrained because of the great amount of H+ions, and thus the nucleation rate of Bi2WO6is favored against crystal growth. This indicates the formation of many nanometer-sized Bi2WO6nuclei whose sheet-like formation is derived from the intrinsic anisotropic layered structure. In the alkaline range, however, the facile hydrolysis of Bi3+ions
Materials2019,12, 1728 6 of 13
favors the crystal growth through precipitation with the also soluble WO42-anion, resulting not only in a new phase (Bi3.84W0.16O6.24), but in cubes and octahedral shapes as well (Figure4) [32,41,47,49,61–63].
Materials 2017, 10, x FOR PEER REVIEW 6 of 13
only in a new phase (Bi3.84W0.16O6.24), but in cubes and octahedral shapes as well (Figure 4) [32,41,47,49,61–63].
Figure 4. SEM images of Bi2WO6 samples synthetized at 200 °C, 24 h using different pH values.
3.3. Further Characterization of Samples Synthesized at Various Temperatures
Further investigations were carried out using the pure Bi2WO6 samples (1–3), which were prepared at 150, 170, and 200 °C, 24 h.
3.3.1. TEM, Specific Surface Area, Crystallite Size, and EDX
To further investigate the morphology of 1–3, TEM images were taken (Figure 5). In every image, highly crystallized Bi2WO6 can be seen, which is self-assembled by many strongly agglomerated nanosheets in good accordance with the SEM images.
Figure 4.SEM images of Bi2WO6samples synthetized at 200◦C, 24 h using different pH values.
3.3. Further Characterization of Samples Synthesized at Various Temperatures
Further investigations were carried out using the pure Bi2WO6samples (1–3), which were prepared at 150, 170, and 200◦C, 24 h.
3.3.1. TEM, Specific Surface Area, Crystallite Size, and EDX
To further investigate the morphology of1–3, TEM images were taken (Figure5). In every image, highly crystallized Bi2WO6 can be seen, which is self-assembled by many strongly agglomerated nanosheets in good accordance with the SEM images.
Materials2019,12, 1728 7 of 13
Materials 2017, 10, x FOR PEER REVIEW 7 of 13
Figure 5. TEM images of the Bi2WO6 synthetized at different temperatures.
A comparison of the surface area of the samples obtained at different temperatures revealed that the largest area, 35.8 m2/g, belonged to 1, that is, to the sample prepared at 150 °C. 2 and 3, prepared at 170 and 200 °C, respectively, had a smaller surface (26 and 21.9 m2/g) because of the larger crystallite size developing at higher temperatures. This effect is well-known in the literature and has been already reported many times, as well as in the case of other materials. The higher temperature strongly influences the crystal growth, providing sufficient energy for smaller grains to grow and form bigger crystallites, while the specific surface area reduces [27,48,64–66]. This phenomenon corresponds with the calculated crystallite size of the samples, which are 16, 19.7, and 35for the sample prepared at 150, 170, and 200 °C, respectively.
The EDX results (Table 2) show that only Bi, W, and O can be found in the samples with atomic percentages close to the expected values (EDX has ± 5%–10% relative error, which can be even higher in the case of elements with a lower atomic number).
Table 2. Crystallite size, specific surface area, and EDX results of 1–3.
1, 150 °C 2, 170 °C 3, 200 °C
SBET (m2/g) 35.8 26 21.9
Crystallite size (nm) 16.0 19.7 35.0
EDX (atom%)
Bi 25.3 26.8 28.3
W 14.9 13.2 17.1
O 59.8 61.0 60.3
A typical EDX spectrum can be seen in Figure 6. On the spectrum, only the signs of the main components appear (O, W, and Bi), indicating that no other elements referring to other phases or impurities are present.
Figure 6. A typical EDX spectrum of the Bi2WO6 samples prepared at 150, 170, and 200 °C, 24 h.
3.3.2. FT-IR, Raman, and UV-vis Spectroscopy Results
In the FT-IR spectra of 1–3, between 500 and 1000 cm-1, the characteristic peaks of W–O modes can be observed (Figure 7). The band at 820 cm-1 belongs to the stretching vibration of Bi–O, and the
Figure 5.TEM images of the Bi2WO6synthetized at different temperatures.
A comparison of the surface area of the samples obtained at different temperatures revealed that the largest area, 35.8 m2/g, belonged to1, that is, to the sample prepared at 150◦C.2and3, prepared at 170 and 200◦C, respectively, had a smaller surface (26 and 21.9 m2/g) because of the larger crystallite size developing at higher temperatures. This effect is well-known in the literature and has been already reported many times, as well as in the case of other materials. The higher temperature strongly influences the crystal growth, providing sufficient energy for smaller grains to grow and form bigger crystallites, while the specific surface area reduces [27,48,64–66]. This phenomenon corresponds with the calculated crystallite size of the samples, which are 16, 19.7, and 35for the sample prepared at 150, 170, and 200◦C, respectively.
The EDX results (Table2) show that only Bi, W, and O can be found in the samples with atomic percentages close to the expected values (EDX has±5%–10% relative error, which can be even higher in the case of elements with a lower atomic number).
Table 2.Crystallite size, specific surface area, and EDX results of1–3.
1, 150◦C 2, 170◦C 3, 200◦C
SBET(m2/g) 35.8 26 21.9
Crystallite size (nm) 16.0 19.7 35.0
EDX (atom%)
Bi 25.3 26.8 28.3
W 14.9 13.2 17.1
O 59.8 61.0 60.3
A typical EDX spectrum can be seen in Figure6. On the spectrum, only the signs of the main components appear (O, W, and Bi), indicating that no other elements referring to other phases or impurities are present.
Materials 2017, 10, x FOR PEER REVIEW 7 of 13
Figure 5. TEM images of the Bi2WO6 synthetized at different temperatures.
A comparison of the surface area of the samples obtained at different temperatures revealed that the largest area, 35.8 m2/g, belonged to 1, that is, to the sample prepared at 150 °C. 2 and 3, prepared at 170 and 200 °C, respectively, had a smaller surface (26 and 21.9 m2/g) because of the larger crystallite size developing at higher temperatures. This effect is well-known in the literature and has been already reported many times, as well as in the case of other materials. The higher temperature strongly influences the crystal growth, providing sufficient energy for smaller grains to grow and form bigger crystallites, while the specific surface area reduces [27,48,64–66]. This phenomenon corresponds with the calculated crystallite size of the samples, which are 16, 19.7, and 35for the sample prepared at 150, 170, and 200 °C, respectively.
The EDX results (Table 2) show that only Bi, W, and O can be found in the samples with atomic percentages close to the expected values (EDX has ± 5%–10% relative error, which can be even higher in the case of elements with a lower atomic number).
Table 2. Crystallite size, specific surface area, and EDX results of 1–3.
1, 150 °C 2, 170 °C 3, 200 °C
SBET (m2/g) 35.8 26 21.9
Crystallite size (nm) 16.0 19.7 35.0
EDX (atom%)
Bi 25.3 26.8 28.3
W 14.9 13.2 17.1
O 59.8 61.0 60.3
A typical EDX spectrum can be seen in Figure 6. On the spectrum, only the signs of the main components appear (O, W, and Bi), indicating that no other elements referring to other phases or impurities are present.
Figure 6. A typical EDX spectrum of the Bi2WO6 samples prepared at 150, 170, and 200 °C, 24 h.
3.3.2. FT-IR, Raman, and UV-vis Spectroscopy Results
In the FT-IR spectra of 1–3, between 500 and 1000 cm-1, the characteristic peaks of W–O modes can be observed (Figure 7). The band at 820 cm-1 belongs to the stretching vibration of Bi–O, and the
Figure 6.A typical EDX spectrum of the Bi2WO6samples prepared at 150, 170, and 200◦C, 24 h.
Materials2019,12, 1728 8 of 13
3.3.2. FT-IR, Raman, and UV-vis Spectroscopy Results
In the FT-IR spectra of1–3, between 500 and 1000 cm−1, the characteristic peaks of W–O modes can be observed (Figure7). The band at 820 cm−1belongs to the stretching vibration of Bi–O, and the others below 750 cm−1are assigned to the stretching and bridging stretching mode of W–O and W–O–W, respectively [25,28,50,54,67].
Materials 2017, 10, x FOR PEER REVIEW 8 of 13
others below 750 cm-1 are assigned to the stretching and bridging stretching mode of W–O and W–
O–W, respectively [25,28,50,54,67].
Figure 7. FT-IR spectra of the Bi2WO6 samples prepared at different temperatures.
Raman spectra show well distinct peaks revealing the Bi2WO6 structure (Figure 8). The double peak at 800 cm-1 belongs to the antisymmetric and symmetric Ag modes of terminal O–W–O vibration.
The band at 710 cm-1 can be ascribed to the antisymmetric bridging mode originated in the tungstate chain. The weak band appearing at 433 cm-1 is assigned to the antisymmetric mode of WO6 octahedral, while at 310 cm-1, the translational mode of the simultaneous move of Bi3+ and WO66- can be found. The band at 300 cm-1 corresponds to the mode of the WO2 terminal groups (Figure 1) [29,42,50,68,69].
Figure 8. Raman spectra of the Bi2WO6 samples synthetized at different temperatures.
The diffuse reflectance UV-vis spectra of 1–3 reveal a definite absorption edge at 480–490 nm in the case of all samples (Figure 9). 1–3 have visible light absorption ability as well, in good agreement with their light yellow color.
Figure 7.FT-IR spectra of the Bi2WO6samples prepared at different temperatures.
Raman spectra show well distinct peaks revealing the Bi2WO6structure (Figure8). The double peak at 800 cm−1belongs to the antisymmetric and symmetric Agmodes of terminal O–W–O vibration.
The band at 710 cm−1can be ascribed to the antisymmetric bridging mode originated in the tungstate chain. The weak band appearing at 433 cm−1is assigned to the antisymmetric mode of WO6octahedral, while at 310 cm−1, the translational mode of the simultaneous move of Bi3+and WO66−
can be found.
The band at 300 cm−1corresponds to the mode of the WO2terminal groups (Figure1) [29,42,50,68,69].
Materials 2017, 10, x FOR PEER REVIEW 8 of 13
others below 750 cm-1 are assigned to the stretching and bridging stretching mode of W–O and W–
O–W, respectively [25,28,50,54,67].
Figure 7. FT-IR spectra of the Bi2WO6 samples prepared at different temperatures.
Raman spectra show well distinct peaks revealing the Bi2WO6 structure (Figure 8). The double peak at 800 cm-1 belongs to the antisymmetric and symmetric Ag modes of terminal O–W–O vibration.
The band at 710 cm-1 can be ascribed to the antisymmetric bridging mode originated in the tungstate chain. The weak band appearing at 433 cm-1 is assigned to the antisymmetric mode of WO6 octahedral, while at 310 cm-1, the translational mode of the simultaneous move of Bi3+ and WO66- can be found. The band at 300 cm-1 corresponds to the mode of the WO2 terminal groups (Figure 1) [29,42,50,68,69].
Figure 8. Raman spectra of the Bi2WO6 samples synthetized at different temperatures.
The diffuse reflectance UV-vis spectra of 1–3 reveal a definite absorption edge at 480–490 nm in the case of all samples (Figure 9). 1–3 have visible light absorption ability as well, in good agreement with their light yellow color.
Figure 8.Raman spectra of the Bi2WO6samples synthetized at different temperatures.
Materials2019,12, 1728 9 of 13
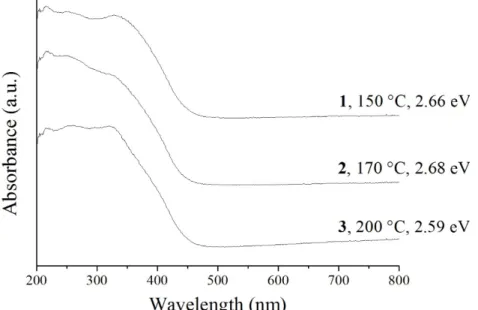
The diffuse reflectance UV-vis spectra of1–3reveal a definite absorption edge at 480–490 nm in the case of all samples (Figure9).1–3have visible light absorption ability as well, in good agreement with their light yellow color.
Materials 2017, 10, x FOR PEER REVIEW 9 of 13
Figure 9. UV-vis spectra and the calculated band gap of the Bi2WO6 samples made at different temperatures.
Their band gaps were also calculated using the equation αhυ = A (hυ − 𝐸 ) , where α, hυ, A, and Eg refer to molar absorption coefficient, photon energy, general constant, and band gap energy, respectively. N depends on the direct or indirect allowed or forbidden type of the electron transition of the material, and is 2 in the case of Bi2WO6, which is an indirect semiconductor. Plotting αhυ against hυ (Tauc-plot), then drawing a tangent line onto the linear range and extrapolating, the band gap energy can be determined. To approximate A, the Kubelka–Munk function was used. The calculated band gaps are 2.66 and 2.68 eV in the case of 1 and 2, respectively, but for 3, it is only 2.59 eV (Figure 9). These values are otherwise in good agreement with the values reported in the literature (2.59 and 2.81 eV) [28,31,33,34,70], and make the prepared Bi2WO6 samples promising candidates in the field of photocatalysis. They show a slight temperature-dependent tendency, as the smallest band gap belongs to 3, which was prepared at the highest temperature, and thus has the most ordered structure, while 1 and 2 are more similar to each other regarding the degree of crystallinity and atomic order, and thus have a similar band gap value.
4. Conclusion
In this report, we successfully investigated the effect of reaction temperature (150/170/200 °C), reaction time (6/12/24 h), and pH (0.3/0.6/1.25/2.5/5.5/7.5/9.5/11.5/13.5) on the obtained morphology and crystalline phases in the hydrothermal preparation of Bi2WO6. Our aim was to study the full pH range using very acidic (below pH 1) as well as very alkaline (above pH 13) ranges, because the effect of these has not been examined yet. Pure, crystalline Bi2WO6 formed independently of the used temperature and time at pH 0.3, but the crystallinity varied. It was enhanced as the time and temperature increased. The morphology was, however, a mixture of 10–20 nm thick sheets and fibers at 150 and 170 °C, 24 h, while it was consisted of uniform, angular nanosheets when the temperature was 200 °C and 24 h was used. When the time was decreased to 12 and 6 h, the obtained morphology contained sheets and other forms (discs, fibers) as well. Varying the pH resulted in significant changes both in the crystalline phases and in the morphology. In the acidic range (from 0.6 to 5.5), all samples were pure Bi2WO6. At 0.6 pH, the morphology emerged in irregular forms, while at 1.25 and 2.5 pH, it was a mixture of sheets and other irregular figures. When the pH was set to 5.5, however, Bi2WO6 was obtained in the form of nanosheets. Further increasing the pH, at values of 7.5/9.5/11.5 and 13.5, the samples contained Bi2WO6 and Bi3.84W0.16O6.24 phases, and the structure and morphology gradually transformed into cube- and octahedral-like forms of the new phase. The pure Bi2WO6
Figure 9. UV-vis spectra and the calculated band gap of the Bi2WO6 samples made at different temperatures.
Their band gaps were also calculated using the equationαhυ = A hυ−Eg
n
, whereα,hυ,A, andEgrefer to molar absorption coefficient, photon energy, general constant, and band gap energy, respectively.Ndepends on the direct or indirect allowed or forbidden type of the electron transition of the material, and is 2 in the case of Bi2WO6, which is an indirect semiconductor. Plottingαhυagainst hυ(Tauc-plot), then drawing a tangent line onto the linear range and extrapolating, the band gap energy can be determined. To approximateA, the Kubelka–Munk function was used. The calculated band gaps are 2.66 and 2.68 eV in the case of1and2, respectively, but for3, it is only 2.59 eV (Figure9).
These values are otherwise in good agreement with the values reported in the literature (2.59 and 2.81 eV) [28,31,33,34,70], and make the prepared Bi2WO6samples promising candidates in the field of photocatalysis. They show a slight temperature-dependent tendency, as the smallest band gap belongs to3, which was prepared at the highest temperature, and thus has the most ordered structure, while1 and2are more similar to each other regarding the degree of crystallinity and atomic order, and thus have a similar band gap value.
4. Conclusion
In this report, we successfully investigated the effect of reaction temperature (150/170/200◦C), reaction time (6/12/24 h), and pH (0.3/0.6/1.25/2.5/5.5/7.5/9.5/11.5/13.5) on the obtained morphology and crystalline phases in the hydrothermal preparation of Bi2WO6. Our aim was to study the full pH range using very acidic (below pH 1) as well as very alkaline (above pH 13) ranges, because the effect of these has not been examined yet. Pure, crystalline Bi2WO6formed independently of the used temperature and time at pH 0.3, but the crystallinity varied. It was enhanced as the time and temperature increased. The morphology was, however, a mixture of 10–20 nm thick sheets and fibers at 150 and 170◦C, 24 h, while it was consisted of uniform, angular nanosheets when the temperature was 200◦C and 24 h was used. When the time was decreased to 12 and 6 h, the obtained morphology contained sheets and other forms (discs, fibers) as well. Varying the pH resulted in significant changes both in the crystalline phases and in the morphology. In the acidic range (from 0.6 to 5.5), all samples were pure Bi2WO6. At 0.6 pH, the morphology emerged in irregular forms, while at 1.25 and 2.5 pH,
Materials2019,12, 1728 10 of 13
it was a mixture of sheets and other irregular figures. When the pH was set to 5.5, however, Bi2WO6
was obtained in the form of nanosheets. Further increasing the pH, at values of 7.5/9.5/11.5 and 13.5, the samples contained Bi2WO6and Bi3.84W0.16O6.24phases, and the structure and morphology gradually transformed into cube- and octahedral-like forms of the new phase. The pure Bi2WO6
samples prepared at 150/170/200◦C were studied in detail. EDX, TEM, as well as FT-IR, Raman, and UV-vis spectroscopies revealed their elemental composition, sheet-like structure, and optical properties, respectively. Their band gaps were calculated and it was found that they varied between 2.66 and 2.59 eV as the temperature increased. A comparison of the specific surface areas and crystallite sizes showed that the larger the area, the lower the temperature (35.8/26/21.6 m2/g belonging to samples prepared at 150/170/200◦C, respectively).
Author Contributions:Conceptualization, T.N.-K., I.M.S., and G.P.; methodology, T.N.-K. and I.M.S.; investigation, T.N.-K., G.S., I.E.L., T.I., and A.S.; writing—original draft preparation, T.N.-K.; writing, review and editing, K.H., K.L., I.M.S., and G.P.; supervision, I.M.S.
Funding:T. Nagyné-Kovács thanks for a József Varga Research Scholarship. I. M. Szilágyi thanks for a János Bolyai Research Fellowship of the Hungarian Academy of Sciences and for theÚNKP-18-4-BME-238 New National Excellence Program of the Ministry of Human Capacities, Hungary. GINOP-2.2.1-15-2017-00084, NRDI K 124212, and NRDI TNN_16 123631 grants are acknowledged. The work performed within project VEKOP-2.3.2-16-2017-00013 was supported by the European Union and the State of Hungary, co-financed by the European Regional Development Fund. The research reported in this paper was supported by the Higher Education Excellence Program of the Ministry of Human Capacities in the frame of Nanotechnology and Materials Science research area of Budapest University of Technology (BME FIKP-NAT).
Conflicts of Interest:The authors declare no conflict of interest.
References
1. Alfaro, S.O.; Cruz, A.M. Synthesis, characterization and visible-light photocatalytic properties of Bi2WO6 and Bi2W2O9obtained by co-precipitation method.Appl. Catal. A Gen.2010,383, 128–133. [CrossRef]
2. Zhang, Y.; Fan, R.; Zhang, Q.; Chen, Y.; Sharifi, O.; Leszczynska, D.; Zhang, R.; Dai, Q. Synthesis of CaWO4-biochar nanocomposites for organic dye removal.Mater. Res. Bull.2019,110, 169–173. [CrossRef]
3. He, H.Y.; Huang, J.F.; Cao, L.Y.; Wu, J.P. Photodegradation of methyl orange aqueous on MnWO4powder under different light resources and initial pH.Desalination2010,252, 66–70. [CrossRef]
4. Wang, Y.; Liping, L.; Li, G. Solvothermal synthesis, characterization and photocatalytic performance of Zn-rich ZnWO4nanocrystals.Appl. Surf. Sci.2017,393, 159–167. [CrossRef]
5. Barzgari, Z.; Askari, S.Z.; Ghazizadeh, A. Solar photocatalytic activity of chemical solution-prepared barium tungstate nanostructures.Mater. Sci. Semicond. Process.2015,33, 36–41. [CrossRef]
6. Zhou, Y.X.; Yao, H.B.; Zhang, Q.; Gong, J.Y.; Liu, S.J.; Yu, S.H. Hierarchical FeWO4microcrystals: Solvothermal synthesis and their photocatalytic and magnetic properties.Inorg. Chem.2009,48, 1082–1090. [CrossRef]
7. Deng, J.; Chang, L.; Wang, P.; Zhang, E.; Ma, J.; Wang, T. Preparation and magnetic properties of CoWO4 nanocrystals.Cryst. Res. Technol.2012,1007, 1004–1007. [CrossRef]
8. Lou, Z.; Cocivera, M. Cathodoluminescence of CaWO4and SrWO4thin films prepared by spray pyrolysis.
Mater. Res. Bull.2002,37, 1573–1582. [CrossRef]
9. Xu, W.; Hu, Y.; Zheng, L.; Zhang, Z.; Cao, W.; Liu, H.; Wu, X. Enhanced NIR-NIR luminescence from CaWO4: Nd3+/Yb3+phosphors by Li+codoping for thermometry and optical heating.J. Lumin.2019,208, 415–423.
[CrossRef]
10. Mikhailik, V.B.; Kraus, H.; Miller, G.; Mykhaylyk, M.S.; Wahl, D. Luminescence of CaWO4, CaMoO4, and ZnWO4scintillating crystals under different excitations.J. Appl. Phys.2005,97. [CrossRef]
11. Oaki, Y.; Imai, H. Room-temperature aqueous synthesis of highly luminescent BaWO4-polymer nanohybrids and their spontaneous conversion to hexagonal WO3nanosheets.Adv. Mater.2006,18, 1807–1811. [CrossRef]
12. Kaminskii, A.A.; Eichler, H.J.; Ueda, K.; Klassen, N.V.; Redkin, B.S.; Li, L.E.; Findeisen, J.; Jaque, D.;
García-Sole, J.; Fernández, J.; Balda, R. Properties of Nd3+-Doped and Undoped Tetragonal PbWO4, NaY(WO4)2, CaWO4, and Undoped Monoclinic ZnWO4and CdWO4as Laser-Active and Stimulated Raman Scattering-Active Crystals.Appl. Opt.1999,38, 4533. [CrossRef]
Materials2019,12, 1728 11 of 13
13. You, L.; Cao, Y.; Sun, Y.F.; Sun, P.; Zhang, T.; Du, Y.; Lu, G.Y. Humidity sensing properties of nanocrystalline ZnWO4with porous structures.Sens. Actuators B Chem.2012,161, 799–804. [CrossRef]
14. Zhang, L.; Lu, C.; Wang, Y.; Cheng, Y. Hydrothermal synthesis and characterization of MnWO4nanoplates and their ionic conductivity.Mater. Chem. Phys. 2007,103, 433–436. [CrossRef]
15. Sundaram, R.; Nagaraja, K.S. Electrical and humidity sensing properties of lead (II) tungstate – tungsten (VI) oxide and zinc (II) tungstate – tungsten (VI) oxide composites.Mater. Res. Bull.2004,39, 581–590. [CrossRef]
16. Kärkkänen, I.; Kodu, M.; Avarmaa, T.; Kozlova, J.; Matisen, L.; Mändar, H.; Saar, A.; Sammelselg, V.; Jaaniso, R.
Sensitivity of CoWO4thin films to CO.Procedia Eng.2010,5, 160–163. [CrossRef]
17. Gonzalez, C.M.; Du, X.; Dunford, J.L.; Post, M.L. Copper tungstate thin-films for nitric oxide sensing.Sens.
Actuators B Chem.2012,173, 169–176. [CrossRef]
18. Trung, D.D.; Cuong, N.D.; Trung, K.Q.; Nguyen, T.; van Toan, N.; Hung, C.M.; van Hieu, N. Controlled synthesis of manganese tungstate nanorods for highly selective NH3gas sensor.J. Alloy. Compd.2017,735, 787–794. [CrossRef]
19. Wang, W.; Hu, L.; Ge, J.; Hu, Z.; Sun, H.; Sun, H.; Zhang, H.; Zhu, H.; Jiao, S. In situ self-assembled FeWO4/graphene mesoporous composites for Li-ion and Na-ion batteries.Chem. Mater.2014,26, 3721–3730.
[CrossRef]
20. Wang, X.; Li, Y.; Liu, M.; Kong, L. Fabrication and electrochemical investigation of MWO4(M=Co, Ni) nanoparticles as high-performance anode materials for lithium-ion batteries.Ionics2017,4, 2–11. [CrossRef]
21. Gong, C.; Bai, Y.; Feng, J.; Tang, R.; Qi, Y.; Lun, N.; Fan, R. Enhanced Electrochemical Performance of FeWO4 by Coating Nitrogen-Doped Carbon.ACS Appl. Mater. Interfaces2013,5, 4209–4215. [CrossRef] [PubMed]
22. Farsi, H.; Barzgari, Z. Synthesis, characterization and electrochemical studies of nanostructured CaWO4as platinum support for oxygen reduction reaction.Mater. Res. Bull.2014,59, 261–266. [CrossRef]
23. Senthilkumar, B.; Selvan, R.K.; Vasylechko, L.; Minakshi, M. Synthesis, crystal structure and pseudocapacitor electrode properties ofγ-Bi2MoO6nanoplates.Solid State Sci.2014. [CrossRef]
24. Ramkumar, R.; Minakshi, M. Fabrication of ultrathin CoMoO4nanosheets modified with chitosan and their improved performance in energy storage device.Dalt. Trans.2015,44, 6158–6168. [CrossRef] [PubMed]
25. Zhang, G.; Lü, F.; Li, M.; Yang, J.; Zhang, X.; Huang, B. Synthesis of nanometer Bi2WO6synthesized by sol-gel method and its visible-light photocatalytic activity for degradation of 4BS.J. Phys. Chem. Solids2010, 71, 579–582. [CrossRef]
26. Wang, J.; Tang, L.; Zeng, G.; Zhou, Y.; Deng, Y.; Fan, C.; Gong, J.; Liu, Y. Effect of bismuth tungstate with different hierarchical architectures on photocatalytic degradation of norfloxacin under visible light.
Trans. Nonferrous Met. Soc. China (Engl. Ed.)2017,27, 1794–1803. [CrossRef]
27. Fu, H.; Zhang, L.; Yao, W.; Zhu, Y. Photocatalytic properties of nanosized Bi2WO6catalysts synthesized via a hydrothermal process.Appl. Catal. B Environ.2006,66, 100–110. [CrossRef]
28. Li, J.; Ni, G.; Han, Y.; Ma, Y. Synthesis of La doped Bi2WO6nanosheets with high visible light photocatalytic activity.J. Mater. Sci. Mater. Electron.2017,28, 10148–10157. [CrossRef]
29. Zhu, Y.; Wang, Y.; Ling, Q.; Zhu, Y. Enhancement of full-spectrum photocatalytic activity over BiPO4/Bi2WO6 composites.Appl. Catal. B Environ.2017,200, 222–229. [CrossRef]
30. Xu, X.; Shen, X.; Zhu, G.; Jing, L.; Liu, X.; Chen, K. Magnetically recoverable Bi2WO6-Fe3O4composite photocatalysts: Fabrication and photocatalytic activity.Chem. Eng. J.2012,200–202, 521–531. [CrossRef]
31. Huang, H.; Liu, K.; Chen, K.; Zhang, Y.; Zhang, Y.; Wang, S. Ce and F Comodification on the Crystal Structure and Enhanced Photocatalytic Activity of Bi2WO6Photocatalyst under Visible Light Irradiation. J. Phys.
Chem. C.2014,118, 14379–14387. [CrossRef]
32. Tian, Y.; Xu, W.; Fang, M.; Hua, G.; Zhang, L.; Li, N. Bismuth tungstate nano/microstructures: Controllable morphologies, growth mechanism and photocatalytic properties. J. Alloy. Compd. 2011, 509, 724–730.
[CrossRef]
33. Yu, J.; Xiong, J.; Cheng, B.; Yu, Y.; Wang, J. Hydrothermal preparation and visible-light photocatalytic activity of Bi2WO6powders.J. Solid State Chem.2005,178, 1968–1972. [CrossRef]
34. Zhang, L.; Man, Y.; Zhu, Y. Effects of Mo replacement on the structure and visible-light-induced photocatalytic performances of Bi2WO6photocatalyst.ACS Catal.2011,1, 841–848. [CrossRef]
35. Han, T.; Wang, X.; Ma, Y.; Shao, G.; Dong, X.; Yu, C. Mesoporous Bi2WO6sheets synthesized via a sol–gel freeze-drying method with excellent photocatalytic performance.J. Sol.-Gel. Sci. Technol.2017,82, 101–108.
[CrossRef]
Materials2019,12, 1728 12 of 13
36. Liu, Y.; Lv, H.; Hu, J.; Li, Z. Synthesis and characterization of Bi2WO6nanoplates using egg white as a biotemplate through sol-gel method.Mater. Lett.2015,139, 401–404. [CrossRef]
37. Xu, C.; Wei, X.; Ren, Z.; Wang, Y.; Xu, G.; Shen, G.; Han, G. Solvothermal preparation of Bi2WO6nanocrystals with improved visible light photocatalytic activity.Mater. Lett.2009,63, 2194–2197. [CrossRef]
38. Wu, L.; Bi, J.; Li, Z.; Wang, X.; Fu, X. Rapid preparation of Bi2WO6photocatalyst with nanosheet morphology via microwave-assisted solvothermal synthesis.Catal. Today2008,131, 15–20. [CrossRef]
39. Kaur, A.; Kansal, S.K. Bi2WO6nanocuboids: An efficient visible light active photocatalyst for the degradation of levofloxacin drug in aqueous phase.Chem. Eng. J.2016,302, 194–203. [CrossRef]
40. Wang, C.; Zhang, H.; Li, F.; Zhu, L. Degradation and mineralization of bisphenol a by mesoporous Bi2WO6 under simulated solar light irradiation.Environ. Sci. Technol.2010,44, 6843–6848. [CrossRef] [PubMed]
41. Li, Y.; Liu, J.; Huang, X. Synthesis and Visible-Light Photocatalytic Property of Bi2WO6 Hierarchical Octahedron-Like Structures.Nanoscale Res. Lett.2008,3, 365–371. [CrossRef]
42. Xiao, J.; Dong, W.; Song, C.; Yu, Y.; Zhang, L.; Li, C.; Yin, Y. Nitrogen oxide gas-sensing characteristics of hierarchical Bi2WO6microspheres prepared by a hydrothermal method.Mater. Sci. Semicond. Process. 2015, 40, 463–467. [CrossRef]
43. Nagyné-Kovács, T.; Pokol, G.; Gáber, F.; Nagy, D.; Igricz, T.; Lukács, I.E.; Fogarassy, Z.; Balázsi, K.; Szilágyi, I.M.
Preparation of iron tungstate (FeWO4) nanosheets by hydrothermal method. Mater. Res. Bull. 2017,95, 563–569. [CrossRef]
44. Huang, Y.; Ai, Z.; Ho, W.; Chen, M.; Lee, S. Ultrasonic spray pyrolysis synthesis of porous Bi2WO6 microspheres and their visible-light-induced photocatalytic removal of NO.J. Phys. Chem. C2010,114, 6342–6349. [CrossRef]
45. Zhou, L.; Wang, W.; Zhang, L. Ultrasonic-assisted synthesis of visible-light-induced Bi2WO6(M=W, Mo) photocatalysts.J. Mol. Catal. A Chem.2007,268, 195–200. [CrossRef]
46. Tang, J.; Zou, Z.; Ye, J. Photocatalytic decomposition of organic contaminants by Bi2WO6under visible light irradiation.Catal. Lett.2004,92, 53–56. [CrossRef]
47. Chen, S.; Tang, W.; Fu, X. The preparation and characterization of composite bismuth tungsten oxide with enhanced visible light.CrystEngComm2013,15, 7943–7950. [CrossRef]
48. Yan, Y.; Wu, Y.; Yan, Y.; Guan, W.; Shi, W. Inorganic-Salt-Assisted Morphological Evolution and Visible-Light- Driven Photocatalytic Performance of Bi2WO6Nanostructures. J. Phys. Chem. C2013,117, 20017–20028.
[CrossRef]
49. Yao, S.; Wei, J.; Huang, B.; Feng, S.; Zhang, X.; Qin, X.; Wang, P.; Wang, Z.; Zhang, Q.; Jing, X.; Zhan, J.
Morphology modulated growth of bismuth tungsten oxide nanocrystals. J. Solid State Chem. 2009,182, 236–239. [CrossRef]
50. Phuruangrat, A.; Dumrongrojthanath, P.; Ekthammathat, N.; Thongtem, S.; Thongtem, T. Hydrothermal Synthesis, Characterization, and Visible Light-Driven Photocatalytic Properties of Bi2WO6Nanoplates.
J. Nanomater.2014,2014, 1–7. [CrossRef]
51. Wan, J.; Du, X.; Wang, R.; Liu, E.; Jia, J.; Bai, X.; Hu, X.; Fan, J. Mesoporous nanoplate multi-directional assembled Bi2WO6 for high efficient photocatalytic oxidation of NO.Chemosphere 2018, 193, 737–744.
[CrossRef]
52. Li, Y.; Liu, J.; Huang, X.; Li, G. Hydrothermal Synthesis of Bi2WO6Uniform Hierarchical Microspheres.Cryst.
Growth Des.2007,7, 1350–1355. [CrossRef]
53. Chen, C.C.; Cheng, M.-C.; Chang, J.L.; Huang, S.-T.; Chen, J.Y.; Lee, W.L.W. Photodegradation of CV over nanocrystalline bismuth tungstate prepared by hydrothermal synthesis.J. Mol. Catal. A Chem.2012,361–362, 80–90. [CrossRef]
54. Chen, J.; Hua, X.; Mao, C.J.; Niu, H.; Song, J.M. Synthesis of monodisperse pancake-like Bi2WO6with prominent photocatalytic performances.Res. Chem. Intermed.2018,44, 2251–2259. [CrossRef]
55. Cui, Z.; Yang, H.; Wang, B.; Li, R.; Wang, X. Effect of Experimental Parameters on the Hydrothermal Synthesis of Bi2WO6Nanostructures.Nanoscale Res. Lett.2016,11, 190. [CrossRef]
56. Lv, H.; Liu, Y.; Guang, J.; Wang, J. Shape-selective synthesis of Bi2WO6hierarchical structures and their morphology-dependent photocatalytic activities.RSC Adv.2016,6, 80226–80233. [CrossRef]
57. Wang, F.E.I.; Yang, H.U.A.; Zhang, H.; Su, J.; Wang, X. Electrochemical Performance of Morphologically Different Bi2WO6 Nanostructures Synthesized via a Hydrothermal Route. J. Electron. Mater. 2017, 46, 182–187. [CrossRef]
Materials2019,12, 1728 13 of 13
58. Chunmei, G.A.O.; Zhiyu, W.; Zhongping, Y.U.; Bo, Y.E.; Bo, L.I.U.; Xianping, F.A.N.; Guodong, Q. Effect of pH Values on Photocatalytic Properties of Bi2WO6Synthesized by Hydrothermal Method.J. Wuhan Univ.
Technol. Mater. Sci. Ed.2009,24, 533–536. [CrossRef]
59. Kim, D.Y.; Kim, S.; Yeo, M.; Jung, I.; Kang, M. Synthesis of nanometer sized Bi2WO6s by a hydrothermal method and their conductivities.Korean J. Chem. Eng.2009,26, 261–264. [CrossRef]
60. Brunauer, S.; Emmett, P.H.; Teller, E. Adsorption of Gases in Multimolecular Layers.J. Am. Chem. Soc. 1938, 60, 309–319. [CrossRef]
61. Zhang, G.; Feng, Y.; Wu, Q.; Xu, Y.; Gao, D. Facile fabrication of flower-shaped Bi2WO6superstructures and visible-light-driven photocatalytic performance.Mater. Res. Bull.2012,47, 1919–1924. [CrossRef]
62. Chen, T.; Lu, H.; Zhang, J.; Gao, J.; Yin, F. Three-dimensionally Hierarchical Bi2WO6Architectures with Enhanced Photocatalytic Activity.Nano Br. Rep. Rev.2016,11, 1650135. [CrossRef]
63. Zhang, C.; Zhu, Y. Synthesis of Square Bi2WO6 Nanoplates as High-Activity Visible-Light-Driven Photocatalysts.Chem. Mater.2005,17, 3537–3545. [CrossRef]
64. Ku´snieruk, S.; Wojnarowicz, J.; Chodara, A.; Chudoba, T.; Gierlotka, S.; Lojkowski, W. Influence of hydrothermal synthesis parameters on the properties of hydroxyapatite nanoparticles.Beilstein J. Nanotechnol.
2016,7, 1586–1601. [CrossRef]
65. Hong, S.J.; Jun, H.; Borse, P.H.; Lee, J.S. Size effects of WO3nanocrystals for photooxidation of water in particulate suspension and photoelectrochemical film systems.Int. J. Hydrogen Energy2009,34, 3234–3242.
[CrossRef]
66. Ram, J.; Singh, R.G.; Gupta, R.; Kumar, V.; Singh, F.; Kumar, R. Effect of Annealing on the Surface Morphology, Optical and Structural Properties of Nanodimensional Tungsten Oxide Prepared by Coprecipitation Technique.
J. Electron. Mater.2019,48, 1174–1183. [CrossRef]
67. Zargazi, M.; Entezari, M.H. Sonochemical versus hydrothermal synthesis of bismuth tungstate nanostructures:
Photocatalytic, sonocatalytic and sonophotocatalytic activities.Ultrason. Sonochem.2019,51, 1–11. [CrossRef]
[PubMed]
68. Adhikari, R.; Trital, H.M.; Rajbhandari, A.; Won, J.; Lee, S.W. Microwave induced morphology evolution of bismuth tungstate photocatalyst: Evaulation of phocatalytic activity under visible light.J. Nanosci. Nanotechnol.
2015,15, 7249–7253. [CrossRef]
69. Ge, M.; Liu, L. Sunlight-induced photocatalytic performance of Bi2WO6hierarchical microspheres synthesized via a relatively green hydrothermal route.Mater. Sci. Semicond. Process.2014,25, 258–263. [CrossRef]
70. Yang, Z.; Huang, L.; Xie, Y.; Lin, Z.; Fan, Y.; Liu, D.; Chen, L.; Zhang, Z.; Wang, X. Controllable synthesis of Bi2WO6nanoplate self-assembled hierarchical erythrocyte microspheres via a one-pot hydrothermal reaction with enhanced visible light photocatalytic activity.Appl. Surf. Sci.2017,403, 326–334. [CrossRef]
©2019 by the authors. Licensee MDPI, Basel, Switzerland. This article is an open access article distributed under the terms and conditions of the Creative Commons Attribution (CC BY) license (http://creativecommons.org/licenses/by/4.0/).