Research Article
Detailed Spectroscopic and Structural Analysis of TiO 2 /WO 3 Composite Semiconductors
Biborka Boga,
1Istv ´an Sz´ekely,
2,3Zsolt Pap,
2,3,4Lucian Baia ,
2,3and Monica Baia
2,31Faculty of Chemistry and Chemical Engineering, Babes¸-Bolyai University, Arany J´anos 11, Cluj-Napoca 400028, Romania
2Nanostructured Materials and Bio-Nano-Interfaces Center, Institute for Interdisciplinary Research on Bio-Nano-Sciences, Treboniu Laurian 42, Cluj-Napoca 400271, Romania
3Faculty of Physics, Babes¸-Bolyai University, Mihail Kog˘alniceanu 1, Cluj-Napoca 400084, Romania
4Institute of Environmental Science and Technology, Tisza Lajos krt. 103, Szeged 6720, Hungary
Correspondence should be addressed to Lucian Baia; lucian.baia@phys.ubbcluj.ro Received 15 March 2018; Accepted 4 September 2018; Published 2 October 2018
Academic Editor: Vincenza Crupi
Copyright © 2018 Biborka Boga et al. This is an open access article distributed under the Creative Commons Attribution License, which permits unrestricted use, distribution, and reproduction in any medium, provided the original work is properly cited.
WO3-TiO2composite materials were obtained using commercial titania (Evonik Aeroxide P25) and hydrothermally crystallized WO3. Different ratios of TiO2/WO3were investigated, starting at 1 wt.% of WO3to 50 wt.%. The morphology of WO3was of the star-like type, and its structure is basically composed of monoclinic crystalline phase. All spectroscopic characteristics of the composites and their derived data (band-gap energy value, light absorption threshold, and IR specific bands) directly varied with the increase of the WO3content. However, the oxalic acid photodegradation achieved under UV light reached the highest yield for 24 wt.% WO3content, a result that was attributed to the charge separation efficiency and the surface hydrophilicity. The latter mentioned reason points out the crucial importance of the surface quality of the investigated structure in photocatalytic tests.
1. Introduction
The study of semiconductors remained in the last years a systematically investigated research topic. The imple- mentation of nanomaterials in the industry had a major role in the blooming research of nanomaterials. One of these nanomaterials is tungsten trioxide (WO3), a transition metal oxide with large applicability spectra that is commonly used in paints as pigment [1], in solar cells for electricity pro- duction [2, 3], and in coatings for heat production from absorbing solar energy [4], such as humidity, moisture, and gas sensors [5–7]. This oxide is also an important component in “smart windows” due to its electrochromic properties [8].
Moreover, WO3 is used as a catalytic and photocatalytic purifier for air and water [9, 10].
WO3 nanomaterials (nano- or microcrystals) can be synthesized via various methods, such as hydrothermal crystallization [11], solvothermal crystallization [12], chemical vapor deposition [13], atomic layer deposition [14], physical vapor deposition [15], sol-gel synthesis [16], and laser pyrolysis [17]. There is an extensive list of possibilities
towards WO3production, but the most widely used tech- nique is the hydrothermal crystallization because this method is relatively simple, and it is not expensive and time- consuming [18–21].
Tungsten trioxide has an interesting peculiarity; in certain cases, it can act as a charge separator [22]. Due to this feature, it is a viable component for binary composite systems, in which another metal oxide is used as an electron donor, generally TiO2 [23] or ZnO [24], but NiO [25] was also used. The final goal of these composite systems is either to apply them as a sensor or as a photocatalyst, or even both simultaneously. Photocatalytic efficiency of WO3 semi- conductor can be enhanced if noble metals are added, WO3/Au, WO3/Ag, or WO3/Pt composite systems being related to show an improved photocatalytic efficiency to- wards the removal of organic pollutants in comparison with commercial TiO2 (Evonik Aeroxide P25) [26–28]. The photocatalytic activity of ternary composites based on WO3, commercial TiO2, and noble metals (WO3/TiO2/noble metals) was also intensively studied [29–31]. The most commonly used methods for the preparation of WO3/P25
Volume 2018, Article ID 6260458, 7 pages https://doi.org/10.1155/2018/6260458
composites are the mechanical mixing or the adjustment of the semiconductors’ surface charge, and in both cases, the composites photocatalytic efficiency was improved as compared to that exhibited by P25 [32, 33].
In this study, tungsten trioxide microcrystals were synthesized via hydrothermal crystallization, and their spectroscopic and structural features were investigated.
Various weight percentage composites based on the syn- thesized WO3and commercial TiO2(Evonik Aeroxide P25) were prepared by mechanical mixing method, and the photocatalytic activity of these binary composite systems was assessed.
2. Experimental
2.1. Chemicals. The chemicals employed for the synthesis of WO3microcrystals were ammonium metatungstate hydrate ((NH4)6H2W12O40·xH2O, Sigma-Aldrich, 99.99%) and hydrochloric acid (HCl, NORDIC 37%, 12 M). The photo- catalytic activity was evaluated in the aqueous solution (3 mM) of oxalic acid-OA (HO2C-CO2H·2H2O, Sigma- Aldrich, 98%). Commercial TiO2 (Evonik Aeroxide P25) was used for the WO3/TiO2 composites preparation. All chemicals were used as received without further modifica- tion or purification.
2.2. Synthesis of Star-Like WO3 Microcrystals. 1.23 g of ammonium metatungstate hydrate (AMT) was dissolved in 20 mL of water under constant stirring. 0.84 mL (12 M) hydrochloric acid (HCl) was added to the solution which was stirred for 15 minutes at room temperature. A yellow suspension was obtained after the hydrothermal crystalli- zation, which was carried out at 180°C for 4 hours. After the autoclave cooled down at room temperature, the product was centrifuged (3×15 minutes, 1600 rpm) and washed with deionized water in order to remove the impurities remained in the product. The product was dried at 70°C for 6 hours and annealed at 500°C for 30 minutes (heating rate 5°C·min−1) [34]. The WO3-AMT abbreviation was further used to identify the WO3 crystals synthesized from ammonium metatungstate hydrate.
2.3. The Preparation of TiO2/WO3 Composites. The TiO2/WO3composites were obtained via mechanical mixing (3×5 minutes), by using the physical mixing method. 50–50, 67–33, 76–24, 90–10, and 99–1 wt.% TiO2/WO3composites were prepared and investigated. According to our previous work [29], no structural or morphological changes were observed for the two components, when mixing them by using the above-described approach.
2.4. Characterization Methods. The assessment of the crys- talline structure of the composite components was carried out by the means of X-Ray Diffraction (XRD) measurements. The XRD diffractograms were recorded on a Shimadzu 6000 diffractometer (Shimadzu Corporation, Kyoto, Japan), by using Cu-Kα irradiation, (λ�1.5406 ˚A). The crystalline
phases of the semiconductors were evaluated and the crys- tallites’ average size was calculated by using the Scherrer equation [35], whereas the anatase/rutile ratios in P25 were evaluated by the well-known Banfield approach [36].
Diffuse reflectance spectroscopy (DRS) measurements were performed by using the JASCO-V650 spectropho- tometer (λ�250 – 800 nm) equipped with ILV-724 inte- gration sphere. The band-gap energy of the composites system was determined using the following equation [37–39]:
(E) �h·c
λ , (1)
where (E) is the band-gap energy, h is Plank constant, c is the speed of light�3.0×10⁸m·sec−1, andλis the cut-off wavelength.
A JASCO 4100 (Jasco, Tokyo, Japan) spectrometer was used to record the IR spectra of the composites, at room temperature, in the spectral range of 400–4000 cm−1, with a spectral resolution of 4 cm−1. The samples were prepared in the form of KBr pellets.
The SEM micrographs were recorded by using an FEI Quanta 3D FEG scanning electron microscope operating at an accelerating voltage of 25 kV. The WO3 nanomaterials were covered with Au to amplify the secondary electron signal, while the morphological peculiarities of the semi- conductor were uncovered.
The investigation of photocatalytic performance was carried out in the presence of 2×60 W fluorescence UV lamps withλ≈365 nm emission maximum, under vigorous stirring (Csuspension�1 g·L−1; Vsuspension�75 mL; Coxalic acid�3 mM).
The photocatalytic degradation was followed for 3 hours using high-performance liquid chromatography (HPLC). The measurements were carried out by using Merck-Hitachi type D-7000 chromatograph equipped with an L-4250 UV-Vis detector. The volume of the loop was 20μL and the chro- matography column was installed with Grom Resin ZH-type load. The eluent was 0.06% H2SO4aqueous solution, and the applied flow rate was 0.8 mL·min−1. The key parameters in- vestigated here were the conversion (X) and the reaction rate.
3. Results and Discussion
3.1. Crystalline Structure and Particle Size of the Semiconductors. The first step in the investigation series was to check the quality of the composite components. From the XRD patterns (Figure 1), the crystalline phase and the mean primary particle size of the synthesized semiconductors were established. In the case of WO3, only the monoclinic crystalline phase was detected, as it can be seen from the diffractogram. However, based on our previous work [33], one can infer that this synthesis procedure gives rise to hierarchical structures made up from fine micrometric needle crystals (30–50 nm wide and 3-4µm long) that form a star-like shaped structure (therefore the Scherrer equation was not used). The particle size of the WO3stars was between 3 and 4µm (as described in Section 3.3). Regarding the commercial TiO2, both anatase and rutile crystalline phases were observed, the ratio between anatase and rutile was
estimated (89 : 11), and the primary calculated particle size (25–40 nm) was very close to the values reported in the literature.
3.2. Optical Properties of the Prepared Composite System.
As the composite structure contains both oxides, it was crucial to investigate the optical properties of these materials (Figure 2). The band-gap energy values were determined by using the light absorption threshold method, as mentioned in Section 2.4. In the case of the WO3-AMT semiconductor, the light absorption threshold was found to be around 550 nm and the calculated band-gap energy was of≈2.25 eV, but it should be kept in mind that the band-gap energy value of the commercial TiO2 is ≈3.2 eV [33]. Concerning the composites, the light absorption thresholds and the band-gap energy values were as follows: 394 nm, ≈3.14 eV (99-1 wt.% P25-WO3); 414 nm, ≈2.99 eV (90-10 wt.% P25- WO3); 449 nm, ≈2.76 eV (76-24 wt.% P25-WO3); 447 nm,
≈2.77 eV (67-33 wt.% P25-WO3); and 451 nm,≈2.74 eV (50- 50 wt.% P25-WO3). The lowest band-gap energy was found for the 50-50 wt.% P25-WO3composite. One observes that the WO3 amount has a significant effect on the band-gap energy value, and a very interesting fact is that even 1% of monoclinic tungsten trioxide can influence it, by slightly reducing this value by 0.06 eV. By adding 10% WO3to the composite composition, the band-gap energy was found to further decrease by 0.21 eV. By increasing the amount of WO3to 24%, the band-gap energy was lowered by 0.44eV.
According to these results, the 99-1% wt.% P25-WO3 and 90-10% wt.% P25-WO3 composites should act as photo- catalysts under UV light irradiation, while the 76-24% wt.%
P25-WO3, 67–33% wt.% P25-WO3, and 50-50% wt.% P25-
WO3 composites may have photocatalytic potential under visible light irradiation.
3.3. Morphological Features of the Synthesized Semiconductor.
SEM measurements revealed that the morphology of the WO3 (WO3-AMT) microcrystals synthesized from ammonium metatungstate hydrate was of star-like type (Figure 3). The diameter of the stars was between 3 and 4µm, each star being constructed from microfibers of 3–4µm length. More im- portantly, it was found that all the microstars showed the same structure and morphology (i.e., high monodispersity), which can reinforce all the conclusions derived from the study.
3.4. FT-IR Characterization of the Prepared Composites System. By analyzing the IR spectra (Figure 4) of the obtained composites, the specific signals of TiO2were detected without any special changing trends, excepting the alteration of some signals proportionally with the composite components’ ratio.
The main spectral feature associated with titania was the large band between 400 and 700 cm−1, which can be attributed to the stretching vibrations of Ti-O-Ti and Ti-O bonds. In the case of WO3, several specific spectral characteristics were observed, such as the ones between 600 and 1000 cm−1(the most intense one being located at 931 cm−1), which were assigned to different W-O-W stretching modes. The small but distinct band at 1035 cm−1 was given by the stretching vi- bration of the W�O bonds [40]. These signals involving tungsten bond vibrations were also dependent on the WO3 concentration. The band at 1390 cm−1was interestingly found to be given by NH4+ions [41]. At the first view, this is rather surprising; but actually, it can be considered an expected appearance having in view that WO3was obtained by using
Reflectance (%)
800
300 400 500 600 700
100 80 60 40 20
0
λ (nm)
3.6 3.2 2.8 2.4 2.0
B.e. (eV)
100
0 20 40
WO3 content (%)60 80
P2599-1 P25-WO3 (AMT) 90-10 P25-WO3 (AMT) 76-24 P25-WO3 (AMT)
67-33 P25-WO3 (AMT) 50-50 P25-WO3 (AMT) WO3 (AMT)
Figure 2: The reflectance spectra of the prepared WO3/TiO2
composites system and the band-gap energy dependence on the WO3content (inset figure).
Intensity (a.u.)
40
20 25 30
2θ (degree)
35 Evonik aeroxide P25 WO3-AMT
Monoclinic WO3 Anatase TiO2 Rutile TiO2
Figure1: XRD patterns of monoclinic WO3and commercial TiO2, the two components of the obtained composites.
5 μm
1 μm 500 nm
2 μm
Figure3: SEM micrographs of the WO3-AMT semiconductors, showing the star-like shape and a fine hierarchical structure.
900 1000 1100 1500 2000 2500 3000 3500
800 4000
3427
1035 1630
Absorbance
Wavenumber (cm–1) 99-1 P25-WO3 (AMT)
90-10 P25-WO3 (AMT) 76-24 P25-WO3 (AMT)
67-33 P25-WO3 (AMT) 50-50 P25-WO3 (AMT) 931
1390
Figure4: Infrared spectra of the prepared WO3/TiO2composite system.
ammonium metatungstate. The only bands that differently changed self-dependent on the WO3 content were those directly related to the surface hydrophilicity, namely, those at 1630 and 3427 cm−1 assigned to OH vibrations. These bands exhibit a relatively high intensity for the samples with≥24 wt.% WO3and a slow decrease of it for smaller WO3 content. This result points out the high water affinity of 90- 10 wt.% P25-WO3 and 76-24 wt.% P25-WO3, which could have on impact on the photoactivity of these materials.
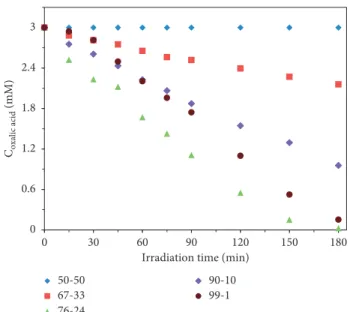
3.5. Photocatalytic Activity. The evaluation of the photo- catalytic performance was carried out by analyzing the oxalic acid degradation curves, which provide qualitative and quantitative information (Figure 5). The photocatalytic performance was quantitatively described by using the conversion values (X).
No photocatalytic activity was observed when bare WO3
and 50-50 wt.% TiO2/WO3 were used as photocatalysts in 3 mM oxalic acid solution. This photocatalytic inefficiency of bare WO3 could be due to the WO3 particles dimension, which is relatively high (3–4µm). In the case of 50-50 wt.%
TiO2/WO3 composite, the reason could be the screening effect of the WO3crystals on the TiO2particles so that the system had a deficiency being activated under UV light irradiation. In this case, the generation of charge carriers was decreased, and consequently, the photocatalytic activity was low in the composites with high WO3content. Only 28% of oxalic acid was removed using the 67-33 wt.% TiO2/WO3
composite system in contrast to 76-24 wt.% TiO2/WO3
system, where 99% conversion was achieved. 68% conver- sion was obtained in the case of 90-10 wt.% TiO2/WO3
composites and 95% conversion rate was observed for the 99-1 wt.% TiO2/WO3 composites. The reference catalyst (commercial TiO2) degraded 73.3 wt.% of oxalic acid.
The most efficient composite for oxalic acid degradation was the 76-24 wt.% TiO2/WO3 system because the re- combination process was inhibited successfully so that the separation of the charge carriers was the most efficient in the case of this sample. The first five points were taken into consideration for the calculation of the initial reaction rates.
The concentration changes of oxalic acid (at 0, 15, 30, 45, and 60 min) were plotted versus time to determine the initial reaction rate (ri) values. The linearization of these two pa- rameters and its slope gave the initial reaction rate values.
The initial reaction rate of the bare WO3and of 50-50 wt.%
TiO2-WO3composites were null because these systems were not photoactive. In the other cases, the reaction rate was 5.80 mM·s−1·10−3 (67-33%), 22.10 mM·s−1·10−3 (76-24%), 12.90 mM·s−1·10−3 (90-10%), 11.40 mM·s−1·10−3 (99-1%), and 12.7 mM·s−1·10−3(in the case of commercial TiO2). The conversion, initial reaction rate, and band-gap energy values are summarized in Table 1.
All the activity-related parameters clearly show that it must be a specific parameter responsible for the high photoactivity. The band-gap energy values of the composites can be eliminated as the main reason because it is a pa- rameter that varied concomitantly with the WO3content. As no structural and morphological changes occurred during
the composite preparation, other approaches should be exploited. Firstly, an analog case can be involved, in which a similar phenomenon was explained [29]. As the amount of WO3 increases, so does the charge separation efficiency in the composites. However, after a specific concentration of WO3, this was detrimental, because the WO3 itself is not photoactive. This means that increasing too much the ratio of a charge separator (without self-activity), a lowering of the overall photoactivity occurs. However, this approach may be not sufficient alone. The intensity of the IR bands at 1630 cm−1and 3427 cm−1 showed nearly the same trend as the photoactivity. This means that the photocatalytic deg- radation is in direct relationship with the hydrophilicity of the photocatalyst (a fact well-known for TiO2 [42]), which was confirmed here for the first time in case of TiO2-WO3
composites.
0 0.6 1.2 1.8 2.4 3
0 30 60 90 120 150 180
Coxalic acid (mM)
Irradiation time (min) 50-50
67-33 76-24
90-10 99-1
Figure5: Photodegradation of 3 mM oxalic acid using under UV light irradiation in the presence of 50-50, 67-33, 76-24, 90-10, and 99-1 wt.% TiO2/WO3composites.
Table1: Summary of the photocatalytic properties for the various composite system and reference catalysts.
Samples
X—conversion (%) (after
3 hours)
ri
(mM·second−1)·
10−3
Band-gap energy
value (eV)
WO3(AMT) 0.0 0.0 2.25
P25 73.3 12.7 3.20
50% P25-50%
WO3(AMT) 0.0 0.0 2.74
67% P25-33%
WO3(AMT) 28.0 05.8 2.77
76% P25-24%
WO3(AMT) 99.0 22.1 2.76
90% P25-10%
WO3(AMT) 68.0 12.9 2.99
99% P25-1% WO3
(AMT) 95.0 11.4 3.14
4. Conclusions
In the herein presented study, WO3-TiO2composites with different TiO2/WO3ratios (1 wt.% of WO3to 50 wt.%) were obtained by using commercial titania (Evonik Aeroxide P25) and hydrothermally crystallized WO3. The morphology of the synthesized hierarchical WO3semiconductors was star- like shaped with a diameter between 3 and 4µm, and WO3’s determined crystal phase was monoclinic. The present study proves that WO3microcrystals of relatively large dimension, without photoactivity, can improve the photocatalytic effi- ciency of the commercial TiO2, acting as a charge separator.
The band-gap energy values of the composites were found to be dependent on the WO3content as well, but no correlation was established with the photoactivity.
The 76-24 wt.% TiO2/WO3composite system has shown the highest photocatalytic activity, reaching a conversion rate of 99%. Also, this sample and the one with 10 wt.% of WO3
exhibited the most intense water affinity as revealed by the IR bands assigned to water vibrations, showing a clear corre- lation between these structural entities and photoactivity.
The obtained results from this study also suggest that these composites system could be used as efficient photo- catalysts for other pollutants removal (methyl orange and salicylic acid), gas sensors, and sensors for detection of organic pollutants containing the carboxylic functional group or could be even used for ternary WO3/TiO2/noble metal composites.
Data Availability
All the data shown throughout the five figures and one table used to support the findings of this study are included within the article.
Conflicts of Interest
The mentioned received funding did not lead to any conflicts of interest regarding the publication of this manuscript.
Furthermore, the authors do not have any other conflicts of interest, concerning the present work.
Authors’ Contributions
Biborka Boga and Istv´an Sz´ekely contributed equally to this work.
Acknowledgments
Biborka Boga would like to thank the Hungarian Ministry of Economic and Foreign Affairs for the scholarship “M´arton Aron” Programme for Gifted Youngsters. Istv´an Sz´ekely´ acknowledges the funding provided by the Collegium Tal- entum scholarship supported by the Sapientia Hungariae Foundation. Biborka Boga, Istv´an Sz´ekely, and Zsolt Pap would like to express their gratitude towards the “RING 2017,” EFOP-3.6.2-16-2017-00010 project, funded by the European Union and the Government of Hungary. In addition, the authors would like to thank Dr. Kl´ara Magyari
for recording the IR spectra and Zsejke-R´eka T´oth for the photocatalytic tests.
References
[1] P. Patnaik,Handbook of Inorganic Chemicals, McGraw-Hill, New York, NY, USA, 2003.
[2] M. G´omez, J. Lu, E. Olsson, A. Hagfeldt, and C. Granqvist,
“High efficiency dye-sensitized nanocrystalline solar cells based on sputter deposited Ti oxide films,” Solar Energy Materials and Solar Cells, vol. 64, no. 1, pp. 385–392, 2000.
[3] T. Lindgren, J. M. Mwabora, E. Avendano et al., “Photo- electrochemical and optical properties of nitrogen doped ti- tanium dioxide films prepared by reactive DC magnetron sputtering,”Journal of Physical Chemistry B, vol. 107, no. 24, pp. 5709–5716, 2003.
[4] P. C. Lans˚aker, P. Petersson, G. A. Niklasson, and C. G. Granqvist, “Thin sputter deposited gold films on In2O3: Sn, SnO2:In, TiO2and glass: optical, electrical and structural effects,” Solar Energy Materials and Solar Cells, vol. 117, pp. 462–470, 2013.
[5] A. Tripathi, V. Tripathi, N. K. Pandey, and K. Tiwari, “Re- sistive type moisture sensor based on WO3nanomaterial,”
Sensors and Transducers, vol. 143, pp. 152–161, 2012.
[6] J. L. Solis, A. Hoel, L. B. Kish, C. G. Granqvist, S. Saukko, and V. Lantto, “Gas-sensing properties of nanocrystalline WO3 films made by advanced reactive gas deposition,”Journal of the American Ceramic Society, vol. 84, no. 7, pp. 1504–1508, 2001.
[7] K. Galatsis, Y. X. Li, W. Wlodarski et al., “Comparison of single and binary oxide MoO3, TiO2and WO3sol-gel gas sensors,”Sensors and Actuators B: Chemical, vol. 83, no. 1–3, pp. 276–280, 2002.
[8] E. Lassner and W. Schubert,Tungsten: properties, chemistry, technology of the elements, alloys, and chemical compounds, Springer, Berlin, Germany, 1999.
[9] A. Amoozadeh and S. Rahmani, “Nano-WO3-supported sulfonic acid: New, efficient and high reusable heteroge- neous nano catalyst,” Journal of Molecular Catalysis A:
Chemical, vol. 396, pp. 96–107, 2015.
[10] K. Sayama, H. Hayashi, T. Arai, M. Yanagida, T. Gunji, and H. Sugihara, “Highly active WO3 semiconductor photo- catalyst prepared from amorphous peroxo-tungstic acid for the degradation of various organic compounds,” Applied Catalysis B: Environmental, vol. 94, no. 1-2, pp. 150–157, 2010.
[11] S. Cao, C. Zhao, T. Han, and L. Peng, “Hydrothermal syn- thesis, characterization and gas sensing properties of the WO3 nanofibers,”Materials Letters, vol. 169, pp. 17–20, 2016.
[12] Z. Wang, M. Hu, and Y. Qin, “Solvothermal synthesis of WO3
nanocrystals with nanosheet and nanorod morphologies and the gas-sensing properties,” Materials Letters, vol. 171, pp. 146–149, 2016.
[13] N. Shankar, M. F. Yu, S. P. Vanka, and N. G. Glumac,
“Synthesis of tungsten oxide (WO3) nanorods using carbon nanotubes as templates by hot filament chemical vapor de- position,”Materials Letters, vol. 60, no. 6, pp. 771–774, 2006.
[14] I. M. Szil´agyi, E. Santala, M. Heikkil¨a et al., “Photocatalytic properties of WO3/TiO2 core/shell nanofibers prepared by electrospinning and atomic layer deposition,”Chemical Vapor Deposition, vol. 19, no. 4–6, pp. 149–155, 2013.
[15] Y. B. Li, Y. Bando, D. Golberg, and K. Kurashima, “WO3 nanorods/nanobelts synthesized via physical vapor deposi- tion process,” Chemical Physics Letters, vol. 367, no. 1-2, pp. 214–218, 2003.
[16] T. Yang, Y. Zhang, and C. Li, “Large scale production of spherical WO3powder with ultrasonic spray pyrolysis assisted by sol–gel method for hydrogen detection,” Ceramics In- ternational, vol. 40, no. 1, pp. 1765–1769, 2014.
[17] M. Govender, L. Shikwambana, B. W. Mwakikunga, E. Sideras-Haddad, R. M. Erasmus, and A. Forbes, “Esopen access formation of tungsten oxide nanostructures by laser pyrolysis: Stars, fibers, and spheres,” Nanoscale Research Letters, vol. 6, no. 1, p. 166, 2011.
[18] M. Ahmadi, R. Younesi, and M. J. F. Guinel, “Synthesis of tungsten oxide nanoparticles using a hydrothermal method at ambient pressure,” Journal of Materials Research, vol. 29, no. 13, pp. 1424–1430, 2014.
[19] S. Bai, K. Zhang, R. Luo, D. Li, A. Chen, and C.C. Liu,
“Low-temperature hydrothermal synthesis of WO3nanorods and their sensing properties for NO2,” Journal of Materials Chemistry, vol. 22, no. 25, p. 12643, 2012.
[20] D. J. Ham, A. Phuruangrat, S. Thongtem, and J. S. Lee,
“Hydrothermal synthesis of monoclinic WO3 nanoplates and nanorods used as an electrocatalyst for hydrogen evolution reactions from water,”Chemical Engineering Journal, vol. 165, no. 1, pp. 365–369, 2010.
[21] S. S. Shendage, V. L. Patil, S. A. Vanalakar et al., “Sensitive and selective {NO2} gas sensor based on {WO3} nanoplates,”
Sensors and Actuators B: Chemica, vol. 240, pp. 426–433, 2017.
[22] K. Tennakone, O. A. Ileperuma, J. M. S. Bandara, and W. C. B. Kiridena, “TiO2and WO3semiconductor particles in contact: photochemical reduction of WO3 to the non- stoichiometric blue form,”Semiconductor Science and Tech- nology, vol. 7, no. 3, pp. 423-424, 1992.
[23] B. Tryba, M. Piszcz, and A. W. Morawski, “Photocatalytic Activity of TiO2/WO3Composites,”International Journal of Photoenergy, vol. 2009, Article ID 297319, 7 pages, 2009.
[24] J. Xie, Z. Zhou, Y. Lian et al., “Simple preparation of WO3- ZnO composites with UV-Vis photocatalytic activity and energy storage ability,”Ceramics International, vol. 40, no. 8, pp. 12519–12524, 2014.
[25] M. Bao, Y. Chen, F. Li et al., “Plate-like p–n heterogeneous NiO/WO3 nanocomposites for high-performance room temperature NO2sensors,”Nanoscale, vol. 6, no. 8, p. 4063, 2014.
[26] D. P. Depuccio, P. Botella, B. O’Rourke, and C. C. Landry,
“Degradation of methylene blue using porous WO3, SiO2- WO3, and their Au-loaded analogs: Adsorption and photo- catalytic studies,”ACS Applied Materials and Interfaces, vol. 7, no. 3, pp. 1987–1996, 2015.
[27] W. Zhu, J. Liu, S. Yu, Y. Zhou, and X. Yan, “Ag loaded WO3 nanoplates for efficient photocatalytic degradation of sulfa- nilamide and their bactericidal effect under visible light irradiation,” Journal of Hazardous Materials, vol. 318, pp. 407–416, 2016.
[28] Z. Wen, W. Wu, Z. Liu, H. Zhang, J. Li, and J. Chen,
“Ultrahigh-efficiency photocatalysts based on mesoporous Pt–WO3nanohybrids,”Physical Chemistry Chemical Physics, vol. 15, no. 18, p. 6773, 2013.
[29] ´E. Kar´acsonyi, L. Baia, A. Dombi et al., “The photocatalytic activity of TiO2/WO3/noble metal (Au or Pt) nano- architectures obtained by selective photodeposition,”
Catalysis Today, vol. 208, pp. 19–27, 2013.
[30] M. Rusu, M. Baia, Zs. Pap, V. Danciu, and L. Baia, “Structural investigations of TiO2-WO3-Au porous composites,”Journal of Molecular Structure, vol. 1073, pp. 150–156, 2014.
[31] G. Kov´acs, L. Baia, A. Vulpoi et al., “TiO2/WO3/Au nano- architectures’ photocatalytic activity, “from degradation
intermediates to catalysts’ structural peculiarities”, part I:
Aeroxide P25 based composites,”Applied Catalysis B: Envi- ronmental, vol. 147, pp. 508–517, 2014.
[32] L. Baia, E. Orb´an, S. Fodor et al., “Preparation of TiO2/WO3
composite photocatalysts by the adjustment of the semi- conductors’ surface charge,” Materials Science in Semi- conductor Processing, vol. 42, pp. 66–71, 2016.
[33] I. Sz´ekely, G. Kov´acs, L. Baia, V. Danciu, and Zs. Pap,
“Synthesis of shape-tailored WO3 micro-/nanocrystals and the photocatalytic activity of WO3/TiO2composites,”Mate- rials, vol. 9, no. 4, p. 258, 2016.
[34] S. K. Biswas and J. O. Baeg, “A facile one-step synthesis of single crystalline hierarchical WO3with enhanced activity for photoelectrochemical solar water oxidation,” International Journal of Hydrogen Energy, vol. 38, no. 8, pp. 3177–3188, 2013.
[35] R. Jenkins and R. Snyder, Introduction to Powder Diffrac- tometry, John Wiley & Sons, New York, NY,USA, 1996.
[36] H. Zhang and J. F. Banfield, “Understanding polymorphic phase transformation behavior during growth of nano- crystalline aggregates: insights from TiO2,”Journal of Physical Chemistry B, vol. 104, no. 15, pp. 3481–3487, 2000.
[37] M. R. Hoffmann, S. T. Martin, W. Choi, and D. W. Bahnemann, “Environmental Applications of Semi- conductor Photocatalysis,”Chemical Reviews, vol. 95, no. 1, pp. 69–96, 1995.
[38] S. S. Srinivasan, N. Kislov, J. Wade, M. T. Smith, E. K. Stefanakos, and Y. Goswami, “Mechanochemical syn- thesis, structural characterization and visible light photo- catalysis of TiO2/ZnFe2O4nanocomposites,” inProceedings of Symposium Materials Research Society, December 2005.
[39] S. S. Srinivasan, J. Wade, and E. K. Stefanakos, “Synthesis and Characterization of Photocatalytic TiO2-ZnFe2O4 Nano- particles,” Journal of Nanomaterials, vol. 2006, Article ID 45712, 4 pages, 2006.
[40] H. I. S. Nogueira, A. M. V. Cavaleiro, J. Rocha, T. Trindade, and J. D. P. De Jesus, “Synthesis and characterization of tungsten trioxide powders prepared from tungstic acids,”
Materials Research Bulletin, vol. 39, no. 4-5, pp. 683–693, 2004.
[41] J. Westerhaus, Infrared Spectra of the Ammonium Ion in Crystals, Royal Society of Chemistry, Cambridge, UK, 1981.
[42] Zs. Pap, V. Danciu, Zs. Cegl´ed et al., “The influence of rapid heat treatment in still air on the photocatalytic activity of titania photocatalysts for phenol and monuron degradation,”
Applied Catalysis B: Environmental, vol. 101, pp. 461–470, 2011.
Tribology
Advances in
Hindawi
www.hindawi.com Volume 2018
Hindawi
www.hindawi.com Volume 2018
International Journal ofInternational Journal of
Photoenergy
Hindawi
www.hindawi.com Volume 2018
Journal of
Chemistry
Hindawi
www.hindawi.com Volume 2018
Advances in
Physical Chemistry
Hindawi www.hindawi.com
Analytical Methods in Chemistry
Journal of
Volume 2018
Bioinorganic Chemistry and Applications
Hindawi
www.hindawi.com Volume 2018
Spectroscopy
International Journal ofHindawi
www.hindawi.com Volume 2018
Hindawi Publishing Corporation
http://www.hindawi.com Volume 2013
Hindawi www.hindawi.com
The Scientific World Journal
Volume 2018
Medicinal ChemistryInternational Journal of
Hindawi
www.hindawi.com Volume 2018
Nanotechnology
Hindawi
www.hindawi.com Volume 2018
Journal of
Applied ChemistryJournal of
Hindawi
www.hindawi.com Volume 2018
Hindawi
www.hindawi.com Volume 2018
Biochemistry Research International
Hindawi
www.hindawi.com Volume 2018
Enzyme Research
Hindawi
www.hindawi.com Volume 2018
Journal of
Spectroscopy
Analytical Chemistry
International Journal of
Hindawi
www.hindawi.com Volume 2018
Materials
Journal ofHindawi
www.hindawi.com Volume 2018
Hindawi
www.hindawi.com Volume 2018
BioMed
Research International
Electrochemistry
International Journal ofHindawi
www.hindawi.com Volume 2018
N a no ma te ria ls
Hindawi
www.hindawi.com Volume 2018
Journal of