Preparation of Pt electrocatalyst supported by novel, Ti
(1−x)Mo
xO
2‑C type of composites containing multi‑layer graphene
Ilgar Ayyubov1 · Adriana Vulcu2 · Camelia Berghian‑Grosan2 · Emília Tálas1 · Irina Borbáth1 · István E. Sajó3 · György Sáfrán4 · Judith Mihály1 ·
András Tompos1
Received: 15 October 2021 / Accepted: 10 December 2021
© The Author(s) 2021
Abstract
Ball milling is a relative simple and promising technique for preparation of inor- ganic oxide–carbon type of composites. Novel TiO2-C and Ti0.8Mo2O2-C type of composites containing multi-layer graphene were prepared by ball milling of graph- ite in order to get electrocatalyst supports for polymer electrolyte membrane fuel cells. Starting rutile TiO2 was obtained from P25 by heat treatment. Carbon-free Ti0.8Mo2O2 mixed oxide, prepared using our previously developed multistep sol–
gel method, does not meet the requirements for materials of electrocatalyst support, therefore parent composites with Ti0.8Mo2O2/C = 75/25, 90/10 and 95/5 mass ratio were prepared using Black Pearls 2000. XRD study of parent composites proved that the oxide part existed in rutile phase which is prerequisite of the incorporation of oxophilic metals providing CO tolerance for the electrocatalyst. Ball milling of TiO2 or parent composites with graphite resulted in catalyst supports with enhanced carbon content and with appropriate specific surface areas. XRD and Raman spec- troscopic measurements indicated the changes of graphite during the ball milling procedure while the oxide part remained intact. TEM images proved that platinum existed in the form of highly dispersed nanoparticles on the surface of both the Mo- free and of Mo-containing electrocatalyst. Electrocatalytic performance of the cat- alysts loaded with 20 wt% Pt was studied by cyclic voltammetry, COads-stripping voltammetry done before and after the 500-cycle stability test, as well as by the long-term stability test involving 10,000 polarization cycles. Enhanced CO toler- ance and slightly lower stability comparing to Pt/TiO2-C was demonstrated for Pt/
Ti0.8Mo2O2-C catalysts.
Keywords Composite material · TiMoOx · Graphite · Ball milling · Pt electrocatalyst · Long-term stability test
* Emília Tálas talas.emilia@ttk.hu
Extended author information available on the last page of the article
Introduction
The chemical energy of hydrogen can be transformed efficiently to electricity by means of polymer electrolyte membrane fuel cells (PEMFCs) [1]. One of the key components responsible for the longevity, performance and price of PEMFCs is the electrocatalyst [2]. Although significant efforts have been made to develop novel electrocatalysts for PEMFCs, state of art systems still use CO and corrosion sensitive Pt/C catalysts. The corrosion of carbon [3, 4], sintering and dissolution of Pt nanoparticles in acidic media are well known phenomena leading to activity loss. On the other hand, although the electrolysis of water is playing an increas- ingly important role, hydrogen fuel is still obtained in large quantities by steam reforming from fossil sources [5]. A critical issue of the usage of hydrogen from the latter source is the presence of carbon monoxide contaminant that poisons the platinum-based catalyst of the PEMFC. Thus, the development of novel corrosion resistant catalysts with improved CO tolerance is considered to be an important research goal [6].
TiO2-C composite supported Pt electrocatalyst have shown increased stability compared to traditional Pt/C ones [7–9]. Direct hydrothermal [10–12], as well as solvothermal [13, 14] synthesis is frequently used for formation of the TiO2 com- ponent, although use of sol–gel method has also been described [15]. Regarding the polymorphs of TiO2, anatase is the most commonly used in composite fabri- cation for both electrocatalysts and photocatalytsts although rutile is more stable thermodynamically [16]. A recent work suggested certain benefits of rutile TiO2 as electrocatalyst supports [17]. As for the carbon content of TiO2-C composites, there is a growing interest in graphite oxides as a carbon source [10, 11, 13–15, 18, 19].
Great number of studies have reported that some of the CO-poisoning-related issues of the Pt/C electrocatalysts can be overcome by use of a second oxophilic metal such as W, Mo on the surface [6, 20–22]. Oxophilic metals provides easer oxidation of the CO contaminant via the bifunctional mechanism if an intimate contact between the oxophilic sites and Pt exists [23, 24]. In our previous works we developed novel, composite supported Pt/Ti(1−x)MoxO2-C (C = carbonaceous material) electrocatalysts which showed better stability and increased CO tol- erance compared to the state-of-the-art PtRu/C catalyst [25, 26]. The advanta- geous properties of these electrocatalysts are derived from the special structural and functional properties of the composite support. The enhanced stability is due to the improved corrosion properties of the Mo-doped TiO2 coating on car- bon, as a result of the favorable mechanical, chemical and redox stability of the TiO2 skeleton. At the same time, the TiO2 coating helps to stabilize the Pt in a highly dispersed state. The unique CO tolerance of the novel composite supported catalysts could be attributed to the Mo oxophilic doping element. Regarding the activity and stability of these catalysts, exclusive incorporation of Mo into the rutile-TiO2 phase is one of the key points. Our multistep sol–gel-based synthesis method for these support includes three main steps: (i) low temperature deposi- tion of TiO2-rutile nuclei on the carbon backbone completed by an aging step,
(ii) introduction of the Mo precursor and (iii) incorporation of the Mo into the TiO2-rutile crystallites using a high-temperature treatment step [25–28]. The high specific surface area and the low electrical resistance of the above composites, which are prerequisites for electrocatalytic applications, are provided by the car- bonaceous backbone [28]. We have successfully prepared mixed oxide–carbon composite type of electrocatalyst supports with various Ti(1-x)MoxO2/C ratios by use of Vulcan XC-72, unmodified and functionalized Black Pearls 2000 (BP, Cabot) and graphite oxide (GO) derived carbonaceous materials [28].
Due to its extremely high surface area and its outstanding high conductiv- ity, graphene is a promising candidate for electrocatalyst support [29]. Although direct synthesis routes of graphene from graphite have several drawback in gen- eral [30], the mechanical ball milling procedure is considered as accessible and green approach to produce few layer graphene [31]. Ball milling has also given possibility to prepare N-doped graphene from graphite in order to use as elec- trocatalysts [32, 33]. Preparation of halogenated graphene nanoplatelets (GNP) for metal-free electrocatalyst by use of ball milling of graphite has also been described [34]. Ball milling has been successfully used for preparation of hybrid materials from another carbon sources too, e.g. multi-layer graphene (MLG) for MLG/Cu composite powders [35], GNP for (V2O5)1−x(GNP)x nanocomposite [36], Vulcan carbon for Pt–Co electrocatalysts [37] carbon nanotubes for carbon nanotube-inorganic hybrids [38], etc.
Based on the literature indications we supposed that ball milling could open a new, relatively easy and green pathway for the preparation of TiO2-graphene-like carbon composites. Therefore the aim of this work was the preparation of novel composites of TiO2-C, and Ti(1−x)MoxO2-C types by use of ball milling of graph- ite starting component. Our goal was focused on the possible synthesis of these new materials and on the physicochemical characterisation of them. Furthermore, we attempted to explore certain relationships between the main structural proper- ties of these Pt/TiO2-C, Pt/Ti(1−x)MoxO2-C electrocatalysts and their electrochem- ical behavior.
Experimental Materials
NaOH was purchased from Reanal. HNO3 (65%, a.r.) and 2-propanol were products of Molar Chemicals. Titanium-isopropoxide (Ti(O-i-Pr)4, Aldrich, 97%) was used as Ti precursor compound. BP supplied by Cabot and graph- ite carbon rode sieved into powder (99.9%, Merck, Darmstadt, Germany) were used as carbon sources. Glucose monohydrate (99%, Alfa Aesar, Kandel, Ger- many) was employed as exfoliating agent. Hexachloroplatinic acid hexahydrate (H2PtCl6⋅6H2O, 37.5% Pt, Sigma-Aldrich) was used as Pt precursor compound.
P25 (Evonik) TiO2 was used for the preparation of rutile TiO2.
Preparation of composites and composite supported catalysts
The preparation of Ti(1−x)MoxO2-C type of electrocatalysts support containing ball- milled graphite was carried out in two separate steps, flow chart of which is shown in Fig. S1.
In order to obtained rutile TiO2 (R), P25 was annealed in air at 1000 °C for 2 h.
Ti(1−x)MoxO2 mixed oxide containing parent composites were prepared first by use of our sol–gel-based multistep synthesis route developed previously [28]. The nomi- nal Ti/Mo ratio was 0.8/0.2. The nominal ratios of BP carbon material in the parent Ti0.8Mo0.2O2-C composites PC0, PC05, PC10, PC25 were 0, 5, 10, 25 wt%. The first synthesis step was completed by a high temperature heat treatment (HTT) as in our previous works [25].
As a second step, graphite was ball-milled with the parent composites or TiO2 in the presence of glucose in a planetary ball milling machine (PM 400, Tetsch Inc., Düsseldorf, Germany), at room temperature. The graphite, glucose and parent com- posites were loaded in a stainless steel grinding jar with 30 grinding ball (10 nm diameter) and grounded at 400 rpm for 24 h. The ratio between graphite, glucose and parent composite was 1:1:0.3. Then, the obtained materials (PC05-G, PC10- G, PC25-G) were boiled in water for 1 h and washed with hot water to remove the excess of glucose. The same method was employed for the synthesis of TiO2-based composites by using rutile-TiO2 instead of parent composites.
In order to obtain platinum containing electrocatalysts, the support materials were loaded with 20 wt% Pt via a modified, sodium borohydride (NaBH4) assisted ethylene–glycol (EG) reduction-precipitation method (see Fig. S2) as we described before [25].
Physicochemical characterization
X-ray powder diffraction (XRD) patterns were obtained in a Philips model PW 3710 based PW 1050 Bragg–Brentano parafocusing goniometer using Cu Kα radiation (λ = 0.15418 nm), graphite monochromator and proportional counter. Rutile lattice parameters were determined using a full profile fit (Pawley-fit) [39].
Nitrogen physisorption measurements were carried out at temperature of liquid nitrogen using Thermo Scientific Surfer automatic volumetric adsorption analyzer (Thermo Fischer Scientific, Berlin, Germany). The specific surface was calculated by the BET method (SBET) in the range of relative pressures from 0.05 to 0.30.
Morphology of the parent composite and of the oxide—multi-layer graphene type of catalyst support obtained from it was compared by use of a ZEISS EVO 40XVP Scanning Electron Microscope (SEM, accelerating voltage: 20 kV, W-filament working distance 8 mm).
Raman spectra were recorded using a JASCO NRS-3300 equipped with a CCD detector. The samples were investigated under the 514.5 nm laser exci- tation wavelength; the grating was set at 600 l/mm and the slit to 0.1 × 6 mm for the main samples; an exception consisting in the use of a 1 × 6 mm slit was
employed for the analysis of the parent compounds—PC05, PC10 and PC25.
The incident laser beam was focused using an Olympus UMPLFL 100X micro- scope objective lens and the 521 cm−1 peak of the Si was used for the instrument calibration. The experimental Raman data were analyzed with OriginPro 2017 (OriginLab).
Morphology of the electrocatalysts was investigated by Transmission Electron Microscopy (TEM) in HRTEM and STEM HAADF modes by means of a FEI Titan Themis 200 kV Cs—corrected TEM with 0.09 nm HRTEM and 0.16 nm STEM resolution. Composition of the samples was measured by STEM-EDS.
Elemental mapping were carried out by spectrum imagine.
The Pt, Mo, and Ti content of the electrocatalyst samples was measured by inductively coupled plasma-optical emission spectrometry (ICP-OES) technique by use of a simultaneous SPECTRO GENESIS instrument with axial plasma observation. Samples were measured after microwave assisted dissolution in 1:2:6 mixtures of concentrated hydrofluoric acid: hydrochloric acid: nitric acid.
Electrochemical characterization
The details of the electrochemical characterization including the preparation of working electrode, the composition of catalyst ink and electrocatalytic meas- urements were described in Refs. [25, 28, 40]. The measurements were done in a standard three-electrode cell using 0.5 M H2SO4 electrolyte solution. The Pt loading of the electrodes was 10 µg cm−2. Glassy carbon (surface area:
0.0707 cm2) was used as working electrode, platinum wire as counter electrode and a hydrogen electrode as reference electrode. All potentials are given on RHE scale.
Electrocatalytic performance of the catalysts loaded with 20 wt% Pt was stud- ied by cyclic voltammetry, COads-stripping voltammetry done before and after the 500-cycle stability test, as well as by the long-term stability test involving 10,000 polarization cycles.
Electrochemically active Pt surface area (ECSAHupd) determined from the amount of underpotentially deposited hydrogen on the platinum surface was cal- culated using the Eq. 1 [41]:
The change of the electrochemically active Pt surface area (ΔECSA value) was defined using the Eq. 2 [28]:
Here ECSAN/ECSA1 ratio is the change of the electrochemically active Pt surface area upon the N-cycle stability test (ECSAN; N: 500, 2500, 5000 and 10,000) normalized to ECSA1 measured in the first cycle on the same sample.
(1) ECSAHupd(
cm2)
=QoxHupd(𝜇C)∕210(
𝜇C∕cm2)
(2) ΔECSAN={
1−(
ECSAN∕ECSA1)}
×100%
Results and discussion
Characterization of parent composites and multi‑layer graphene derived electrocatalyst supports
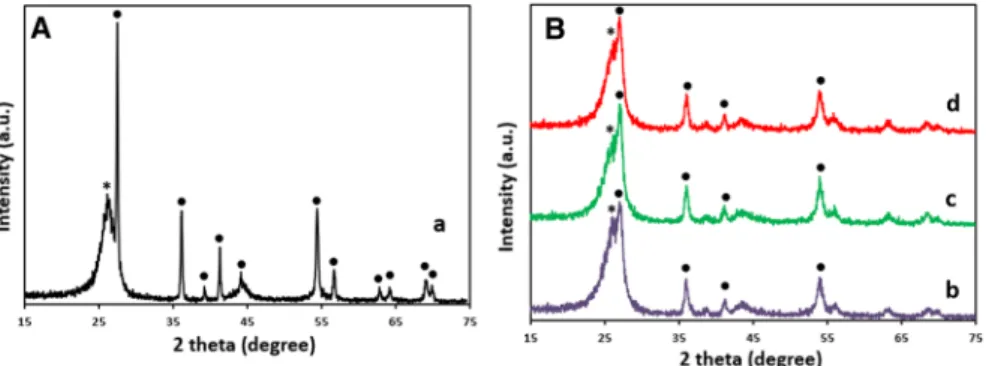
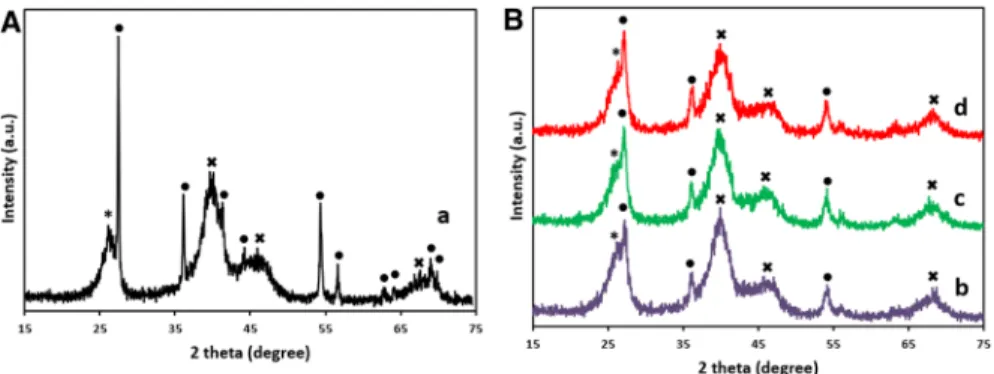
Our previous studies have revealed that (i) complete incorporation of the oxophilic metal can be achieved only into the TiO2-rutile lattice and (ii) the formation of the rutile phase TiO2 nucleus before the HTT is prerequisite [25, 28]. We have also observed that strong acidic media adjusted by HNO3 is necessary for the formation of the rutile nuclei. Our previous works have showed that high temperature heat treatment (600 °C, 8 h, Ar atmosphere) is essential for the formation of the mixed oxide phase in the Ti(1−x)MoxO2-C type of composites [25]. Therefore, the key issue in the preparation of the parent mixed oxide containing composites was the exclusive appearance of rutile phase either in the low temperature treated (85 °C) or in high temperature treated (600 °C) samples. Results of XRD analysis of parent samples showed that the sample PC0 without any carbonaceous material did not meet this criteria (Fig. 1AB, line a). It also contained anatase and rutile phases in addition to the separate MoO3 phase both in its form of before and after HTT (Fig. 1AB, line a).
As in case of 25 wt% nominal carbon content our preparation method was suc- cessful [28]; we were curious to know whether smaller carbon content could lead to successful preparation. So, we decreased the carbon content to 10 wt% and 5 wt% (PC10 and PC05). The XRD data proved that decreased carbon content also resulted in mainly rutile phases and only a negligible amount of separated Mo oxide phase was observed in the samples (Fig. 1) before and after HTT (Fig. 1AB, lines b, c, d). The diffraction patterns of the high temperature treated samples became sharper indicating the crystallization under HTT (cf. Fig. 1A, B).
Fig. 1 XRD patterns of the parent Ti(1−x)MoxO2-C composites before (A) and after HTT (B) in the first step of the preparation of the electrocatalyst supports (see denomination of samples in Chapter 2.2).
a—PC0, b—PC05, c—PC10, d—PC25. Filled circle—rutile, filled diamond—anatase, filled inverted triangle—MoO2, filled square—MoO3
An explanation for the fact that the preparation of carbon-free mixed oxide by the method we developed was not successful may be as follows. The surface area of the carbon-free TiO2-containing material obtained at the end of the aging stage was not large enough which resulted in SBET 39 m2 g−1 after HTT. Contrary, BP owning SBET 1635 m2g−1 [42] behaved as a template during the preparation of the BP carbon-containing samples. Thus, the Mo precursor could form a rela- tive thin layer on the surface of the TiO2-rutile crystallites, which provided less opportunity for the appearance of a separate Mo oxide phase during HTT. SBET of BP-containing parent composites after HTT were 45 g m−2, 79 g m−2 and 238 g m−2 for PC05, PC10 and PC25.
Rutile-TiO2 as well as the parent composites, described above (excluding PC0), were ground in a ball mill together with graphite to induce the transformation of graphite in a solid phase reaction. SEM images (Fig. 2) clearly showed significant differences in the morphology of the parent composite and of the graphite derived electrocatalyst support obtained from it. While PC10 parent composite reflected the ball shape of BP, PC10-G electrocatalyst support showed a layered structure originated probably from graphite.
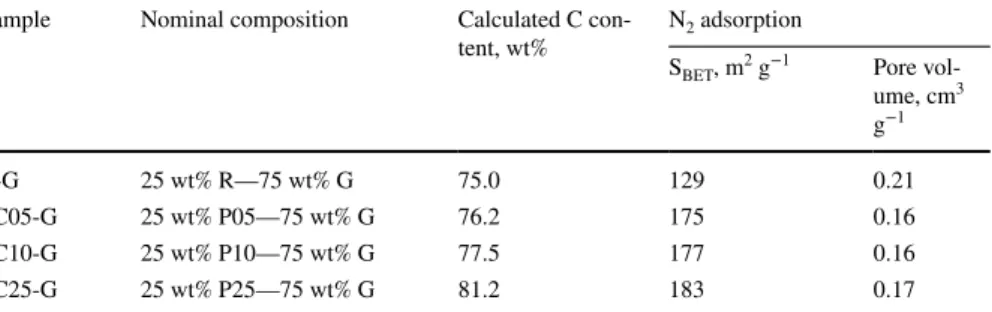
Some characteristic properties of the electrocatalyst supports obtained by ball milling procedure were summarized in Table 1.
Fig. 2 SEM image of PC10 parent composite (A) and PC10-G electrocatalyst support (B) (see denomi- nation of samples in Chapter 2.2)
Table 1 Main structural properties of graphite derived electrocatalyst supports (see denomination of samples in Chapter 2.2)
Sample Nominal composition Calculated C con-
tent, wt% N2 adsorption
SBET, m2 g−1 Pore vol- ume, cm3 g−1
R-G 25 wt% R—75 wt% G 75.0 129 0.21
PC05-G 25 wt% P05—75 wt% G 76.2 175 0.16
PC10-G 25 wt% P10—75 wt% G 77.5 177 0.16
PC25-G 25 wt% P25—75 wt% G 81.2 183 0.17
The Mo-free sample obtained by ball milling of rutile TiO2 and graphite had somewhat smaller specific surface area and a larger pore volume than the Mo-con- taining samples. The SBET and pore volume values of the Mo-containing samples were nearly identical. However, despite similar values, the adsorption isotherm of Mo-free composite (R-G) and molybdenum-containing composites (PC05-G, PC10-G, PC25-G) differed significantly (cf. Figs. S3A and S3B, S3C, S3D). While sample R-G showed hysteresis loop type of H3 [43] the Mo-containing samples did H2 type [43] of it which was characteristic to slit like pores. Although both of the samples had mesopores, the pores were somewhat smaller in case of Mo-containing samples. It could be concluded that the presence of carbon in the parent compos- ite has certain effect on structure of the ball milled material. However, it should be noted that the specific surface area of all samples met the requirements for electro- catalyst supports (> 100 m2 g−1) [44].
Results of the XRD analysis of the multi-layer graphene-containing electrocata- lyst supports can be seen in Fig. 3.
The XRD pattern of graphite starting material had a strong and sharp peak at about 26.5° (not shown) in line with the literature data [45, 46]. As an effect of ball milling a definite broadening of the peak characteristic for the carbonaceous mate- rial appeared in the XRD pattern of sample R-G indicating the change of the starting graphite. At the same time the peaks characteristic for rutile were quite sharp indi- cating the well crystallized form of TiO2 in this sample (Fig. 3A). Similarly, XRD pattern of Mo-containing samples showed the broad peak at about 26° (Fig. 3B).
Different type of carbonaceous material can be obtained from graphite depend- ing on the time of ball milling and the nature of the exfoliation agent or the reac- tants used. Nanocrystalline graphite with a crystallite size of about 2 nm was formed after 8 h of ball milling [47], while turbostratic carbon (t-carbon) was obtained by longer milling and amorphous carbon was produced when the milling time was long enough [48, 49]. Using the Bragg law and the Scherrer equation [50], the interlayer spacing-d and the crystallite size-D of the carbonaceous materials were estimated using the XRD characteristic data (see Table 2). Various values are found for the
Fig. 3 XRD pattern of the Mo-free (R-G) (A) and the Mo-containing supports (B). (see denomination of samples in Chapter 2.2). a—R-G, b—PC05-G, c—PC10-G, d—PC25-G. filled circle—rutile, aster- isk—carbon
average number—n (calculated as D/d) of the graphitic sheets of the investigated composites; they vary from 131 in graphite to about 43–45 in the parent compounds and 14–19 in the ball-milled compounds.
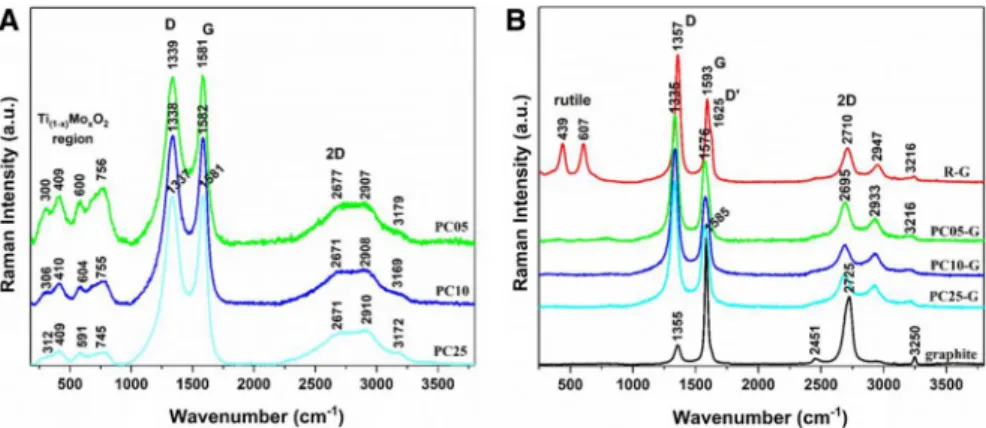
In order to get further information, especially from the carbonaceous part of the supports, Raman spectroscopic measurements were also carried out (Fig. 4.)
Fig. 4 presents the Raman fingerprint of the investigated carbonaceous mate- rials. Thus, in the Fig. 4A, containing the PC05, PC10 and PC25 parent com- posites, the most prominent spectral features were assigned to D and G peaks from the BP carbon. The 2D bands were also observed in the spectral domain 2400–3600 cm−1, but for these compounds, the bands appeared as broad peaks.
Table 2 Structural parameters of the graphite and the investigated carbonaceous materials obtained from XRD data (θ-angle of diffraction; FWHM-full width of peaks at half maxima;
D-crystallite size; d-interlayer spacing; n-number of layers)
(see denomination of samples in Chapter 2.2)
a Nominal Pt content was 20 wt%
Sample XRD parameters
2θ (°) FWHM (°) D (nm) d (nm) n
Graphite 26.39 0.26 44 0.337 131
PC05 26.60 0.63 15 0.335 44
PC10 26.44 0.64 15 0.337 43
PC25 26.28 0.61 15 0.339 45
R-G 26.12 1.71 5 0.341 15
PC05-G 26.29 1.47 6 0.339 17
PC10-G 26.33 1.41 6 0.338 18
PC25-G 25.95 1.28 7 0.343 19
aPt/R-G 26.16 1.62 5 0.340 18
aPt/ PC05-G 26.32 1.31 7 0.338 19
aPt/ PC10-G 26.64 1.63 5 0.334 16
aPt/ PC25-G 26.16 1.74 5 0.340 14
Fig. 4 Results of the Raman spectroscopic measurements obtained for PC samples (A) and graphite, PC-G and R-G samples (B)
Moreover, some peaks were distinguished in the region 200–900 cm−1; they could be associated to the Ti(1-x)MoxO2 species and possess the higher intensities for the composite consisting of low carbon support (PC05).
Fig. 4B shows the Raman spectra of the graphite and various composites pre- pared by the ball milling procedure from the graphite material. The Raman spec- trum of the graphite starting material was dominated by the characteristic, sharp G-peak at 1585 cm−1 related to the in-plane vibration of sp2 hybridized carbon atoms [51]. Minor amount of defects was present in the sample as witnessed by the small D-peak at 1355 cm−1 [52]. In the R-G sample, that is obtained from graphite and TiO2-rutil by the ball milling procedure, the intensity ratio of the D peak to the intensity of the G peak increased drastically (resulting in ID/IG = 1.63, Table 3). Similar effect was observed by Welham et al. studying the effect of extended ball milling on pure graphite [53]. Moreover, a shoulder at 1625 cm−1 appeared in the spectrum of the R-G sample. This might be assigned to C=C bond vibrations and indicated the presence of sp3 C fraction, too. The Raman bands at 607 and 439 cm−1 were typical for pure rutile TiO2, belonging to A1g and Eg symmetries, respectively [54].
The PC05-G, PC10-G and PC25-G samples, obtained from the PC05, PC10 and PC25 parent composites and the graphite by the ball milling procedure, high- lighted Raman characteristics that were similar with the R-G sample, although some differences could be clearly seen in their Raman spectra and parameters (Fig. 4B; Table 3).
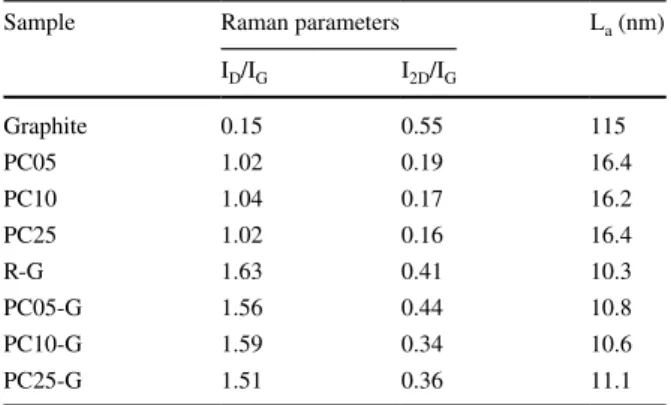
A better comparison of the investigated samples can be made by analyzing the crystallite sizes La obtained using the Tuinstra-Koenig (TK) relation [55]:
La(nm) = (2.4 × 10⁻¹⁰)λ4(ID/IG)−1, where λ is the laser excitation wavelength (514 nm). The results presented in Table 3 column La clearly showed different crystallite sizes for graphite, the parent composites and multi-layer graphene based PC05-G, PC10-G and PC25-G electrocatalyst supports.
A brief analysis of the results obtained for the crystallite size, when the XRD and Raman methods were considered, indicated a slight difference between the two techniques (cf. data in Tables 2, 3). These differences could be related to the fact that, in the XRD pattern, a superposition between the rutile and the graphitic
Table 3 Raman parameters obtained for the graphite and the investigated carbonaceous materials (see denomination of samples in Chapter 2.2)
Sample Raman parameters La (nm)
ID/IG I2D/IG
Graphite 0.15 0.55 115
PC05 1.02 0.19 16.4
PC10 1.04 0.17 16.2
PC25 1.02 0.16 16.4
R-G 1.63 0.41 10.3
PC05-G 1.56 0.44 10.8
PC10-G 1.59 0.34 10.6
PC25-G 1.51 0.36 11.1
peak of the carbonaceous materials existed and induced some difficulties in obtaining precise values for the XRD parameters (Fig. 3; Table 2).
Characterization of graphite derived electrocatalyst Physicochemical characterization
Some characteristic features of the multi-layer graphene–oxide composite type elec- trocatalysts were collected in Table 4. Results of XRD measurements of the 20 wt%
Pt containing electrocatalyst were presented in Fig. 5. Regarding carbonaceous part of the electrocatalysts, the structural parameters calculated from XRD data were very similar to those of the composite type support (see Table 2). Regarding the oxide part of the electrocataslysts, lattice parameters and Mo substitution were also calculated from the XRD data (Table 4). The latter data indicated that the incorpo- ration of Mo was very similar in all three samples and they were consistent with our previous findings [28]. It could be concluded that the nature of the mixed oxide phase did not change during the ball milling and Pt introduction procedures; and the traces of the Mo-oxides could not be detected anymore by XRD.
Table 4 Some characteristic features of the electrocatalysts with nominal value Pt of 20 wt% (see denomination of supports in Chapter 2.2)
Sample XRD ICP
Lattice parameters, Å Mo subst. (x), % Pt, wt% Mo, wt% Ti, wt% x, %
Pt/R-G a = 4.593, c = 2.959 – 18.8 0 n.d 0
Pt/PC05-G a = 4.63, c = 2.94 15 ± 3 19.2 2.9 6.4 18.7
Pt/PC10-G a = 4.63, c = 2.94 15 ± 3 18.9 2.6 6.2 17.5
Pt/PC25-G a = 4.63, c = 2.94 15 ± 3 18.5 2.1 4.8 17.7
Fig. 5 XRD patterns of the graphite derived molybdenum-free (A) and Mo-containing (B) electrocatalys with nominal Pt content of 20 wt%. (see denomination of supports in Chapter 2.2). a—Pt/R-G, b—Pt/
PC05-G, c—Pt/PC10-G, d—Pt/PC25-G. filled circle—rutile, asterisk—carbon, times—Pt
The presence of Pt was indicated by a broad peak at about 40° in the XRD pattern (cf. Figs. 3, 5). Our previous works have demonstrated that this type of peak is char- acteristic for finely dispersed Pt particles with average size around 2–3 nm [27, 28].
Results of ICP measurements (see Table 4) presented that the Pt content of the samples was in a good agreement with the nominal value of Pt. The x value was also calculated from the Ti and Mo content measured by ICP. The value of x is an indica- tor of the incorporation of molybdenum; the values of it calculated from the ICP and the XRD results were the same for sample Pt/PC10-G and Pt/PC25-G within the margin of error. The x value of the Pt/PC05-G sample calculated from ICP results was a bit higher than that of calculated from XRD. This observation may suggest that a small fraction of Mo existed in amorphous form or on a scale below XRD detectability, closely bound to the mixed oxide but not incorporated into it. The dif- ferent behavior of Pt/PC05-G from the other two molybdenum-containing samples can probably be explained by the too low carbon content and SBET of the parent composite PC05.
TEM images (Fig. S4) confirmed that platinum existed in the form of highly dis- persed nanoparticles both on the surface of the Mo-free (Pt/R-G) and of Mo-con- taining (Pt/PC10-G) electrocatalyst samples, although the average particle size was somewhat higher on the Mo-free sample (2.8 ± 0.9 nm, Fig. S4D) than on the Mo- containing one (2.3 ± 0.8 nm, Fig. S4H). Crystallite size values of Pt calculated from XRD data (Table S1) correlate well with the mean Pt particle size values determined from the TEM images of the Pt/PC10-G and Pt/R-G samples (Figs. S4D, S4H).
Elemental maps of the Mo-free sample (Pt/R-G) from two different detected areas (series A and B) can be seen in Fig. S5. The Ti and Pt pattern were approxi- mately congruent, indicating that Pt nanoparticles preferred the oxide part of the composite-type support during the Pt introduction, which can provide increased sta- bility compared to the commercial carbon supported Pt catalysts. Fig. S6 presents the elemental maps of the Mo-containing sample (Pt/PC10-G) from two different detected areas (series A and B). The O and Ti patterns were almost congruent, but the Mo pattern was slightly smeared compared to that of Ti. Strong mechanical effects during the grinding of the mixed oxide by ball mill can be a probable expla- nation for this observation. Again, the Pt pattern follows the pattern of the oxides.
Electrochemical characterization
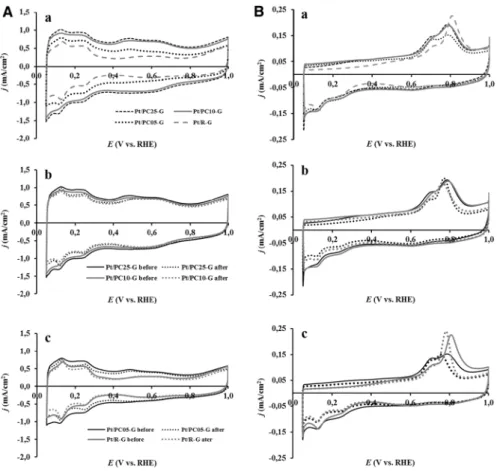
The comparison of the cyclic voltammograms and the COads stripping voltammo- grams of the 20 wt% Pt catalysts supported on the TiO2-C and the Ti0.8Mo0.2O2-C composite prepared by use of ball milling with graphite was presented in Fig. 6.
Cyclic voltammograms of the Mo-free and Mo-containing Pt electrocatalysts obtained on fresh samples were compared on Fig. 6a (panel A). As shown in Fig. 6a on the Ti0.8Mo0.2O2-C composite supported Pt catalyst besides the classical fea- tures of the under-potentially deposited hydrogen adsorption/desorption between 50 and 350 mV, a characteristic redox peak pair between 380 and 530 mV, which was assigned to oxidation/reduction of reducible MoOx surface species, were also detected. According to the literature [56, 57] and our own studies [40, 58] the
appearance of strong redox peaks in the voltammograms clearly confirms that there is an active interface between the Pt NPs and Mo-containing support.
As can be seen from Fig. 6a (panel A) an increase of the content of BP carbon in the parent composites from 5 up to 25 wt% resulted in some increase of the double layer capacitance of electrocatalysts, showing wider CV hysteresis.
Cyclic voltammograms of the various electrocatalysts recorded before and after 500 cycles of the stability test were compared on Fig. 6b and c (A panel).
As shown in Fig. 6b the behavior and the stability of the Pt/PC25-G and Pt/
PC10-G electrocatalysts during cyclic polarization were very similar. However, subsequent decrease of the BP carbon content to 5 wt% in the PC05-G compos- ite supported electrocatalyst results in less pronounced Mo redox peak pair in cyclic voltammograms (see Fig. 6c, panel A) and slightly lower electrochemi- cally active surface area of the Pt (ECSA, see Table 5). Nevertheless, it should
Fig. 6 Cyclic voltammograms (A panel) and COads stripping voltammograms (B panel) of the (a): Pt/
PC25-G (short dashed), Pt/PC10-G (grey solid), Pt/PC05-G (dotted) and Pt/R-G (grey dashed) fresh catalysts; (b): Pt/PC25-G (black), Pt/PC10-G (grey) and (c): Pt/PC05-G (black), Pt/R-G (grey) electro- catalysts recorded in 0.5 M H2SO4 before (solid curves) and after 500 cycles (dotted curves) of the stabil- ity test. Sweep rate: 100 mV/s (A panel) and 10 mV/s (B panel)
be noted that the difference of the ECSA values of the three Mo-containing Pt catalysts were minimal and average ECSA value was equal to (45.6 ± 2.0) m2/gPt. In addition, the presence of various amounts of BP carbon in the composites does not significantly affect the short-term stability of the related Pt electrocatalysts (see ΔECSA500 values in Table 5).
In this series of experiments, the smallest electrochemically active Pt surface area value, shown in Table 5, was obtained on the Mo-free Pt/R-G catalyst. These results are in a good agreement with the Pt particle size values determined from TEM experiments for the Mo-containing and Mo-free Pt electrocatalysts: (2.3 ± 0.8) nm and (2.8 ± 0.9) nm, respectively. It can be assumed that the presence of Mo in the catalysts can lead to a higher dispersion of Pt on the support surface. Fig. 6c and the results presented in Table 5 demonstrate higher stability of the Mo-free Pt/R- G catalyst during the 500 polarization cycles: the loss in the ECSA during 500- cycle stability test was 7.6%. Moreover, as seen from Fig. 6c, during short-term stability test the main changes in the shape of the voltammogram were observed in the range between 50 and 350 mV, related to the peaks of hydrogen adsorption/
desorption on the Pt surface.As shown in Fig. 6c, no changes were observed in the 400 < E < 800 mV potential range over 500 polarization cycles, indicating a high sta- bility of the TiO2-C composite prepared by use of ball milling with graphite.
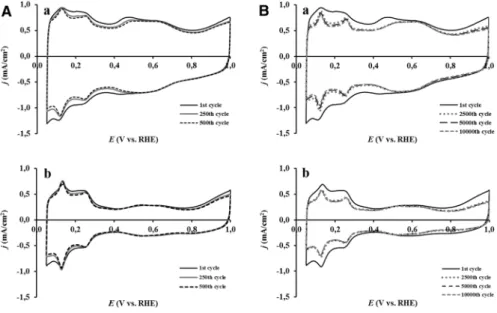
Cyclic voltammograms of the Pt/PC25-G and Pt/R-G catalysts obtained during stability test involving 500 (A panel) and 10,000 (B panel) polarization cycles are demonstrated in Fig. 7a and b.
As can be seen from Fig. 7, in contrast to the Pt/R-G sample, the changes in the shape of the voltammograms of the Pt/PC25-G catalyst observed during long-term stability test affect not only the peaks associated with the hydrogen adsorption and desorption on the platinum, but also the redox peaks of molybdenum.
It is well-known that in the case of a catalyst containing a non-noble metal com- ponent changing of the voltammetric curves during the cyclic polarization can be significant [22, 59]. It is obvious that this behavior is more expressed on the samples containing the highest amount of non-incorporated Mo species [60]. As shown in Fig. 7a, the non-incorporated Mo species can be dissolved or re-arranged during the
Table 5 Electrochemical characterization of the 20 wt% Pt catalysts supported on the TiO2-C and the Ti0.8Mo0.2O2-C composite prepared by use of ball milling with graphite. Effect of the presence of molyb- denum
a The position of the main CO stripping peak and shoulder in brackets (sh) obtained on fresh catalysts;
b ΔECSA500 and ΔECSA10,000 values were calculated according to the Eq. 2 (see Experimental part);
c ΔECSA500 values were calculated from the 10,000-cycle stability measurements
Sample ECO,max,a mV ECSA1, m2/gPt ΔECSA500, % b, c) ΔECSA10,000,
% b)
Pt/PC25-G 785 (sh: 695) 45.6 ± 2.8 10.9 37.5
Pt/PC10-G 785 (sh: 705) 47.6 ± 1.9 11.2 41.3
Pt/PC05-G 785 (sh: 705) 44.6 ± 2.8 11.4 45.5
Pt/R-G 805 (sh: 705) 40.0 ± 2.8 7.6 33.6
stability test. Upon stability tests this process leads to an increase in the ΔECSA val- ues of Mo-containing catalysts (see Table 5).
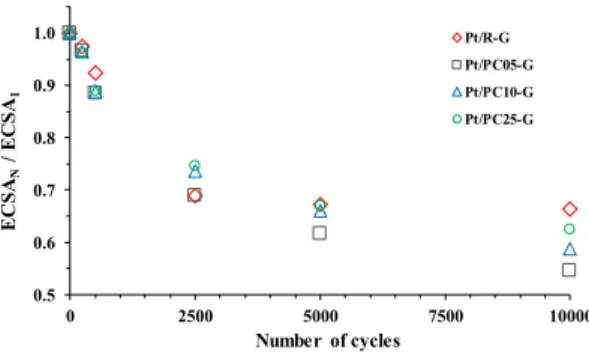
The comparison of the ECSA loss (ΔECSA) values presented as a function of the number of cycles of the stability test for all Pt catalysts prepared by use of ball milling with graphite was presented in Fig. 8. As shown in Fig. 8 the best result during long-term stability test was obtained on the Pt/R-G catalyst.
In addition, it should be noted that after 2500 polarization cycles the decrease in the ECSA values on this catalyst was negligible. As can be seen from Fig. 8 the stability of the Mo-containing catalysts is slightly lower and depends on the content of the BP carbon in the parent composites. An increase of the BP carbon content from 5 to 25 wt% in the parent composites of the related Pt electrocatalyst leads to an increase of the long-term stability, which is reflected in lower values of ΔECSA10,000 (see Table 5).
We have recently demonstrated [28] that Pt not coupled to mixed oxide or interacting with segregated Mo-oxides is known to suffer from strong degrada- tion during cyclic potential changes due to electrocorrosion or dissolution of Mo, potentially even leading to detachment of Pt particles. We assume that the het- erogeneity of the mixed oxide structure in the catalysts, where Pt particles can occur in many different environments (such as areas with stable mixed oxide for- mations, spots with carbonaceous materials not covered with mixed oxide, and isolated areas of Mo oxide), may be the reason of the lower stability compared to more homogeneous samples.
Fig. 7 Cyclic voltammograms of the Pt/PC25-G (a) and Pt/R-G (b) catalysts obtained during (panel A) 500-cycle stability test and (B panel) long-term stability test involving 10,000 polarization cycles.
Recorded in Ar purged 0.5 M H2SO4 solution between 50 and 1000 mV potential limits with 100 mV s−1 sweep rate
Thus, achieving a more uniform microstructure during the preparation of cata- lysts with a ball mill may be the key to improving stability.
Comparison of the COads stripping behaviour of the Pt/Ti0.8Mo0.2O2-C electro- catalysts to the Mo-free Pt/TiO2-C catalyst (see Fig. 6a, Bpanel B) demonstrates increased CO tolerance of the Mo-containing catalysts. As can be seen in Fig. 6a and Table 5, on the Pt/R-G catalyst the main CO oxidation peak is located at ca.
805 mV, while the corresponding peak in the case of the Mo-containing catalysts is around 785 mV. It is necessary to mention that besides the main COads-stripping peak, a small pre-oxidation peak (shoulder) at ~ 695–705 mV was also observed on all catalysts, which usually associated with CO electrooxidation on Pt sites, where Pt and atoms of oxophilic metal/metals (Mo, Ti) are in atomic closeness. Moreover, in good agreement with our previous studies [28, 40], in contrast to the Mo-free Pt/R- G sample, on Mo-containing catalysts the electrooxidation of CO (the so-called
“pre-peak”) started at exceptionally low potential values (ECO,onset = 50 mV).
Thus, the CO tolerance requires very intimate contact between the mixed oxide and the Pt; in other words, the surface electrochemistry of catalysts is largely deter- mined by the Pt–Mo and Pt–Ti interfacial sites, which are probably smaller in com- posites with a low mass ratio of oxide to carbon, as in the case of the final composite materials with carbon content between 75 and 81.2 wt% prepared using a ball mill (see Table 1 of the manuscript).
Fig. 6b and c (panel B) compare COads stripping voltammograms of the electro- catalysts recorded before and after 500-cycle stability test. As shown in Fig. 6b, no differences in the behavior and stability of the Pt/PC25-G and Pt/PC10-G electro- catalysts were observed during COads stripping measurements. As seen in Fig. 6c, the stability test for 500 cycles affects the shape of both COads stripping voltammo- grams obtained on the Pt/R-G and Pt/PC05-G electrocatalysts. It should be noted the shift of the main CO stripping peak after stability test toward less positive poten- tial values by approx. 10 mV in comparison to that obtained over fresh samples is quite common and can be an indication of some agglomeration of Pt nanoparticles [61].
Fig. 8 Electrochemical long- term stability test of the 20 wt%
Pt catalysts supported on the TiO2-C and the Ti0.8Mo0.2O2-C composites prepared by use of ball milling with graphite: com- parison of the electrochemically active Pt surface area measured after N cycles normalized to ECSA measured in the 1st cycle (ECSAN/ECSA1) as a function of the number of cycles (N)
0.5 0.6 0.7 0.8 0.9 1.0
0 2500 5000 7500 10000
ECSAN/ ECSA1
Number of cycles
Pt/R-G Pt/PC05-G Pt/PC10-G Pt/PC25-G
Conclusions
Novel, TiO2/C and Ti0.8Mo2O2-C type of composites containing multi-layer gra- phene were successfully prepared by ball milling of graphite in order to get new types electrocatalyst supports for PEMFCs. Carbon-free Ti0.8Mo2O2 mixed oxide, prepared using our previously developed multistep sol–gel method, does not meet the requirements for materials of electrocatalyst support, probably due to the low surface area of the TiO2-C material obtained in the aging step, which was insuffi- cient to incorporate Mo into the TiO2-rutile crystallites during the HTT step. There- fore, parent composites with Ti0.8Mo2O2/C = 75/25, 90/10 and 95/5 mass ratio were prepared using Black Pearls 2000. XRD study of parent composites proved that the oxide part existed almost exclusively in rutile-TiO2 phase which is prerequisite of the incorporation of oxophilic metals providing CO tolerance for the electrocata- lyst. Ball milling of rutile-TiO2 or the parent composites with graphite resulted in catalyst supports with high carbonaceous materials content and appropriate specific surface areas. XRD and Raman spectroscopic measurements indicated the changes of graphite during the ball milling procedure while the oxide part remained intact.
TEM images proved that platinum existed in the form of highly dispersed nanopar- ticles both on the surface of the Mo-free and of Mo-containing electrocatalyst sam- ples. Elemental maps indicated that Pt nanoparticles preferred the oxide part of the composite-type support. The Mo element map was slightly more diffuse than the Ti element map which was attributed to the strong mechanical effects during the grind- ing of the mixed oxide.
Electrocatalytic performance of the Mo-free and of Mo-containing Pt catalysts was studied by cyclic voltammetry, COads-stripping voltammetry done before and after the 500-cycle stability test, as well as by the long-term stability test involving 10,000 polarization cycles. Cyclic voltammograms of the Pt/Ti0.8Mo0.2O2-C electro- catalysts showed a characteristic redox peak pair between 380 and 530 mV, which was assigned to oxidation/reduction of reducible MoOx surface species indicating an active interface between the Pt NPs and Mo-containing support. The presence of various amounts of BP carbon in the composites does not significantly affect the short-term stability of the related Pt electrocatalysts. The Pt/TiO2-G electrocatalyst was more stable in the long term electrocatalytical tests than its Mo-containing ana- logues. Comparison of the COads stripping behaviour of the Pt/Ti0.8Mo0.2O2-C sam- ples to the Mo-free Pt/TiO2-C one demonstrated increased CO tolerance of the Mo- containing catalysts in line with the results of our previous work.
Supplementary Information The online version contains supplementary material available at https:// doi.
org/ 10. 1007/ s11144- 021- 02138-x.
Acknowledgements The research within project No. VEKOP-2.3.2-16-2017-00013 was supported by the European Union and the State of Hungary, co-financed by the European Regional Development Fund.
Project No. NNE130004 has been implemented with the support provided from the National Research, Development and Innovation Fund of Hungary, financed under the TR-NN-17 funding scheme. We acknowledge that the purchase of THEMIS transmission electron microscope was financed by the Hun- garian innovation project: VEKOP-2.3.3.15-2016-00002. The authors also thank Dr. Ágnes Szegedi for the nitrogen physisorption measurements, Dr. Eszter Bódis for SEM measurements and Dr. Zoltán May for the ICP-OES measurements.
Funding Open access funding provided by ELKH Research Centre for Natural Sciences.
Open Access This article is licensed under a Creative Commons Attribution 4.0 International License, which permits use, sharing, adaptation, distribution and reproduction in any medium or format, as long as you give appropriate credit to the original author(s) and the source, provide a link to the Creative Com- mons licence, and indicate if changes were made. The images or other third party material in this article are included in the article’s Creative Commons licence, unless indicated otherwise in a credit line to the material. If material is not included in the article’s Creative Commons licence and your intended use is not permitted by statutory regulation or exceeds the permitted use, you will need to obtain permission directly from the copyright holder. To view a copy of this licence, visit http:// creat iveco mmons. org/ licen ses/ by/4. 0/.
References
1. Wang Y, Chen KS, Mishler J et al (2011) A review of polymer electrolyte membrane fuel cells:
technology, applications, and needs on fundamental research. Appl Energy 88:981–1007. https://
doi. org/ 10. 1016/j. apene rgy. 2010. 09. 030
2. Ren X, Wang Y, Liu A et al (2020) Current progress and performance improvement of Pt/C cata- lysts for fuel cells. J Mater Chem A 8:24284–24306. https:// doi. org/ 10. 1039/ d0ta0 8312g
3. Meier JC, Galeano C, Katsounaros I et al (2012) Degradation mechanisms of Pt/C fuel cell catalysts under simulated start-stop conditions. ACS Catal 2:832–843. https:// doi. org/ 10. 1021/ cs300 024h 4. Meier JC, Galeano C, Katsounaros I et al (2014) Design criteria for stable Pt/C fuel cell catalysts.
Beilstein J Nanotechnol 5:44–67. https:// doi. org/ 10. 3762/ bjnano. 5.5
5. FreedomCAR, Fuel Partnership (2009) Hydrogen production overview of technology options 6. Mukerjee S, Urian RC, Lee SJ et al (2004) Electrocatalysis of CO tolerance by carbon-supported
PtMo electrocatalysts in PEMFCs. J Electrochem Soc 151:A1094. https:// doi. org/ 10. 1149/1. 17593 7. Bauer A, Song C, Ignaszak A et al (2010) Improved stability of mesoporous carbon fuel cell catalyst 63
support through incorporation of TiO2. Electrochim Acta 55:8365–8370. https:// doi. org/ 10. 1016/j.
elect acta. 2010. 07. 025
8. Kuriganova AB, Leontyev IN, Alexandrin AS et al (2017) Electrochemically synthesized Pt/ TiO2-C catalysts for direct methanol fuel cell applications. Mendeleev Commun 27:67–69. https:// doi. org/
10. 1016/j. mencom. 2017. 01. 021
9. Odetola C, Trevani LN, Easton EB (2017) Photo enhanced methanol electrooxidation: further insights into Pt and TiO2 nanoparticle contributions. Appl Catal B Environ 210:263–275. https://
doi. org/ 10. 1016/j. apcatb. 2017. 03. 027
10. Zhang H, Han X, Zhao Y (2017) Pd-TiO2 nanoparticles supported on reduced graphene oxide:
green synthesis and improved electrocatalytic performance for methanol oxidation. J Electroanal Chem 799:84–91. https:// doi. org/ 10. 1016/j. jelec hem. 2017. 05. 026
11. Li M, Bi YG, Xiang L et al (2020) Improved cathodic oxygen reduction and bioelectricity gen- eration of electrochemical reactor based on reduced graphene oxide decorated with titanium-based composites. Bioresour Technol 296:122319. https:// doi. org/ 10. 1016/j. biort ech. 2019. 122319 12. Park C, Lee E, Lee G, Tak Y (2020) Superior durability and stability of Pt electrocatalyst on
N-doped graphene-TiO2 hybrid material for oxygen reduction reaction and polymer electrolyte membrane fuel cells. Appl Catal B Environ 268:118414. https:// doi. org/ 10. 1016/j. apcatb. 2019.
118414
13. Wang M, Wang Z, Wei L et al (2017) Catalytic performance and synthesis of a Pt/graphene-TiO2 catalyst using an environmentally friendly microwave-assisted solvothermal method. Cuihua Xue- bao/Chin J Catal 38:1680–1687. https:// doi. org/ 10. 1016/ S1872- 2067(17) 62876-6
14. Yu J, Liu Z, Zhai L et al (2016) Reduced graphene oxide supported TiO2 as high performance cata- lysts for oxygen reduction reaction. Int J Hydrogen Energy 41:3436–3445. https:// doi. org/ 10. 1016/j.
ijhyd ene. 2015. 12. 192
15. Sravani B, Chandrashekar Y, Sri Chandana P et al (2020) Bimetallic PtCu-decorated reduced graphene oxide (RGO)-TiO2 nanocomposite for efficient oxygen reduction reaction. Synth Met 266:116433. https:// doi. org/ 10. 1016/j. synth met. 2020. 116433
16. Bourikas K, Kordulis C, Lycourghiotis A (2014) Titanium dioxide (Anatase and Rutile): surface chemistry, liquid-solid interface chemistry, and scientific synthesis of supported catalysts. Chem Rev 114:9754–9823. https:// doi. org/ 10. 1021/ cr300 230q
17. Wu J, Xu M, Lei S, Jin C (2020) High electrocatalytic activity and stability of PtAg supported on rutile TiO2 for methanol oxidation. Int J Hydrogen Energy 45:12815–12821. https:// doi. org/ 10.
1016/j. ijhyd ene. 2020. 03. 015
18. El-Maghrabi HH, Nada AA, Roualdes S, Bekheet MF (2020) Design of Ni/NiO–TiO2/rGO nano- composites on carbon cloth conductors via PECVD for electrocatalytic water splitting. Int J Hydro- gen Energy 45:32000–32011. https:// doi. org/ 10. 1016/j. ijhyd ene. 2020. 08. 259
19. Szabó T, Veres Á, Cho E et al (2013) Photocatalyst separation from aqueous dispersion using gra- phene oxide/TiO2 nanocomposites. Colloids Surf A 433:230–239. https:// doi. org/ 10. 1016/j. colsu rfa.
2013. 04. 063
20. Micoud F, Maillard F, Gourgaud A, Chatenet M (2009) Unique CO-tolerance of Pt-WOx materials.
Electrochem commun 11:651–654. https:// doi. org/ 10. 1016/j. elecom. 2009. 01. 007
21. Subban C, Zhou Q, Leonard B et al (2010) Catalyst supports for polymer electrolyte fuel cells.
Philos Trans R Soc A Math Phys Eng Sci 368:3243–3253. https:// doi. org/ 10. 1098/ rsta. 2010.
22. Hu JE, Liu Z, Eichhorn BW, Jackson GS (2012) CO tolerance of nano-architectured Pt-Mo anode 0116 electrocatalysts for PEM fuel cells. Int J Hydrogen Energy 37:11268–11275. https:// doi. org/ 10.
1016/j. ijhyd ene. 2012. 04. 094
23. Pereira LGS, Paganin VA, Ticianelli EA (2009) Investigation of the CO tolerance mechanism at several Pt-based bimetallic anode electrocatalysts in a PEM fuel cell. Electrochim Acta 54:1992–
1998. https:// doi. org/ 10. 1016/j. elect acta. 2008. 07. 003
24. Micoud F, Maillard F, Bonnefont A et al (2010) The role of the support in COads monolayer electrooxidation on Pt nanoparticles: Pt/WOx vs. Pt/C. Phys Chem Chem Phys 12:1182–1193.
https:// doi. org/ 10. 1039/ b9152 44j
25. Vass BI, Pászti Z et al (2017) Effect of Mo incorporation on the electrocatalytic performance of Ti–Mo mixed oxide–carbon composite supported Pt electrocatalysts. Reac Kinet Mech Cat 121:141–160. https:// doi. org/ 10. 1007/ s11144- 017- 1155-5
26. Vass Á, Borbáth I, Bakos I et al (2019) Stability issues of CO tolerant Pt-based electrocatalysts for polymer electrolyte membrane fuel cells: comparison of Pt/Ti0.8Mo0.2O2–C with PtRu/C.
Reac Kinet Mech Cat 126:679–699. https:// doi. org/ 10. 1007/ s11144- 018- 1512-z
27. Borbáth I, Zelenka K, Vass Á et al (2021) CO tolerant Pt electrocatalysts for PEM fuel cells with enhanced stability against electrocorrosion. Int J Hydrogen Energy 46:13534–13547. https:// doi.
org/ 10. 1016/j. ijhyd ene. 2020. 08. 002
28. Borbáth I, Tálas E, Pászti Z et al (2021) Investigation of Ti-Mo mixed oxide-carbon composite supported Pt electrocatalysts: effect of the type of carbonaceous materials. Appl Catal A Gen 620:118155
29. Halder A, Zhang M, Chi Q (2016) Electrocatalytic applications of graphene-metal oxide nano- hybrid materials. In: Advanced catalytic materials - photocatalysis and other current trends. pp 379–413
30. Guo S, Dong S (2011) Graphene nanosheet: synthesis, molecular engineering, thin film, hybrids, and energy and analytical applications. Chem Soc Rev 40:2644–2672. https:// doi. org/ 10. 1039/ c0cs0 0079e
31. González VJ, Rodríguez AM, León V et al (2018) Sweet graphene: Exfoliation of graphite and preparation of glucose-graphene cocrystals through mechanochemical treatments. Green Chem 20:3581–3592. https:// doi. org/ 10. 1039/ c8gc0 1162a
32. Dan M, Vulcu A, Porav SA et al (2009) Eco-friendly nitrogen-doped graphene preparation and design for the oxygen reduction reaction. Scan Electron Microsc 26:10103–10111. https:// doi. org/
10. 3390/ molec ules2 61338 58
33. Xing T, Sunarso J, Yang W et al (2013) Ball milling: a green mechanochemical approach for synthe- sis of nitrogen doped carbon nanoparticles. Nanoscale 5:7970–7976. https:// doi. org/ 10. 1039/ c3nr0 2328a
34. Jeon IY, Choi HJ, Choi M et al (2013) Facile, scalable synthesis of edge-halogenated graphene nan- oplatelets as efficient metal-free eletrocatalysts for oxygen reduction reaction. Sci Rep 3:1–7. https://
doi. org/ 10. 1038/ srep0 1810
35. Kim WJ, Lee TJ, Han SH (2014) Multi-layer graphene/copper composites: preparation using high- ratio differential speed rolling, microstructure and mechanical properties. Carbon N Y 69:55–65.
https:// doi. org/ 10. 1016/j. carbon. 2013. 11. 058
36. Sheha E, Makled MH, Nouman WM et al (2016) Vanadium Oxide/graphene nanoplatelet as a cath- ode material for Mg-ion battery. Graphene 05:178–188. https:// doi. org/ 10. 4236/ graph ene. 2016.
54015
37. Pharkya P, Alfantazi A, Farhat Z (2005) Fabrication using high-energy ball-milling technique and characterization of Pt-Co electrocatalysts for oxygen reduction in polymer electrolyte fuel cells. J Fuel Cell Sci Technol 2:171–178. https:// doi. org/ 10. 1115/1. 18959 85
38. Eder D (2010) Carbon nanotube/inorganic hybrids for energy harvesting. Chem Rev 110:1348–
1385. https:// doi. org/ 10. 1021/ cr800 433k
39. Pawley GS (1981) Pawley 1981.Pdf. J Appl Cryst 14:357–361
40. Vass BI, Bakos I et al (2018) Novel Pt electrocatalysts: multifunctional composite supports for enhanced corrosion resistance and improved CO tolerance. Top Catal 61:1300–1312. https:// doi. org/
10. 1007/ s11244- 018- 0988-0
41. Bard AJ (1976) Electroanalytical chemistry: a series of advances, vol 9. M. Dekker, New York 42. Pantea D, Darmstadt H, Kaliaguine S, Roy C (2003) Electrical conductivity of conductive carbon
blacks: Influence of surface chemistry and topology. Appl Surf Sci 217:181–193. https:// doi. org/ 10.
1016/ S0169- 4332(03) 00550-6
43. Rouquerol F, Rouquerol J, Sing KS et al (2014) Adsorption by powders and porous solids, 2nd edn.
Academic Press, Poland
44. Zhang Z, Liu J, Gu J et al (2014) An overview of metal oxide materials as electrocatalysts and sup- ports for polymer electrolyte fuel cells. Energy Environ Sci 7:2535–2558. https:// doi. org/ 10. 1039/
c3ee4 3886d
45. Salvatore M, Carotenuto G, De Nicola S et al (2017) Synthesis and characterization of highly inter- calated graphite bisulfate. Nanoscale Res Lett 12:167. https:// doi. org/ 10. 1186/ s11671- 017- 1930-2 46. Ain QT, Haq SH, Alshammari A et al (2019) The systemic effect of PEG-nGO-induced oxida-
tive stress in vivo in a rodent model. Beilstein J Nanotechnol 10:901–911. https:// doi. org/ 10. 3762/
BJNANO. 10. 91
47. Shen TD, Ge WQ, Wang KY et al (1996) Structural disorder and phase transformation in graph- ite produced by ball milling. Nanostruct Mater 7:393–399. https:// doi. org/ 10. 1016/ 0965- 9773(96) 00010-4
48. Huang JY, Yasuda H, Mori H (1999) Highly curved carbon nanostructures produced by ball-milling.
Chem Phys Lett 303:130–134. https:// doi. org/ 10. 1016/ S0009- 2614(99) 00131-1
49. Chen Y, Gerald JF, Chadderton LT, Chaffron L (1999) Nanoporous carbon produced by ball milling.
Appl Phys Lett 74:2782–2784. https:// doi. org/ 10. 1063/1. 124012
50. Klug HP, Alexander LE (1975) X-ray diffraction procedures for polycrystalline and amorphous materials, 2nd edn. Wiley, New York
51. Muzyka R, Drewniak S, Pustelny T et al (2018) Characterization of graphite oxide and reduced graphene oxide obtained from different graphite precursors and oxidized by different methods using Raman spectroscopy. Materials (Basel) 11:15–17. https:// doi. org/ 10. 3390/ ma110 71050
52. Niwase K, Tanaka T, Kakimoto Y et al (1995) Raman Spectra of graphite and diamond mechani- cally milled with agate or stainless steel ball-mill. Mater Trans JIM 36:282–288
53. Welham NJ, Berbenni V, Chapman PG (2003) Effect of extended ball milling on graphite. J Alloys Compd 349:255–263. https:// doi. org/ 10. 1016/ S0925- 8388(02) 00880-0
54. Challagulla S, Tarafder K, Ganesan R, Roy S (2017) Structure sensitive photocatalytic reduction of nitroarenes over TiO2. Sci Rep 7:8783. https:// doi. org/ 10. 1038/ s41598- 017- 08599-2
55. Caņado LG, Takai K, Enoki T et al (2006) General equation for the determination of the crystallite size la of nanographite by Raman spectroscopy. Appl Phys Lett 88:1–4. https:// doi. org/ 10. 1063/1.
21960 57
56. Guillén-Villafuerte O, García G, Rodríguez JL et al (2013) Preliminary studies of the electrochemi- cal performance of Pt/X@MoO3/C (X = Mo2C, MoO2, Mo0) catalysts for the anode of a DMFC:
influence of the Pt loading and Mo-phase. Int J Hydrogen Energy 38:7811–7821. https:// doi. org/ 10.
1016/j. ijhyd ene. 2013. 04. 083
57. Justin P, Ranga Rao G (2011) Methanol oxidation on MoO3 promoted Pt/C electrocatalyst. Int J Hydrogen Energy 36:5875–5884. https:// doi. org/ 10. 1016/j. ijhyd ene. 2011. 01. 122