1
Synthesis and Characterization of Graphite Oxide Derived TiO2-Carbon Composites as Potential Electrocatalyst Supports
Topics in Catalysis (2021)
Ilgar Ayyubov, Irina Borbáth, Zoltán Pászti, Zoltán Sebestyén, Judith Mihály, Tamás Szabó, Erzsébet Illés, Attila Domján, Mihaela Florea, Dana Radu, Andrei Kuncser, András Tompos, Emília Tálas
DOI: https://doi.org/10.1007/s11244-021-01513-1 Source Type: Journal
Original language: English Document Type: Original Paper Publisher: Springer Nature
Corresponding authors: Mihaela Florea, Emília Tálas Accepted: 23 September 2021
Published: 05 October 2021
2
Synthesis and characterization of graphite oxide derived TiO 2 -carbon composites as potential electrocatalyst supports
Ilgar Ayyubov1, Irina Borbáth1, Zoltán Pászti1, Zoltán Sebestyén1, Judith Mihály1, Tamás Szabó2, Erzsébet Illés3, Attila Domján4, Mihaela Florea5, Dana Radu5, Andrei Kuncser5, András Tompos1,Emília Tálas1
1Research Centre for Natural Sciences, Institute of Materials and Environmental Chemistry, Eötvös Loránd Research Network (ELKH), Magyar Tudósok körútja 2, H-1117 Budapest, Hungary
2Department of Physical Chemistry and Materials Science, University of Szeged, H-6720 Szeged, Rerrich Béla tér 1, Hungary
3University of Szeged, Faculty of Engineering, Department of Food Engineering, H-6724 Szeged, Mars tér 7, Hungary
4Research Centre for Natural Sciences, Centre for Structural Science, Eötvös Loránd Research Network (ELKH), Magyar Tudósok körútja 2, H-1117 Budapest, Hungary
5National Institute of Materials Physics, 405A Atomistilor Street, 077125, Magurele, Romania
Acknowledgement
The research within project No. VEKOP-2.3.2-16-2017-00013 was supported by the European Union and the State of Hungary, co-financed by the European Regional Development Fund. Project No. NNE130004 has been implemented with the support provided from the National Research, Development and Innovation Fund of Hungary, financed under the TR-NN-17 funding scheme. Project No. NNE 131270 has been implemented with the support provided from the National Research, Development and Innovation Fund of Hungary financed under the M-ERA.NET-2018 funding scheme. The financial supports by the János Bolyai Research Scholarship of the Hungarian Academy of Sciences are gratefully acknowledged (Erzsébet Illés). The authors also thank Dr. Ágnes Szegedi and Dr. Szilvia Klébert for the nitrogen physisorption measurements, and Dr. Zoltán May for the ICP- OES measurements.
*corresponding author, Tel.:+40721760041, email: mihaela.florea@chimie.unibuc.ro
<mailto:mihaela.florea@chimie.unibuc.ro>, address: National Institute of Materials Physics, 405A Atomistilor Street, 077125, Magurele, Romania (Mihaela Florea)
3
Abstract:
TiO2-C (carbon) hybrid materials are promising electrocatalyst supports because the presence of TiO2 results in enhanced stability. Use of new types of carbonaceous materials such as reduced graphene oxide (rGO) instead of traditional active carbon provides certain benefits.
Although the rutile polymorph of TiO2 seems to have the most beneficial properties in these hybrid materials, the anatase type is more frequent in TiO2-rGO composites, especially in graphite oxide (GO) derived ones, as GO has several properties which may interfere with rutile formation. To explore and evaluate these peculiarities and their influence on the composite formation, we compared TiO2-C systems formulated with GO and Black Pearls (BP) carbon.
Various physicochemical methods, such as attenuated total reflection infrared (ATR-IR)-, solid state NMR-, Raman- and X-ray photoelectron spectroscopy, X-ray powder diffraction (XRD), electron microscopy, etc. were used to characterize the samples from the different stages of our multistep sol-gel synthesis. Our experiments demonstrated that utilization of GO is indeed feasible for composite preparation, although its sodium contamination has to be removed during the synthesis. On the other hand, high temperature treatment and/or solvothermal treatment during composite synthesis resulted in decomposition of the functional groups of the GO and the functional properties of the final product were similar in case of both composites. However, Pt/TiO2-GO derived sample showed higher oxygen reduction reaction (ORR) activity than Pt/TiO2-BP derived one. Based on the decrease of electrochemical surface area, the stability order was the following: Pt/C (commercial) < Pt/TiO2-BP derived C < Pt/TiO2-GO derived C.
Keywords: graphite oxide, reduced graphene oxide, composite material, solvothermal treatment, Pt electrocatalyst
4
1. Introduction
TiO2-C hybrid systems have already attracted considerable interest as, photoelectrocatalysts [1,2] electrocatalysts [3] and electrocatalyst supports [4-8]. Enhanced electrochemical performance in the reactions usually catalyzed by oxophilic metals, as well as improved stability of TiO2-C composite supported Pt electrocatalysts, has been described [6,9,10].
Great variety of methods producing TiO2-C hybrid systems can be found in the literature depending on the goals of the different studies; some examples are given below. In references [4,8,11] pre-prepared TiO2 was surrounded by carbon derived from high temperature carbonization of the carbon source. Another approach utilizing pre-prepared TiO2 is its connection to the carbonaceous material by use of hydrothermal /solvothermal treatment [12].
A different class of preparation techniques involve direct hydrothermal/solvothermal synthesis from various Ti- precursors such as Ti(SO4)2 [13], tetrabutyl orthotitanate [2], titanium (IV) n- butoxide [1], (NH4)2TiF6 [14] in the presence of carbonaceous material or hydrolysis of Ti precursor in the presence of carbonaceous material [15,16]. Sol-gel method from titanium tetraisopropoxide in the presence of a carbon source followed by thermal treatment is also a feasible way [17]. As a result of the different synthesis approaches, great variety of both the TiO2 and the carbonaceous phases in these hybrid materials can be found; high temperature carbonization most likely leads to rutile TiO2 phase [11], while hydrothermal synthesis results in anatase [1,2,12]. In certain cases, TiO2 can also be kept in amorphous phase [15].
Regarding the carbonaceous part, beside pre-prepared and in situ formed activated carbon, new types of carbonaceous materials such as reduced graphene oxides (rGO) are increasingly used in TiO2-C hybrid materials. Graphene derivatives provide special properties, including increased electrical and thermal conductivity, chemical and mechanical stability to inorganic oxide-carbon composites [18]. Exfoliated graphite oxide (GO) offers several advantages as carbonaceous starting material for composites; this novel material with abundant oxygen containing functional groups is relatively cheap and suitable for mass production. The GO is weakly acidic material in aqueous dispersions [19] due to its dissociable functional groups which are covalently attached to the carbon skeleton [20,21]. As a result, GO has a highly hydrophilic character compared to the parent graphite which makes its handling easier during the composite preparation unlike the hydrophobic graphene [22]. GO can be easily transformed to rGO which leads to formation of a graphene like units in the composite.
Synthesis and characterization of GO derived TiO2-carbonaceous material composites for photocatalytic purposes have been widely studied [22-26]. A large number of studies reported
5
also about the successful use of GO in TiO2-C (C: carbonaceous material) and noble metal/TiO2-C composites in various fields of electrocatalysis such as N2 reduction reaction [27], methanol oxidation [7,13,28] or oxygen reduction reaction (ORR) [12,14,17,29]. Combination of rGO with other layered inorganic materials is also useful tool; e.g. it can help to overcome the difficulties caused by the poor conductivity of layered double hydroxides (LDHs) in applications for oxygen evolution reaction (OER) [30]. An entirely different class of 2D materials is obtained if the hybrid-forming approach is taken to the extreme limit of mixing on the atomic scale: the resulting MXenes, involving Ti-carbide-based systems, seem to be interesting novel systems either as electrocatalysts themselves or as electrocatalyst supports [31,32].
In our previous studies we proposed novel, TiO2 based mixed oxide-carbon composite supported platinum electrocatalysts (Pt/Ti(1-x)MoxO2-C) for polymer electrolyte membrane fuel cells (PEMFCs). Above catalysts showed better stability and increased CO tolerance compared to the state-of-the-art PtRu/C ones [33,34]. We have developed a multistep sol-gel-based synthesis method for these supports in which first TiO2-rutile nuclei are grown on the carbon backbone at low temperature, completed by an aging step, then the Mo precursor is added and incorporated into the TiO2-rutile crystallites during a high-temperature treatment (HTT) step [33-36]. In this method the presence of rutile nuclei before HTT is an important prerequisite of the dopant incorporation into the mixed oxide phase [37].
Taking into account the proven performance of the GO-based systems in many catalytic applications and the promising behavior of the transition metal doped TiO2-C composites as electrocatalyst supports, it is tempting to consider the suitability of GO for use in TiO2-C type composites containing the rutile TiO2 phase. Indeed, it is widely believed that functional groups of the carbon backbone can anchor the oxide particles [38-40] and/or the Pt particles [41], resulting in catalysts with enhanced stability. In this sense it can be assumed that GO represents the extreme case of functionalized carbon materials for anchoring oxides[42,43] and metals [44-46]. Accordingly, the aim of the present work is to adapt our previously developed multistep sol-gel method for the preparation of rutile TiO2-GO derived C composites. Rutile phase is regarded more thermodynamically stable than other polymorphs of TiO2 [47,48].
Moreover, recent research suggests high potential of rutile TiO2 as a support material for electrocatalysts [49]. Nevertheless, two characteristic properties of GO have to be taken into account when considering the possibility of adapting GO to our previously developed composite preparation method.
6
The first one concerns the disintegration of the parallel stacked, multilayered assemblies of GO, i.e. delamination or exfoliation of the GO, which is assumed to play a key role in having the appropriate specific surface area of the composite. Different methods, such as sonication, thermal treatment, microwave treatment, etc. can be used for the exfoliation of GO [22]. As the negative charge developed on the functional groups of the GO layers in basic medium generates a repelling interaction, slightly basic conditions can also help to achieve larger degrees of dispersion [19]. However, strong acidic medium adjusted by HNO3 is necessary for the formation of the rutile phase TiO2 nuclei. A possible workaround is making a slurry of GO sonicated in a slightly alkaline medium and its vigorous mixing with the acidic colloidal TiO2
precursor solution under strict pH control, as done in our previous attempt, which resulted in successful composite preparation [36]. This composite had a specific surface area of more than 100 m2/g and the Mo incorporated mainly into the Ti(1-x)MoxO2 mixed oxide part of rutile type after the HTT [36]. However, there are several peculiarities of this approach which were not revealed yet, and GO derived TiO2-C systems seems to be good model system for this purpose.
The other property of the GO which has to be taken into account is its heat sensitivity.
This issue needs to be addressed because a HTT step cannot be avoided for the formation of rutile phase of TiO2. It is known that GO is thermally unstable; it decomposes slowly at relatively low temperatures (60-70°C) with formation of CO, CO2, H2O and turbostratic carbon.
Thermal instability of GO can be associated with the exothermic decomposition reactions of oxygen-containing groups in the basal plane and periphery of graphite layers [50]. The decomposition of GO under very slow heating can be regulated but an increased heating rate results in thermal explosion [50]. Latter phenomenon is also called as deflagration. During deflagration great amount of formed gaseous products lead to the delamination of GO particles, a sudden decrease in the oxygen content of the material, and the formation of a certain type of turbostratic carbon, a graphene-like substance with rather high specific surface area [51]. It has been also described that the oxygen-containing groups of GO are generally decomposed in three temperature regions of 170–250, 500–600, and 750–1000 °C [50]. The above carbonaceous materials of large specific surface area appear to meet the requirements of the electrocatalyst support. However, it is an open question whether this type of carbonaceous material provides extra advantages to the composite support and the Pt electrocatalyst supported on it in comparison with the composite obtained from an ordinary carbon material.
Since the main motivation behind development of oxide-carbon composite supports is to enhance the stability of the resulting catalysts, ensuring intimate contact between the oxide and the carbon is a key requirement. According to the literature, electrostatic interactions
7
between the graphitic carbon material and the metal oxide in the TiO2-GO systems can be important in this sense [25,52] but chemical bond formation between Ti-OH and functional groups of GO is also suggested [7]. Solvothermal or hydrothermal procedure used in order to connect TiO2 nanoparticles to GO sheet [53-55], results in rGO with parallel removal of the O- containing functional groups of GO [7]. This process leads to re-establishment of conjugated graphene network [56] and to the possible appearance of C-O-Ti bonds [7,54,57,58].
According to the above considerations, prior to application of GO as a source for the carbonaceous material in TiO2-C composite electrocatalyst supports, a few questions has to be clarified. One of them is the mitigation of the apparent conflict between the highly acidic milieu needed for exclusive TiO2-rutile deposition and the mildly basic environment preferred for GO delamination. The other is the relevance of the functional groups for rutile growth in the initial stage of the composite preparation and the effect of their partial or complete elimination upon high temperature treatment.
The aim of the present work is to provide insight into these carbonaceous phase related issues by comparing the structural and functional properties of TiO2-C composites prepared by multistep sol-gel method on GO-derived and carbon black materials. Our further aim is to achieve the exclusive formation of the rutile TiO2 phase in these composites, as the ultimate goal in our future work is to use these knowledge to prepare various metal (W, Mo, Sn, Nb) doped TiO2-GO derived carbon composites as potential catalyst supports for Pt electrocatalysts in PEMFCs. Apart from physico-chemical characterization of the graphite oxide-derived TiO2- C composites, their effect on the electrocatalytic properties of platinum catalyst supported on them are also studied and compared to those of carbon black derived ones.
2. Experimental 2.1. Materials
NaOH was purchased from Reanal. HNO3 (65%, a.r.) and 2-propanol were products of Molar Chemicals. Titanium-isopropoxide (Ti(O-i-Pr)4, Aldrich, 97%) was used as Ti precursor compound. Black Pearls 2000 (BP) supplied by Cabot and graphite oxide (GO) were used as carbon materials. GO was prepared from graphite by the Hummers-Offeman method. GO (I) suspension (3.2 wt.% for carbon) was purified by dialysis while GO (II) suspension (0.95 wt.%
for carbon) was used without purification. Hexachloroplatinic acid hexahydrate (H2PtCl6 × 6H2O, 37.5 % Pt, Sigma-Aldrich) was used as Pt precursor compound.
8
2.2. Preparation of composites and composite supported catalysts
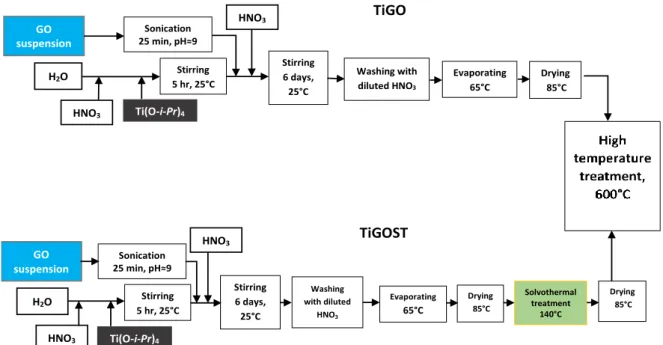
Figure 1 demonstrates the flow-charts for preparing mixed oxide-GO derived carbonaceous material composite supports by using sol–gel-based multistep synthesis routes.
Fig. 1 Flow charts for preparing TiO2-GO derived carbonaceous material composite supports by using sol–gel-based multistep synthesis routes
Typically, a transparent acidic TiO2 colloidal solution was made first by adding Ti(O-i- Pr)4 into the vigorously stirred mixture of cc. HNO3 and distilled water as described in the Supplementary Materials. The suspension with the desired amount of GO was weighted. The exfoliation of GO by use of NaOH, the mixing of the TiO2 colloidal solution with the exfoliated GO suspension, its pH control and the aging step were carried out as we described before (see Ref. [36] and Supplementary Materials). .NaNO3, formed as a byproduct of the procedure, was removed by washing in HNO3. The samples obtained in the drying step at 85 °C were visually homogeneous; no phase separation could be observed.
In case of the solvothermal treatment (ST) step, the solid sample dried at 85 °C was sonicated in 100 mL 2-propanol for a short time (5-10 min) then the slurry was placed into a glass lined autoclave. After rinsing with nitrogen the temperature inside was increased to 140- 150 °C in ~1-1.5 h and it was kept at this temperature for ~3 h on autogenic pressure. The reaction mixture was then allowed to cool, centrifuged, air-dried at RT and dried again in an oven at 85 °C overnight.
HNO3 Ti(O-i-Pr)4 4
Sonication 25 min, pH≈9
H2O Stirring
5 hr, 25°C
Stirring 6 days,
25°C
Evaporating 65°C
Drying 85°C
HNO3 0000
Ti(O-i-Pr)4
GO suspension
Sonication 25 min, pH≈9
Stirring 5 hr, 25°C
Stirring 6 days,
25°C
Evaporating 65°C
Solvothermal treatment
140°C
Drying 85°C H2O
HNO3 0000
Drying 85°C GO
suspension
HNO3 0000
Washing with diluted HNO3
Washing with diluted
HNO3
TiGO
TiGOST
9
As a final step of the synthesis of the catalyst support material, a high temperature treatment (HTT) for 8 h at 600 °C in Ar atmosphere was performed to get well crystallized rutile TiO2.
For comparison, BP derived TiO2-C samples were also prepared according to the above procedure but the second HNO3 addition step for pH setting and washing with HNO3 was omitted.
Table 1 summarizes the nominal compositions and preparation details of the various TiO2-C composites till the stage before HTT. Denominations of the samples from the different phases of the preparation are the following: the name used in Table 1 means composite support materials after drying at 85° C; ST indicates solvothermally treated sample; HT indicates high temperature heat treated sample, while Cat means the catalyst samples obtained with loading of 20 wt.% Pt on the high temperature treated composite.
Table 1. Preparation details of TiO2-C (C= BP and GO derived carbonaceous material) composites till the stage before HTT. Nominal composition: 75 wt.% TiO2-25 wt.% C.
No Type of
C
TiO2 sol Added suspension of the carbonaceous material
NaNO3
removal (washing
step) STc H2O,
ml
HNO
3a, ml
Ti prec., mlb C, g
H2O, ml
TiGO-1 GO(I) 29 1.52 1.079 0.17d (in 5.25 g ) 10 no no
TiGO-1ST GO(I) 29 1.52 1.079 0.17d (in 5.25 g ) 10 no yes
TiGO-2 GO (II) 29 1.52 1.079 0.17d (in 17.78 g ) - no no
TiGO-3 GO (II) 29 1.52 0.79 0.17d (in 17.78 g ) - yes no
TiBP BP 21 2.35 2.05 0.25 10 no no
a cc. HNO3 (65%, Molar Chemicals, a.r.);
b Ti precursor compound: Ti(O-i-Pr)4;
c ST: solvothermal treatment before HTT in 2-propanol at 140°C;
d pH adjusted to 9 with concentrated NaOH solution.
The TiO2-C support materials were loaded with 20 wt.% Pt via a modified, sodium borohydride (NaBH4) assisted ethylene-glycol (EG) reduction-precipitation method (see Figure S1 in the Supplementary Materials) in order to obtain platinum containing electrocatalyst as we described before [33].
2.3. Physicochemical characterization
X-ray powder diffraction (XRD), nitrogen physisorption measurements, X-ray photoelectron spectroscopy (XPS) measurements were carried out using the same equipment and methods as in our previous studies [36] (see in Supplementary Materials).
10
Transmission electron microscopic images were taken by a Philips CM-10 and a JEOL- 3010 transmission electron microscope with an accelerating voltage of 100 kV and 300 kV, respectively (see also in the Supplementary Materials).
Scanning electron micrographs of the samples were recorded with a scanning electron microscope Vega II LMU model from Tescan, equipped with an energy dispersive X-ray spectrometer (EDX) Bruker Quantax 200 (see details in the Supplementary Materials).
Raman spectra were obtained on a LabRAM HR Evolution spectrometer from Horiba Jobin Ivon, with a laser radiation at wavelength of 633 nm. All spectra were recorded at room temperature in the extended scan mode in the 50 and 2000 cm-1 range.
ATR-IR spectra were recorded by the means of a Varian 2000 (Scimitar Series) FT-IR spectrometer (see details in the Supplementary Materials).
Solid state NMR magic angle spinning (MAS) spectra of samples were recorded on Varian System spectrometer with a Chemagnetics 3.2 mm narrow-bore triple resonance T3 probe in double resonance mode (see details in the Supplementary Materials)..
Thermogravimetric (TG) measurement was carried out with a PerkinElmer TGS-2 thermobalance in a compressed air atmosphere. The flow rate (volumetric flow) of the gas was 140 ml/min during the test. Approx. 1 mg sample was weighed. The TG furnace heat program has heated the sample from room temperature (1-minute running time) to 900 °C at a heating speed of 5 °C/min
The Pt content of the samples was measured by inductively coupled plasma-optical emission spectrometry (ICP-OES) technique by use of a simultaneous SPECTRO GENESIS instrument with axial plasma observation. Samples were measured after microwave assisted dissolution in 1:2:6 mixtures of concentrated hydrofluoric acid: hydrochloric acid: nitric acid.
2.4. Electrochemical characterization
The details of the electrochemical characterization including the preparation of working electrode, the composition of catalyst ink and electrocatalytic measurements were described in Refs. [33,36,59] and Supplementary Materials. The measurements were done in a standard three-electrode cell using 0.5 M H2SO4 electrolyte solution. The Pt loading of the electrodes was 10 µg cm-2. Glassy carbon (surface area: 0.0707 cm2) was used as working electrode, platinum wire as counter electrode and a hydrogen electrode as reference electrode. All potentials are given on RHE scale.
Electrocatalytic performance of the 20 wt.% Pt/TiO2-C electrocatalysts was studied by cyclic voltammetry, COads-stripping voltammetry and ORR measurements done before and
11
after the 500-cycle stability test, as well as by the long-term stability test involving 10,000 polarization cycles (for details see Supplementary Materials).
Electrochemically active Pt surface area (ECSAHupd) was determined from the charge needed for oxidation of underpotentially deposited hydrogen on the platinum surface according to the traditional method (Ref. [60], Equation S1, Supplementary Materials). The stability of the catalysts was assessed by following the change of the ECSA during polarization cycles between 0.05 and 1.00 V potential limits (Equation S2, Supplementary Materials).
ORR activity of the catalyst samples in O2 saturated 0.5 M H2SO4 solution was tested by rotating disc electrode (RDE) technique (for details see Ref. [61] and Supplementary Materials).
3. Results and discussion
3.1. Effect of the high temperature heat treatment (HTT)
Our previous experience with carbon black based composites showed that HTT is essential for the formation of the rutile type of mixed oxide phase [33]. Thermal instability of pure GO was also well-known [50], however we had no information about an important issue, how the GO derived carbonaceous part in the composite changes during the HTT. It was also known from the literature that the GO served as binding site for Ti species during the hydrolysis of the Ti-precursor [62], but we had no information how this type of close contact between TiO2
and GO in the composite influences the thermal stability of the GO derived part. Removal of the functional groups of and formation of Ti-C bond during hydrothermal/solvothermal treatments [54] led us to the assumption that an rGO-like carbon material obtained by ST at about 150 °C would be relatively stable during HTT. Regarding the conditions of ST, it is worth mentioning that 2-propanol is known as agent for catalytic transfer hydrogenations [63].
Portions of sample TiGO-1 dried at 85 °C were treated in Ar at different temperatures (150 °C, 300 °C, 600 °C) for 8 h then characterized by ATR-IR spectroscopy and 13C solid state NMR. Selected samples were studied by TEM and XRD too.
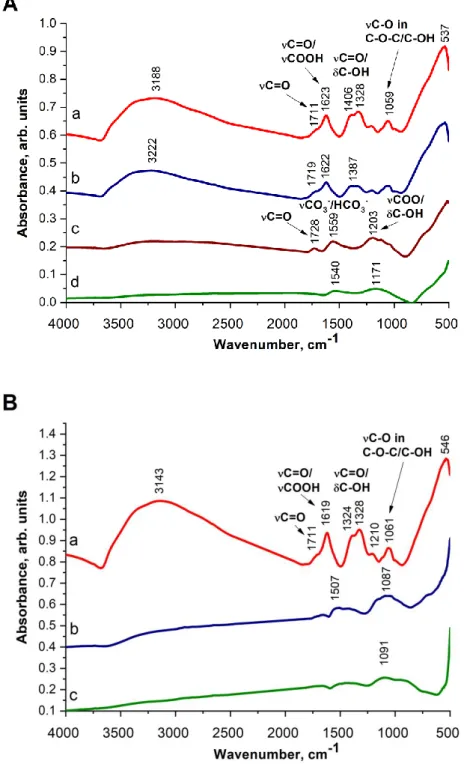
According to results of ATR-IR spectroscopic measurements signals of oxygen-bearing groups (carbonyl vibration at 1711 cm-1, carboxyl group vibrations at 1623, 1406, 1328 cm-1 and C-O-C and C-O-H stretching bands of ether and/or alcoholic groups around 1059 cm-1) appeared in the spectrum of the untreated sample (line a in Figure 2A). The band around 1623 cm-1 can be assigned to C=C bonds, too. This spectrum was very similar to that reported by Majrik et al. for 10 % GO/TiO2 sample prepared by heterocoagulation method [26]. Upon heating the sample TiGO-1 at 150 °C in Ar the characteristic features of the spectrum did not
12
change (line b in Figure 2A). After the treatment of sample TiGO-1 at 300 °C the vibrational bands characteristic for carboxyl groups and/or C=C double bond (1623, 1406 and 1328 cm-1) disappeared while a broad band attributed to surface carbonate/hydrocarbonate (1559 cm-1) appeared indicating the significant changes of the sample (line c in Figure 2A).
Fig. 2 ATR-IR spectra of TiGO-1 derived samples after various treatments. (A) annealing of TiGO-1 without solvothermal treatment. a: TiGO-1 without annealing, b: annealing at 150 °C in Ar, c: annealing at 300 °C in Ar, d: after HTT at 600 °C (TiGO-1HT).
(B) annealing of TiGO-1 after ST. a: TiGO-1 (from parallel preparation), b: TiGO-1ST, c:
solvothermally treated TiGO-1ST after HTT at 600 °C (TiGO-1STHT).
13
Further increase in the temperature of the treatment resulted in a featureless spectrum due to the significant change in the structure of the carbonaceous part with the loss of the functional groups (line d in Figure 2A). It has to be noted, however, that the background correction was problematic because this sample was too black.
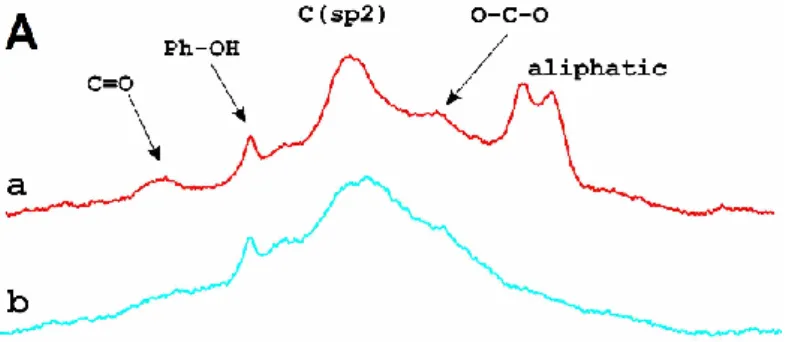
13C solid state NMR spectra of TiO2-GO derived samples can be seen in Figure 3. Line a in Figure 3A confirmed the ATR-IR results i.e. the untreated sample had several types of functional groups (carbonyl, C-OH, O-C-O) and sp2 hybridized carbon. NMR results indicated the presence of certain aliphatic carbon, too. As a result of the heat treatment in Ar at 600 °C (line b in Figure 3A) the intensity of the signals decreased except of that of the phenolic OH and the sp2 hybridized carbon which indicated again the removal of the functional groups under the HTT. However, we could not get information about a possible rupture of the GO sheets under the HTT by means of these methods.
Fig. 3 13C solid state NMR spectra of TiGO-1 derived samples after various treatments. Panel A: without and panel B: with solvothermal treatment. a: TiGO-1 without treatment, b: TiGO-1 annealed at 600°C in Ar (TiGO1-HT), c: TiGO-1 from parallel preparation, d: TiGO-1 after solvothermal treatment (TiGO-1ST), e: solvothermally treated TiGO-1ST after HTT at 600 °C (TiGO-1STHT)
14
Figure 2B shows the comparison of samples prepared with and without ST prior to HTT by use of ATR-IR spectroscopy (Figure 2B). No well-defined bands related to functional groups can be detected in the IR spectrum of the sample after the ST at 150 °C (line b in Figure 2B).
It is interesting that an almost “band-free spectrum” was obtained after annealing of the solvothermally treated sample (TiGO1-STHT, line c in Figure 2B).
Above results were consistent with those of 13C NMR measurements. By 13C NMR 2- propanol was also detected (line d in Figure 3B). It has been known that due to its layered structure and oxygen containing functional groups GO strongly intercalates H2O between its layers [64]. Obviously, during the solvothermal treatment the intercalated water more or less could be exchanged to 2-propanol. Probably, we observed its remnants after drying at 85 °C.
Decreased intensity of the carbon containing functional groups (except of phenolic OH) after the ST was in line with the picture developed in the literature [54].
The most important observation was that the 13C NMR spectra of the different samples treated at 600 °C were different (cf. line b and e in Figure 3). After HTT the sample that underwent previous solvothermal treatment appeared to be completely graphitized. Presence of this highly graphitic carbon without functional groups suggested that the structure of the carbonaceous part was closer to the rGO structure in the TiGO-1STHT sample than it was in TiGO-1HT without ST.
Both ATR-IR and 13C NMR measurements proved that the first stage of the composite production method resulted in a well-reproducible product regarding the carbonaceous part.
TiGO-1 from parallel preparations resulted in very similar patterns by ATR-IR spectroscopy (cf. line a in Figure 2A and line a in Figure 2B) as well as by 13C NMR spectroscopy (cf. line a and c in Figure 3).
The pictures showed by ATR-IR and 13C NMR spectroscopy for the same sample were slightly different which could be explained by the fact that in case of ATR techniques the penetration depth into the sample is typically between 0.5 and 2 μm while magic angle spinning (MAS) technique in solid state NMR spectroscopy provides information about the whole bulk phase.
TEM images of composites obtained with and without solvothermal treatment after annealing at 600 °C in Ar confirmed the differences in the carbonaceous part (Figure 4).
15
Fig. 4 TEM images of the TiGO-1 derived samples after various treatments.
A: TiGO-1HT; B: TiGO-1STHT. Bar: 2 m (500 nm in the inserts).
Typical low resolution image of TiGO-1HT showed that particles of micrometer size formed as a result of heat treatment (Figure 4A). The "waviness" of the particles which were visible even under the middle darkest area was clearly corresponding to the presence of the r- GO. It is even better observable in the edges/around the edges (insert of Figure 4A). TiO2
appeared mainly in the form of elongated, stick-shaped particles (Figure 4A). In addition, near the edges of the composite particle, the wrinkled (typical thermally degraded GO) carbon phase was well noticeable. The morphology of the carbon phase in case of solvothermally treated TiGO-1STHT sample (Figure 4B) differed significantly from that obtained without ST. The crystallinity of the carbon was improved, and the lamellae were less crumpled, and much more graphitic than without ST. However, much smaller amount of oxide particles seemed to be remained on the carbon lamellae, which could be consistent with the fact that the polarity of the carbon phase had been severely reduced and it might have lost most of the charge carrier groups.
SEM images (Figure S2 in the Supplementary Materials) confirm the different morphology of the samples prepared with and without ST step prior to HTT.
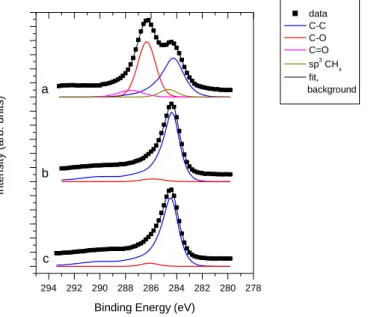
XPS investigation of composites prepared on GO confirms the above results. In Figure 5 C 1s spectra of TiGO-3HT is compared to those of a pristine GO sample and TiBPHT, a composite prepared on BP carbon material. In particular, the spectrum of the untreated GO is in good agreement with the IR and NMR results: the carbonaceous backbone which is represented by a broad graphite-like feature (peak around 284.4 eV) carries a high amount of functional groups, containing mainly C-O bonds (C-OH or C-O-C groups, contributing to the peak around 286 eV) along with a considerable amount of carbonyl-like species (around 287-
16
288 eV) [65]. A smaller peak around 285 eV can arise from aliphatic groups as indicated already by the NMR measurement.
On the other hand, the C 1s spectrum of the GO-based composite is almost identical to that of graphitic carbon. The line shape of the contribution arising from C-C bonds was measured on graphitic carbon and analysis of the spectrum of the GO-based composite indicated only a small additional C-O-like contribution. Therefore, the XPS measurement also confirmed the elimination of functional groups during composite formation and high temperature treatment. In fact, according to the XPS results, the carbonaceous material in the GO derived composite seems to be very similar to that in the BP based material.
294 292 290 288 286 284 282 280 278
b
c a
Intensity (arb. units)
Binding Energy (eV)
data C-C C-O C=O sp3 CHx fit, background
Fig. 5 C 1s spectra of a: pristine GO, b: TiO2-GO derived carbon composite after high temperature treatment (TiGO-3HT) and c: TiO2-Black Pearls composite after high temperature treatment (TiBPHT).
The XPS measurement confirmed the presence of TiO2 in both the GO derived and the BP-based composites. However, quantitative evaluation revealed only 36 wt.% oxide in the GO derived sample and 43 wt.% in the BP-based composite, instead of the nominal 75 wt.%. In our previous work with Mo containing composites a general observation was that XPS detected more carbon than the nominal carbon content; the mixed oxide/C weight ratio was about 60/40 in case of a nominally 75 wt.% mixed oxide / 25 wt.% BP material [36]. The apparent conflict between the XPS results and the nominal composition suggests that the assumption behind the quantitative XPS analysis (i.e. the homogeneous distribution of the components within the sampling depth of the method) is not valid. Indeed, if, in addition to more dispersed forms, the oxide phase contains also larger crystallites with thickness above the sampling depth (around
17
10 nm), the surface specific XPS technique underestimates the oxide content [36]. The apparent oxide content of the TiO2-C composites observed here is even smaller than that of a typical Ti0.8Mo0.2O2-C composite, which suggests that the oxide forms relatively large crystallites with incomplete coverage on the carbon backbone, regardless to the source of the carbon. Although this result is in agreement with the TEM results of Figure 4, it also means that the decomposition of the functional groups during the high temperature treatment eliminates their anchoring effect in stabilizing the dispersion of the oxide.
3.2 Formation and removal of NaNO3 during composite synthesis
Our previous works indicated that strong acidic media adjusted by HNO3 was necessary for the formation of the TiO2-rutile nuclei [36]; while media of much higher pHs (added NaOH) was useful for the delamination of GO [19]. Our working hypothesis was that addition of 5 hours aged solution of Ti(O-i-Pr)4 to delaminated GO under vigorous stirring results in exclusively rutile phase of TiO2 after the HTT. However, formation of NaNO3 was unavoidable during this procedure. Based on the literature we came to the conclusion that the presence of NaNO3 during the HTT is harmful, because itdecomposes thermally above 450 °C with oxygen formation (Equation 1) [66] leading to uncontrolled treatment conditions during the preparation; the released oxygen might burn a part of the carbonaceous material in the composite. The decomposition of NaNO2 under the further heating results in Na2O (Equation 2) [67], which can react further, but the presence of any Na compounds is supposed to be unfavorable for utilization of the aimed TiO2-C composite as an electrocatalyst support.
2NaNO3 → 2NaNO2 + O2 (Equation 1)
2NaNO2 → Na2O +NO + NO2 (Equation 2)
It has to be mentioned that NaNO3 can be present in the GO starting material, too, as the Hummers-Offeman method uses KMnO4, H2SO4 and NaNO3 for oxidation of graphite. GO can be purified from NaNO3 by dialysis however this procedure is rather time consuming, furthermore it makes the preparation of the starting material expensive. We used both cleaned (GO(I)) and uncleaned (GO(II)) starting material in our experiments.
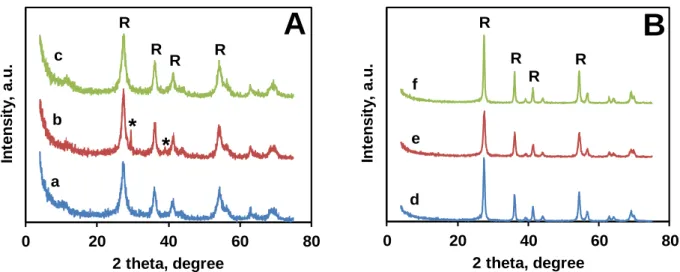
The results of XRD measurements of composites dried at 85 °C (Figure 6A) showed that the amount of crystallized NaNO3 was significant only in sample TiGO-2 obtained by use of the unpurified GO (II) suspension starting material.In case of sample TiGO-3 prepared from GO (II) an additional washing step was inserted in order to remove the NaNO3 (see Figure 1).
This step was not used in our previous work when the carbonaceous part of the composite was
18
derived from BP carbon [33]. As it can be seen in Figure 6A, NaNO3 was successfully removed by this washing procedure.
According to XRD results, samples TiGO-1HT, TiGO-2HT and TiGO-3HT which were obtained from TiGO-1, TiGO-2 and TiGO-3 by HTT contained only rutile TiO2 phase (see Figure 6B). The characteristic signal for NaNO3 at about 29° disappeared which was an indication of the thermal decomposition of NaNO3.
Fig. 6 XRD pattern of GO derived composites before (A) and after (B) HTT. a: TiGO-1, b:
TiGO-2, c: TiGO-3, d: TiGO-1HT, e: TiGO-2HT, f: TiGO-3HT. R- rutile, *-NaNO3 (R-3c, JCPDS, No. 71-1558)
Almost exclusive formation of rutile type of TiO2 after drying (Figure 6A) and after HTT (Figure 6B) also indicated that this preparation method can be effective for dopant (e.g., W, Mo, Sn or Nb) incorporation into the oxide part of the composite in our further work. In line with XRD results, TEM images of all the high temperature treated samples showed elongated and thin agglomerates (see Figure S3 in the Supplementary Materials) most probably due to the presence of TiO2-rutile. According to SEM images, the morphology of the above high temperature treated samples hardly differed (Figure S4 in the Supplementary Materials).
The effect of the presence of NaNO3 during HTT was also indicated by TG measurements. The TG and DTG curves of samples TiGO-1HT, TiGO-2HT and TiGO-3HT derived from GO were rather similar to each other, but the TiBPHT material derived from BP carbon differed slightly (Figure S5 in the Supplementary Materials). The most important features of the thermal behavior of above samples are collected in Table 2.
0 20 40 60 80
Intensity, a.u.
2 theta, degree R
R R R
*
A
*
c
b
a
0 20 40 60 80
Intensity, a.u.
2 theta, degree R
R R
R
B
f
e
d
19
Table 2. Thermal features of TiO2-carbonaceous material composites Sample Origin of
carbonaceous part
NaNO3
removal
TDTG max,
°C
Ash content at 900 °C, %
Carbonaceous part, %
TiGO-1HT GO(I) - 465 82.92 17.08
TiGO-2HT GO(II) - 400 83.71 16.29
TiGO-3HT GO(II) + 475 79.21 20.79
TiBPHT BP n.r. 555 77.35 22.65
GO (I): graphite oxide with special purification, GO (II): graphite oxide without special purification, BP: Black Pearls (Cabot), n.r.: not relevant.
The ash content means the remaining material obtained after heating the samples up to 900 °C in air. The mass loss was related to the burning of the carbonaceous part. The ash content in each sample was somewhat higher than 75 % which was expected from the nominal 75/25 ratio. The difference was the smallest in case of the BP derived sample. The ash content of the unwashed samples was 3-5 % higher than that of washed one (cf. TiGO-1HT and TiGO-2HT to TiGO-3HT in Table 2). This difference could be attributed to the fact that some of the carbon material was really burned due to O2 evolution from NaNO3 during HTT step of the composite preparation and/or the Na-containing residue increased the ash content. Comparing the ash content of sample TiGO-3HT and TiBPHT only a slight difference could be found. Perhaps the real C/H/O ratio of the GO was slightly different from that we used for the calculations of the recipe and/or the samples may have contained O and H functional groups even after HTT. The mass loss of these samples occurred in one step (see Figure S5 in the Supplementary Materials).
It is clearly visible from the data that the combustion of carbon material appeared at lower temperatures in case of GO than in case of BP (see TDTG max in Table 2). Furthermore, the presence of NaNO3 shifted the maximum of DTG curve to lower value. This finding can be explained with the catalytic effect of Na+ similarly to the observations described in the literature [68].
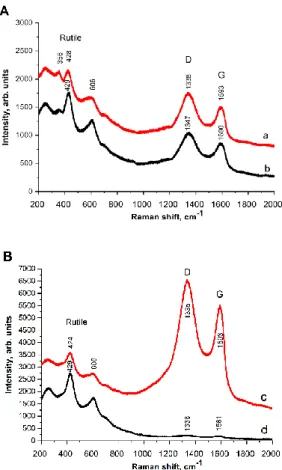
Results of Raman spectroscopic measurements (Figure 7) confirmed the almost exclusive formation of rutile TiO2 polymorph even after drying at 85 °C.
20
Fig. 7 Raman spectra of GO derived composites before (A) and after HTT (B). a: TiGO-2, b:
TiGO-3, c: TiGO-2HT, d: TiGO-3HT.
The presence of GO derived carbon in the composites has been demonstrated by the corresponding D and G bands of graphene [69]. The D band corresponds to the breakdown of translational symmetry generated by the microcrystalline structure, while the G band is assigned to the Raman-active E2g mode for the tangential in-plane stretching vibrations of the sp2- hybridized bond [70]. The ID/IG ratio is a measure of the degree of defects present in the sample and the in-plane crystalline size of the sample. The ID/IG ratio was 1.89 in case of both TiGO-2 and TiGO-3 samples reflecting the same degree of the defect of graphene sheet by use of the same starting carbonaceous material (GO(II)). The intensity ratios of bands belonging to crystalline TiO2 phase and bands belonging to the GO part was also very similar in these two composites which indicated that the Na removal did not result in significant differences in the samples dried at low temperature. However, ID/IG ratios of the samples after HTT were different, 1.27 and 2.06 for TiGO-2HT and TiGO-3HT, respectively. Furthermore, the intensity ratios of the bands characteristic for GO and the rutile TiO2 in the washed and unwashed samples differed significantly after HTT. Beside the changes in intensity ratios, the G and D position were also shifted as a result of the HTT in case of the unwashed sample. These
21
observations indicated the different amount/quality of carbonaceous part and the different degree of crystallization.
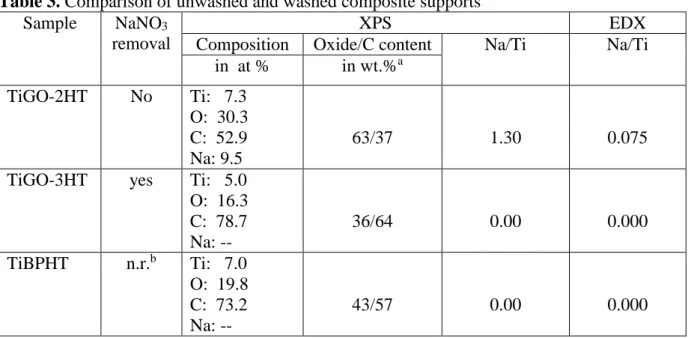
Results of XPS study of sample TiGO-2HT and TiGO-3HT along with those of the BP carbon based TiBPHT are shown in Table 3.
Table 3. Comparison of unwashed and washed composite supports Sample NaNO3
removal
XPS EDX
Composition Oxide/C content Na/Ti Na/Ti in at % in wt.%a
TiGO-2HT No Ti: 7.3 O: 30.3 C: 52.9 Na: 9.5
63/37 1.30 0.075
TiGO-3HT yes Ti: 5.0 O: 16.3 C: 78.7 Na: --
36/64 0.00 0.000
TiBPHT n.r.b Ti: 7.0 O: 19.8 C: 73.2 Na: --
43/57 0.00 0.000
anominal oxide/carbon content: 75/25 weight%;
bn.r.: not relevant.
Sodium appeared only in the TiGO-2HT sample which was obtained without nitric acid wash prior to HTT. The Na 1s peak appeared at 1072.1 eV binding energy. This value, along with the 990.4 eV kinetic energy of the Na KLL Auger line (resulting in an Auger parameter of 2062.5 eV) indicated that sodium was present in oxide form on the surface after the HTT.
Presence of Na-nitrate compounds could be ruled out as no nitrogen signal was observed in the TiGO-2HT sample. The surface carbon content of the unwashed sample was lower than that of the washed one while the surface oxygen content of the unwashed sample was higher than that of the washed one. Na/Ti ratio obtained by EDX was in line with the XPS data (Table 3). These findings were consistent with the supposed burning effect of the NaNO3 decomposition during the HTT. In conclusion, it can be stated that NaNO3 can be successfully removed with the washing step we introduced, thus replacing the long pre-purifying of GO, too.
3.3 Characterization of selected TiO2-C supports and 20 wt.% Pt/TiO2-C electrocatalysts 3.3.1 Physicochemical characterization
N2 physisorption behavior of selected supports representing both the GO derived (TiGO-3HT) and BP derived (TiBPHT) samples are shown in Figure 8 and Table S1 in the
22
Supplementary Materials. The shape of the isotherms recorded over the composite supports obtained from different types of parent carbonaceous materials differed significantly (cf. Figure 8A and 8B).
Fig. 8 Adsorption isotherm of selected TiO2-C supports A: TiGO-3HT, B: TiBPHT
Isotherms of TiGO-3HT (Figure 8A) had typical H3 type of hysteresis loop according the UPAC classification [71], which suggests the presence of aggregated flat particles and reflects the structure of the parent carbonaceous material, i.e. the graphene-oxide sheets of the delaminated GO. TiGO-1STHT (not shown) had similar pattern. Mesopores were characteristic for samples TiGO-3HT and TiGO-1STHT, the volume of micropores were almost negligible (Table S1 in the Supplementary Materials). Because of the loop type of H3 pore size distribution could not be obtained for these samples. However, the BP derived sample (TiBPHT) showed very narrow H3 type of hysteresis loop (Figure 8B) indicating that mesopores were not characteristic for this composite but certain amount of micropores were present. Pore size distribution of sample TiBPHT was given in Figure S6. According to Figure S6 the maximum pore diameter of micropores was 0.16 nm. It could also be seen that the volume of micropores (which are unfavorable) was significantly reduced by the high (~75 wt.%) oxide content
0 100 200 300 400 500 600
0.0 0.2 0.4 0.6 0.8 1.0
V ads/cm3g-1
p/p0
0 100 200 300 400 500
0.0 0.2 0.4 0.6 0.8 1.0
p/p0 Vads/cm3g-1
B
A
23
compared to the parent BP carbon. The difference of the total pore volume and micropore volume (see in Table S1) could be attributed to the macropore volume or the volume between the particles in the TiBPHT sample.
BET specific surface area (SBET) of the TiO2-C composite types of samples was significantly lower than that of the parent BP carbon (Table 4). SBET of TiBPHT and TiGO- 3HT samples was similar to each other, but that of TiGO-1STHT was much lower. Therefore, platinum was loaded only onto the former two and electrochemical characterization was made only over this two composite supported catalyst.
Table 4.Some characteristic features of selected samples. Nominal value of TiO2/C: 75/25
Sample ID Support (HT) Catalyst (Cat)
Pore volume, cm3g-1
BET surface area, m2g-1
Pt based on ICP, wt.%
TiBPHT (Cat) 0.60 a 300 18.3
TiGO-3HT (Cat) 0.69 264 18.2
TiGO-1STHT 0.46 198 -
Parent BP [72] 0.59b 1635 -
amaximum pore diameter of micropores: 0.16 nm; bmicropore volume
The introduction of Pt did not change the crystalline phase compared to the parent TiO2- C composite (cf. line f in Figure 6 and line a in Figure 9); both TiGO-3Cat and TiBPCat electrocatalysts contained rutile phase and nanodispersed Pt indicated by a broad band at 40 degree in the XRD pattern (Figure 9).
Fig. 9 XRD pattern of selected composite supported catalysts. A: TiBPCat, B: TiGO-3Cat, R:
rutile.
0 20 40 60 80
Intensity, a.u.
2 theta, degree a
b
R
R RR R Pt
24
Our previous works repeatedly demonstrated that this feature arises from well dispersed uniformly distributed Pt particles with average size around 2-3 nm [35,36,73]. Fine dispersion of Pt was mainly related to the applied modified sodium borohydride (NaBH4) assisted ethylene-glycol (EG) reduction-precipitation method and to a lesser extent depended on the structural characteristics of the support [36]. The micrograph in Figure 10 also indicates the presence of finely dispersed Pt nanopatrticles both on the surface of TiBPCat (Figure 10A) and TiGO-3Cat (Figure 10B) samples. The ICP measured Pt content (Table 4) showed good agreement with the nominal value of 20 wt.%.
Fig. 10 TEM images of selected composite supported catalysts. A: TiBPCat, B: TiGO-3Cat (bar: 200 nm)
25
3.3.2 Electrochemical characterization
The effect of the type of carbonaceous materials on the electrochemical properties of the TiBPCat and TiGO-3Cat electrocatalysts was studied by cyclic voltammetry, COads- stripping voltammetry and ORR measurements. The results obtained on fresh catalysts and after the 500 and 10,000 polarization cycles of the stability test were shown in Table 5. For comparison, the results of the study of commercial 20 wt.% Pt/C (Quintech) catalyst presented in Ref. [36] were also included.
Table 5. Electrochemical characterization of the 20 wt.% Pt/TiO2-C electrocatalysts.
Sample ECO,max,a) mV
ECSA1, m2/gPtb)
ΔECSA500,
% c)
ΔECSA10,000,
% c) TiGO-3Cat 775 (sh: 705) 82.9 6.4 34.3
TiBPCat 775 (sh: 705) 82.0 7.0 39.9
Pt/C c) 795 94.5 12.7 47.8
a) The position of the main CO stripping peak and shoulder in brackets (sh) obtained on fresh catalysts;
b) ECSA1 means ECSA determined from the first polarization cycle
b) ΔECSAN= {1-(ECSAN/ECSA1)}100% (Equation S2, Supplementary Materials);
c) From Ref. [36].
Cyclic voltammograms obtained on fresh catalysts and after 500-cycle stability test are presented on Figures 11A and 11B, respectively. Figures 11A and 11B show that the shape of the voltammograms of both TiO2-C composite supported Pt catalysts obtained before and after 500-cycle stability test was very similar: TiBPCat and TiGO-3Cat samples demonstrate a typical voltammogram characteristic for Pt in acid electrolytes. In good agreement with the literature data [74], on the voltammograms of the TiO2-containing catalysts only the classical features of the underpotentially deposited hydrogen adsorption/desorption between 50 mV and 350 mV were observed, indicating that the TiO2 was electrochemically inert.
It is necessary to mention that high oxide content in the electrocatalyst layer used in the preparation of membrane electrode assembly (MEA) can lead to an increase of the internal resistance of the cell and, as a consequence, in a decrease of the fuel cell performance [75].
Thus, Wang et al. [12] demonstrated that as a result of electronic resistance increase, the ECSA of the Pt/graphene‐TiO2 catalysts significantly decreased from 77.4 to 12.3 m2/g with increasing TiO2 content in the composite from 20 to 60 wt.%, respectively.
26
Fig. 11 Cyclic voltammograms and COads stripping voltammograms of the electrocatalysts recorded in 0.5 M H2SO4 before (A, C: solid curves) and after 500 cycles (B, D: dashed curves) of the stability test: TiBPCat (█) and TiGO-3Cat (█). Sweep rate:100 mV/s (A, B) and 10 mV/s (C, D).
As can be seen from Figures 11A and 11B, despite the presence of high content of TiO2
oxide in the TiBPCat and TiGO-3Cat catalysts (75 weight%), well-defined characteristic peaks of hydrogen adsorption/desorption on Pt was observed in the potential range between 50 <E <
350 mV. This result is quite important as low electrochemically active Pt surface area is a common problem of oxide supported electrocatalysts. We have previously demonstrated [36]
that when preparing catalysts with high surface area carbon, the carbonaceous backbone behaves like a good hard template, resulting in a uniform distribution of platinum over support even at high loading of active metal. These results suggest that catalysts with a very similar phase composition can be prepared using different carbonaceous materials and an optimized synthesis method. Moreover, these observations are in good agreement with XPS results, demonstrating that the carbonaceous material in the GO derived carbon based composite seems to be very similar to that in the BP carbon based material.
It should be noted that the literature is somewhat controversial on the question concerning to an optimal oxide/carbon ratio in the composites and stability of related electrocatalysts. Thus, upon investigation of the Pt/TiO2-C catalysts with different TiO2
loadings (10, 30 and 60 wt.%) the highest stability was obtained on the catalyst with 10 wt.%
C D
A B
27
TiO2 content [9], but in Ref. [76], taking into account activity and stability of various catalysts, 40 weight% of oxide in the composite TiO2-C support was chosen as optimal.
The electrochemically active surface area of Pt obtained on fresh catalysts was determined by charge integration under the hydrogen desorption peaks appearing between 50 mV and 350 mV according to Equation S1 (see Table 5). The ΔECSA500 and ΔECSA10,000
values calculated using the Equation S2 were also included.
The ECSAs of both TiO2-containing composite supported catalysts, normalized by the initial value, were presented in Figure 12.
Fig. 12 Electrochemical long-term stability test: comparison of the electrochemically active Pt surface area measured after N cycles normalized to ECSA measured in the 1st cycle (ECSAN/ECSA1) of the TiBPCat (█) and TiGO-3Cat (█) catalysts as a function of the number of cycles (N); results obtained in Ref. [36] on the reference 20 wt.% Pt/C catalyst (█) are given for comparison.
As can be seen from Figure 12, all catalysts exhibited some decrease of ECSA with increased cycle number. After 10,000 polarization cycles in the potential range 50 <E <
1000 mV, the TiGO-3Cat catalyst seems to be the most promising; the loss in the electrochemical surface area (ΔECSA) increased in the following order: TiGO-3Cat < TiBPCat
< Pt/C.
As shown in Table 5 the reference Pt/C catalyst showed the highest degradation after the 10,000-cycle stability test (~ 48%). However, it should be emphasized that during the CV measurements these catalysts were exposed to quite mild corrosive conditions, so the difference in the ΔECSA values of Pt/C and TiO2-containing composite supported catalysts was not so noticeable.
28
These results are in good agreement with the literature data, since it is generally accepted that under these conditions (at potentials ≤ 1.0 V), a Pt reference catalyst supported on high- surface-area carbon support usually corrodes to a rather insignificant extent [74,77,78].
It should be noted, that pronounced difference in the stability of reference Pt/C and TiO2-C composite supported Pt catalysts can be observed only under conditions, which simulates start/stop conditions in fuel cells:potential cycles between 1.0 and 1.5 V vs. RHE.
Results presented on Figure 12 obtained on the Pt/C and Pt/TiO2-C catalysts are consistent with the results obtained by Zana et al. [4] when comparing the stability of the Pt/TiO2@C, Pt/TiO2 and Pt/C catalysts under start/stop cycles and much milder load cycles conditions (cycling the potential between 0.6 and 1.0 V RHE). It has been proposed [4] that the catalyst stability under mild load cycles mainly depends on the properties of the active phase (e.g. Pt NPs), while under start/stop cycles the support properties determine the stability.
As shown in Figure 11C the character of COads stripping voltammograms of both electrocatalysts supported either on BP derived composite (TiBPCat) or GO derived one (TiGO-3Cat) were quite similar; no significantdifference in the shape of the main CO oxidation peak and the location of the maximum of this peak was observed on these catalysts.
It is well established that creating ensemble sites consisting of Pt and a second oxophilic metal, which facilitates easy oxidation of the CO contaminant via the bifunctional mechanism, is a viable method for decreasing the sensitivity of the Pt/C electrocatalysts towards CO poisoning [7,74, 79-81]. In this respect the position of the COads electrooxidation peaks can reflect the degree of the interaction between the Pt nanoparticles and oxophilic metal-containing support.
As can be seen from the results presentedin Table 5 the maximum of the main CO oxidation peak on the COads-stripping voltammogram of both fresh samples appeared at 775 mV, at a slightly less positive potential value than on that of the Pt/C (~795 mV). It is necessary to mention that besides the main COads-stripping peak, a small pre-oxidation peak (shoulder) at 705 mV was also observed on both TiO2-containing catalysts, but in the case of the TiGO-3Cat sample, this pre-oxidation peak was more pronounced.
This behavior and shape of the COads-stripping curves, demonstrating increased tolerance towards CO poisoning, are characteristic of Pt/TiO2-C electrocatalysts and have already been described in the literature as a unique Pt-TiO2-carbon three phase junction structure, which forms two types of Pt active sites: the former are associated with active OHads
on the TiO2 surface, giving a pre-oxidation peak, while the latter are associated with the surface of carbonaceous materials responsible for the appearance of the main peak [28, 82-83]. Thus,