Article
Application of TiO 2 -Cu Composites in Photocatalytic Degradation Di ff erent Pollutants and
Hydrogen Production
Boglárka Hampel1,2,3, Zsolt Pap1,4,* , Andras Sapi3 , Akos Szamosvolgyi3 , Lucian Baia4,5 and Klara Hernadi3,*
1 Institute of Environmental Science and Technology, University of Szeged, Tisza Lajos blvd. 103, HU-6720 Szeged, Hungary; hampelboglar@yahoo.com
2 Faculty of Chemistry and Chemical Engineering, Babes,-Bolyai University, Arany János str. 11, RO 400028 Cluj-Napoca, Romania
3 Department of Applied and Environmental Chemistry, University of Szeged, Rerrich Béla sqr. 1, HU-6720 Szeged, Hungary; sapia@chem.u-szeged.hu (A.S.); akos.szamosvolgyi@gmail.com (A.S.)
4 Nanostructured Materials and Bio-Nano-Interfaces Center, Institute for Interdisciplinary Research on Bio-Nano-Sciences, Babes,-Bolyai University, Treboniu Laurian str. 42, RO-400271 Cluj-Napoca, Romania;
lucian.baia@phys.ubbcluj.ro
5 Faculty of Physics, Babes,-Bolyai University, Mihail Kogălniceanu str. 1, RO-400084 Cluj–Napoca, Romania
* Correspondence: pzsolt@chem.u-szeged.hu (Z.P.); hernadi@chem.u-szeged.hu (K.H.)
Received: 18 November 2019; Accepted: 27 December 2019; Published: 7 January 2020 Abstract: In the present work, copper nanoparticles were deposited onto the surface of two different commercial titanias (Evonik Aeroxide P25 and Aldrich anatase). During the synthesis, the concentration of copper was systematically varied (0.5%, 1.0%, 1.5%, 5.0%, and 10 wt.%) to optimize the composite-composition. The photocatalytic activity was evaluated under UV-light, using methyl orange and Rhodamine B as model and ketoprofen as real pollutant. For the hydrogen production capacity, oxalic acid was used as the sacrificial agent. The morpho-structural properties were investigated by using XRD (X-ray diffraction), TEM (Transmission Electron Microscopy) DRS (Diffuse Reflectance Spectroscopy), XPS (X-ray Photoelectron Spectroscopy), and SEM-EDX methods (Scanning Electron Microscopy-Energy Dispersive X-ray Analysis). Increasing the copper concentration enhanced the photocatalytic activity for methyl orange degradation in the case of Aldrich anatase-based composites. When the P25-based composites were considered, there was no correlation between the Cu concentration and the activity; but, independently of the base photocatalyst, the composites containing 10% Cu were the best performing materials. Contrarily, for the ketoprofen degradation, increasing the copper concentration deteriorated the photoactivity. For both Aldrich anatase and P25, the best photocatalytic activity was shown by the composites containing 0.5% Cu.
For the degradation of Rhodamine B solution, 1.5% of copper nanoparticles was the most suitable.
When the hydrogen production capacity was evaluated, the P25-based composites showed higher performance (produced more hydrogen) than the Aldrich anatase-based ones. It was found that Cu was present in four different forms, including belloite (Cu(OH)Cl), metallic Cu, and presumably amorphous Cu(I)- and Cu(II)-based compounds, which were easily convertible among themselves during the photocatalytic processes.
Keywords: titania; copper nanoparticles; composites; photocatalysis; hydrogen production
Catalysts2020,10, 85; doi:10.3390/catal10010085 www.mdpi.com/journal/catalysts
Catalysts2020,10, 85 2 of 19
1. Introduction
It is a known fact that, without water, there is no life because this is the compound that is most common on Earth. Seventy-one percent of our planet is covered by water, of which 2.5% is fresh water, and the rest is saltwater (seas, oceans), while the human body contains approximately 60% of water. Another sad fact is that the amount of potable water of the Earth is dropping drastically and is becoming more and more contaminated. A large number of pesticides, detergents, phenols, petroleum, and petroleum derivatives, etc., can be found in our environment, causing great damage [1].
Besides traditional physical, chemical, and biological wastewater treatment technologies, various alternative methods have been developed for water purification, and this circle is expanding. This includes high-efficiency oxidation procedures, whereby undesirable substances are initiated by photolysis or chemically generated radicals (•OH radical). In practice, the most common methods are ozone-based, hydrogen peroxide-based (Foto-Fenton reaction: light+Fe2++hydrogen peroxide), and heterogeneous photocatalytic methods [2].
A high number of semiconductor photocatalysts are known, including ZnO [3], WO3[4], SnO2[5], CuO [6,7], etc. Titanium dioxide is the most widely and most commonly used photoactive material since it is not considered toxic for the environment, it is chemically inert, has good photocatalytic properties, and can be purchased at a low price [8]. Among the titanium dioxides, the crystalline anatase or the anatase-rutile mixtures (Evonik Aeroxide P25,≈89:11 anatase: rutile ratio) are frequently applied in water purification processes, thanks to their high efficiency [9].
It is well-known that the photocatalytic activity of titanium dioxide can be significantly increased by reducing different metals/noble metals on its surface. Several examples have been found in the literature, and researchers have so far included Au [10], Ag [11], Pt [12], Cu [13,14], and Pd nanoparticles [15] on the surface of these semiconductors. Among the above listed metals, Cu is the cheapest, which is why many experiments were carried out with it, including this research, wherein we chose copper nanoparticles, as well.
Copper nanoparticles possess many intriguing properties which provide them many applications, such as antibacterial, antifungal, and antiviral applications [16–18]. A great deal of work can be found concerning the application of copper nanoparticles in electrochemistry [19,20] and electroanalysis [21].
Interesting applications, such as the enhancement of thermal conductivity of ethylene glycol, can also be found [22].
Among the publications, several show the application of copper nanoparticles in the field of catalysis [23–25].
Forming composites with TiO2, Cu nanoparticles proved to be good as photocatalysts, too. Many publications can be found on the deposition of Cu nanoparticles on TiO2. It was shown that depositing 1–10% Cu on titania issued in beneficial effect on the decomposition of acetic acid into biogas and hydrogen [26], on the degradation of methyl orange [27], CO2photoreduction [28], aqueous hexavalent chromium [29], or humic acid degradation [30]. In another study, 2.5 wt.% Cu doped TiO2composites showed a higher reaction ability than P25 [31]. Researchers proved that, if copper nanoparticles are present in a higher amount, CuO crystallization can take place [32]. An interesting finding is that the combination of photocatalysis and adsorption can accomplish deep desulfurization [33].
Another very important feature of photocatalysts is that, if there is noble metal/metal nanoparticle next to the semiconductor, they can produce hydrogen if an adequate sacrificial agent is present [34].
According to the literature, titanium dioxide modified with copper nanoparticles also has hydrogen-generating ability. So far, hydrogen was produced so far from an aqueous solution of ethanol and glycerol [35], from a methanol and water mixture [36], or from a glycerol and water mixture [37].
Most of the publications on photocatalysis are about model pollutants. Many articles present the photocatalytic degradation of phenol, methanol, oxalic acid, methyl orange, methylene blue, Rhodamine B, etc. [5,10,38]. However, there is a lack of testing of actual contaminants for Cu containing photocatalysts. Among the investigated real pollutants, ketoprofene is widely studied. Mostly TiO2-based catalysts were tested for this purpose using different light sources: UVC irradiation [39],
UV and UV-Vis illumination [40], combined non-thermal plasma and UV light [41], or NUV-Vis irradiation [42].
Due to their lower price and interesting properties, Cu deposited TiO2photocatalysts were obtained.
To test their photocatalytic activity, three contaminants were selected: ketoprofen (contaminant of emerging concern—CEC), methyl orange, and Rhodamine B (model pollutant), while their H2
production capacity was also evaluated.
2. Materials and Methods
2.1. Materials
During the experiments, the following materials were used without further purification:
• two commercial titanium dioxides: Evonik Aeroxide P25 (89% anatase and 11% rutile photocatalyst—abbreviated as P25) and Aldrich anatase (AA);
• copper precursor: CuCl2; (0.3 mol L−1solution);
• for stabilizing the particle size of copper: trisodium citrate (Na3C3H5O(COO)3, Alfa-Aesar, 0.63×10⁻⁴mol L−1);
• for reducing copper nanoparticles: sodium borohydride (NaBH4, Merck, 0.15 mol L−1as a 4◦C solution);
• for the study of hydrogen-producing ability: crystalline oxalic acid (C2H2O4, 50 mmol L−1solution);
• for the investigation of photocatalytic activity, methyl orange (125 µmol L−1 solution) and ketoprofen (C7H6O3in 0.5 mmol L−1solution);
• distilled water to prepare the above-mentioned solutions.
2.2. Synthesis of the Composites
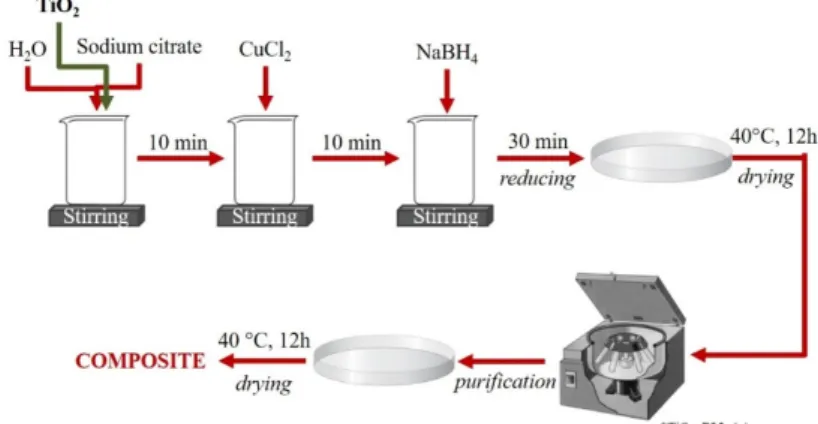
The steps taken during the synthesis of the composites are illustrated in Figure1. All composites were prepared at room temperature, continuously stirred, and by using the in situ approach:
The synthesis started by preparing a titania (800 mg) suspension in 150 mL distilled water. Three and three-tenths milliliters of trisodium citrate (0.63×10⁻⁴mol L−1) was added to the suspension to control the particle size of copper nanoparticles, and this was stirred for 10 min. Cu nanoparticles were obtained by chemical reduction from 4.2 mL CuCl2(0.3 mol L−1), which was stirred another 10 min;
after this, 1.68 mL of sodium borohydride solution was used (0.15 mol L−1). The resulting suspension was stirred 30 min (containing TiO2and copper nanoparticles), then dried, washed (3×15 min with 45 mL Milli-Q water at 6000 rpm), and finally dried again to obtain powdered samples. These synthesis parameters obtained a composite with a composition of 99 wt.% TiO2and 1 wt.% Cu.
Catalysts 2020, 10, x FOR PEER REVIEW 3 of 20
containing photocatalysts. Among the investigated real pollutants, ketoprofene is widely studied.
Mostly TiO2-based catalysts were tested for this purpose using different light sources: UVC irradiation [39], UV and UV-Vis illumination [40], combined non-thermal plasma and UV light [41], or NUV-Vis irradiation [42].
Due to their lower price and interesting properties, Cu deposited TiO2 photocatalysts were obtained. To test their photocatalytic activity, three contaminants were selected: ketoprofen (contaminant of emerging concern—CEC), methyl orange, and Rhodamine B (model pollutant), while their H2 production capacity was also evaluated.
2. Materials and Methods
2.1. Materials
During the experiments, the following materials were used without further purification:
• two commercial titanium dioxides: Evonik Aeroxide P25 (89% anatase and 11% rutile photocatalyst—abbreviated as P25) and Aldrich anatase (AA);
• copper precursor: CuCl2; (0.3 mol L−1 solution);
• for stabilizing the particle size of copper: trisodium citrate (Na3C3H5O(COO)3, Alfa-Aesar, 0.63 × 10⁻⁴ mol L−1);
• for reducing copper nanoparticles: sodium borohydride (NaBH4, Merck, 0.15 mol L−1 as a 4 °C solution);
• for the study of hydrogen-producing ability: crystalline oxalic acid (C2H2O4, 50 mmol L−1 solution);
• for the investigation of photocatalytic activity, methyl orange (125 µmol L−1 solution) and ketoprofen (C7H6O3 in 0.5 mmol L−1 solution);
• distilled water to prepare the above-mentioned solutions.
2.2. Synthesis of the Composites
The steps taken during the synthesis of the composites are illustrated in Figure 1. All composites were prepared at room temperature, continuously stirred, and by using the in situ approach: The synthesis started by preparing a titania (800 mg) suspension in 150 mL distilled water. Three and three-tenths milliliters of trisodium citrate (0.63 × 10⁻⁴ mol L−1) was added to the suspension to control the particle size of copper nanoparticles, and this was stirred for 10 min. Cu nanoparticles were obtained by chemical reduction from 4.2 mL CuCl2 (0.3 mol L−1), which was stirred another 10 min;
after this, 1.68 mL of sodium borohydride solution was used (0.15 mol L−1). The resulting suspension was stirred 30 min (containing TiO2 and copper nanoparticles), then dried, washed (3 × 15 min with 45 mL Milli-Q water at 6000 rpm), and finally dried again to obtain powdered samples. These synthesis parameters obtained a composite with a composition of 99 wt.% TiO2 and 1 wt.% Cu.
Figure 1.The main steps of the synthesis of the composites containing TiO2and Cu nanoparticles—the nanoparticles were obtained from CuCl2 by chemical reduction with NaBH4, and the TiO2 was purchased commercially (AA and P25).
Catalysts2020,10, 85 4 of 19
In order to investigate the effect of the Cu nanoparticles on the commercial titania, the mass content of copper was varied; therefore, five different samples were prepared for both base catalysts, with: 0.5%, 1%, 1.5%, 5%, and 10% copper.
The nomenclature of the samples was hereby defined: the abbreviation of the base catalyst (P25 or AA)+the number of the percentage of the copper nanoparticles+Cu. For example: P25-0.5Cu is when P25 was the base catalyst and 0.5% Cu was reduced on it, or AA-1Cu is when AA was the base and 1% Cu was used.
2.3. Characterization Methods and Instrumentation
Using transmission electron microscopy (TEM), the detection of morphological properties was implemented. The initial morphological characterization of the composites was carried out with a FEI Tecnai F20 electron microscope (Hillsboro, Oregon, USA) equipped with an Eagle 4k CCD camera with a 200 kV acceleration voltage.
Energy dispersive X-ray spectroscopy (EDX) was used to verify the composite compositions and to calculate the real copper content. Samples were analyzed using a Hitachi S-4700 Type II Cold Cathode Field Scanning Electron Microscope (Schaumburg, Illinois, USA). For an energy dispersive X-ray spectrometer, a RÖNTEC XFLASH detector was mounted on the microscope and a 20 kV acceleration voltage was used.
X-ray diffraction (XRD) was used for the characterization of the crystalline materials. Powder X-ray can be used to determine the crystalline structure of the material and to distinguish different crystal phases; their proportion (by using the integrated area values of the most intensive diffraction peak of a given phase) can be calculated, and the mean size of the crystallites can be estimated using the Scherrer equation [43]. To perform the measurements, a Rigaku Miniflex II diffractometer (Tokyo, Japan) was used, with Cu-Kαradiation (λ=1.5406 Å) equipped with a graphite monochromator.
In the case of diffuse reflection spectroscopy (DRS), the light absorption properties of a solid sample was measured. The spectra of the samples (λ=300–800 nm) were registered by using JASCO-V650 spectrophotometer (Wien, Austria) with an integration sphere (ILV-724). The indirect band gap of the photocatalysts was determined via the Kubelka-Munk method [44].
Kratos XSAM800 instrument (Manchester, UK) was used to measure the XPS spectra, which was equipped with non-monochromated Mg anode as an X-ray source operated at 144 W (12 kV, 12 mA).
The survey spectra was recorded with 80 eV pass energy and 1 eV step size. High resolution Cu2p spectra was recorded with 40 eV pass energy, 0.1 eV step size. All high-resolution spectra were charge corrected to the aliphatic component (284.8 eV) of the C1s region. No smoothing nor other signal processing was used. Peaks were fitted using a linear background and Gauss-Lorentzian (70–30%) peak shapes.
2.4. Determination of Photocatalytic Activity
2.4.1. Methyl Orange Degradation
During the photocatalytic experiments, the concentration of the suspension was 1 g L−1. The 125µM methyl orange solution was always freshly prepared. This suspension was placed into a double-walled, Pyrex glass reactor, which was situated 10 cm from the lamps. After the equilibrium experiments:
10 min of ultrasonic bath and 20 min of stirring in the dark; the course of the measurement was as follows: 1.5–2 mL sample was taken every 10 min in the first hour and in every 20 min in the second hour.
Continuous air bubbling, stirring, and thermostating (25◦C) were assured during the measurements.
The irradiation was with 6×6 W fluorescence UV-A lamp (Lightech, Dunakeszi, Hungary) with 365 nm emission maximum. To remove the catalyst particles, centrifugation was performed (13,000 rpm min−1).
To evaluate the degradation progress of a specific pollutant, UV-Vis measurements were performed using a JASCO-V650 spectrophotometer, using distilled water as a reference. Applying the pre-prepared calibration curve for the solution of methyl range (calibration range 0–200µM, 10 points, R2=0.9974),
the actual concentration was determined at 513 nm. In the evaluation of the rate constants, a pseudo-first order kinetics was considered, as is usual for photocatalytic reactions. Therefore, the integrated form of the first order reaction rate equation was used, followed by the graphical representation of ln(C0/C).
From the slope of the curve, the rate constant was determined.
2.4.2. Ketoprofen Degradation
For these experiments, 1 g L−1suspension was prepared from 50 mg photocatalyst with 50 mL 10−4 M ketoprofen solution. Prior to the degradation process, the suspension was homogenized using ultrasonication, which was followed by stirring in the dark for 15 min to achieve the adsorption-desorption equilibrium. The measurement lasted 2 h, and the irradiation of the suspension was with UV light (2×40 W lamps,λmax=365 nm) under continuous stirring. One and five-tenths to two milliliter samples were taken four times, at 30, 60, 90, and 120 min. To remove the catalyst particles, the samples were centrifuged (13,000 rpm min−1). High Performance Liquid Chromatography (HPLC) was used for the analysis of the liquid samples collected during the photodegradation tests. Agilent 1100 type of HPLC equipment with a diode array UV detector was used. The separation of the degradation products and the micropollutant was performed on a reversed phase LiChroCART®125-4, RP-18 (5µm) column. A 50–50% mixture of acetonitrile and 1% acetic acid was used as eluent, while its flow rate was 0.8 mL min−1, and the detection wavelength was set to 256 nm.
2.4.3. Rhodamine B Degradation
Photocatalytic activities of the composites were also determined by the decomposition of Rhodamine B solution. UV light (λmax =365 nm) was used for irradiation. Rhodamine B stock solution (10µmol·L−1) was prepared, and then a 1 g·L−1suspension was made. An ultrasonic bath was used to distribute the catalyst more efficiently, then stirred for 15 min in the dark for adsorption to occur, and finally placed under the lamp with continuous stirring. Two milliliter samples were taken every 10 min in the first hour of the experiment and every 20 min in the second hour. After the centrifugation (3 min, 13,800 rpm) and filtration (with a Whatman Anotop 25 0.02µm syringe filter) of the samples, the residual Rhodamine B concentration was measured. UV-Vis measurements were performed using a JASCO-V650 spectrophotometer, with the use of distilled water as a reference.
Applying the pre-prepared calibration curve (calibration range 0–25µM, 10 points, R2=0.9913) for the solution of Rhodamine B, the actual concentration was determined at 553 nm.
2.5. Determination of Photocatalytic Hydrogen Production Capacity
The hydrogen-generating capacity of the composite photocatalysts was also measured in the presence of a UV light (10×15 W lamps,λmax=365 nm) using a mixture of oxalic acid (50 mM) and suspended composite (1 g L−1suspension concentration). With continuous stirring, nitrogen flow was provided, the role of which was to provide an oxygen-free conditions. Distilled water was circulated in the reactor mantle that was connected to a thermostat so that the temperature was 25◦C during the experiment. The duration of the measurement was also 2 h, like the photocatalytic activity measurements, and the hydrogen evolution rate (mmol min−1) was measured by a gas chromatograph (GC) attached to the reactor.
GC were performed using a Hewlett Packard 5890 gas chromatograph. As a carrier gas, N2was used with a flow rate of 50 cm3min−1. The column was loaded type (5 Å molecular filter). The used GC had a thermal conductivity detector in which a sensor was located in a small volume cell.
3. Results and Discussion
3.1. X-ray Diffraction
From X-ray diffraction measurements, the mean primary crystal size of TiO2was calculated, and its crystal structure was also determined. The particle size of P25 (anatase and rutile crystals),
Catalysts2020,10, 85 6 of 19
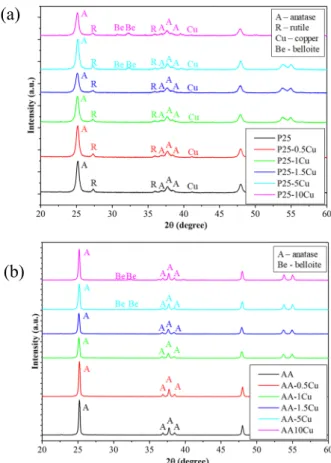
regardless of the presence of copper, is 25–40 nm, of AA is ~80 nm. The crystal phase composition, which is known from the factory data, of P25 is 11 wt.% rutile and 89 wt.% anatase (for total titanium dioxide content), and of AA is 100% anatase, as evidenced by X-ray diffractograms. The presence of copper nanoparticles did not affect the particle size and crystal structure of the TiO2, which were calculated with the Scherrer-equation. Cu was detected (COD 00-901-3022, Figure2a) at 41.2 (2θ◦), which is the most intense diffraction peak of Cu and can be attributed to the (111) crystallographic plane, while at higher Cu content (starting from 5% of Cu addition), the presence of belloite—Cu(OH)Cl (COD 00-900-9151) was also identified, along with Cu, at 30.7 (2θ◦), 32.2 (2θ◦). At first sight, the latter diffraction peak seems to be a double one but has the same full width at half maximum (FWHM) value as the peak located at 30.7 (2θ◦), pointing out that in fact it is a simple standalone reflection (Figure2).
Catalysts 2020, 10, x FOR PEER REVIEW 6 of 20
3. Results and Discussion
3.1. X-Ray Diffraction
From X-ray diffraction measurements, the mean primary crystal size of TiO2 was calculated, and its crystal structure was also determined. The particle size of P25 (anatase and rutile crystals), regardless of the presence of copper, is 25–40 nm, of AA is ~80 nm. The crystal phase composition, which is known from the factory data, of P25 is 11 wt.% rutile and 89 wt.% anatase (for total titanium dioxide content), and of AA is 100% anatase, as evidenced by X-ray diffractograms. The presence of copper nanoparticles did not affect the particle size and crystal structure of the TiO2, which were calculated with the Scherrer-equation. Cu was detected (COD 00-901-3022, Figure 2a) at 41.2 (2θ°), which is the most intense diffraction peak of Cu and can be attributed to the (111) crystallographic plane, while at higher Cu content (starting from 5% of Cu addition), the presence of belloite—
Cu(OH)Cl (COD 00-900-9151) was also identified, along with Cu, at 30.7 (2θ°), 32.2 (2θ°). At first sight, the latter diffraction peak seems to be a double one but has the same full width at half maximum (FWHM) value as the peak located at 30.7 (2θ°), pointing out that in fact it is a simple standalone reflection (Figure 2).
In the case of P25-based samples, the Cu content was a relatively constant 0.5–1.9 wt.%, while starting from sample P25-5Cu, a substantial amount of belloite appeared, as well, in 2.5 (P25-5Cu) and 7.5 wt.% (P25-10Cu), respectively. The appearance of Cu(OH)Cl is not surprising, as CuCl2 was used a precursor, and Cu nanoparticles are small-sized during the synthesis and tend to hydroxylate.
A similar phenomenon was observed in our recent work, as well [45]. Cu nanoparticles tend to agglomerate as soon as they are formed, and this was also observed here, obtaining ~50–60 nm particle sized Cu (samples P25-0.5Cu and P25-1Cu), while for the sample and P25-1.5Cu, an even higher aggregation degree was observed. This achieved an invalid value of <75 nm, suggesting a recrystallization phenomenon, which indeed took place at higher copper content, when belloite was formed, which showed a 35.2 nm mean primary crystallite size in both samples (P25-5Cu and P25- 10Cu), while the Cu nanoparticles remained at the <75 nm value. In the case of the AA-based samples, Cu was not identifiable since they are most probably non-crystalline, although their presence was proven by other methods (e.g., EDX). However, the Cu(OH)Cl phase was noticed as starting from the sample AA-5Cu in 3.2 wt.%, while in sample AA-10Cu, this value was 3.8 wt.%. The primary mean crystallite size was 34.8 nm in both samples. The case of AA-based samples demonstrates that the total amount of Cu was not anchored after the chemical reduction process.
(a)
Catalysts 2020, 10, x FOR PEER REVIEW 7 of 20
Figure 2. X-ray diffraction (XRD) patterns of the composites. (a) Evonik Aeroxide P25 (89% anatase and 11% rutile photocatalyst (P25). (b) Aldrich anatase (AA)-based. New reflections were detectable between 30–35 (2θ°) when 10% copper is present, pointing out the presence of belloite.
3.2. Transmission Electron Microscopy
To verify the presence of Cu nanoparticles, transmission electron microscopy was used. Figure S1 shows two TEM micrographs of P25-10 Cu composite, in which darker spots may indicate copper nanoparticles. The copper nanoparticles were 1–2 nm in size, while P25 (containing both anatase and rutile nanocrystals) were about 20–40 nm [46]. TiO2 nanocrystals did not show any specific shape, and spherical and polyhedral particles were both found. The copper nanoparticles also did not have any specific shape; rather, they are spherical and randomly located on the surface of the TiO2 crystals.
To ascertain the presence of Cu nanoparticles, more precise approaches were needed.
3.3. Energy-Dispersive X-Ray Spectroscopy (EDX)
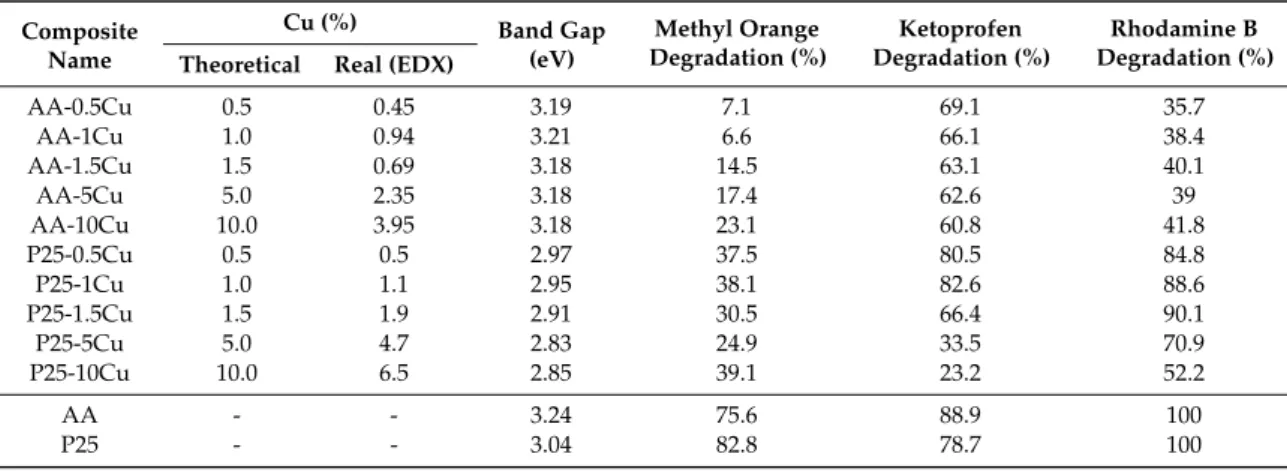
EDX was performed to confirm the elemental composition of the composites. The results show that copper is present with TiO2, so the synthesis was successful. This can also be clearly seen in Figure 3. Furthermore, for AA-based composites, interesting results were observed, which are summarized in Table 1, together with the results for the P25-based composites. It was noticed that, as the theoretical copper content increases, the difference between the theoretical and real content increases. Especially in the case of the catalysts containing 5% and 10% Cu, significant differences can be observed. This phenomenon can be explained in several ways: The copper nanoparticles did not adhere onto the surface, or partial transformation to other compounds (which may be soluble in water) can be also presumed. In such a way, it is possible that, in the composites, which contained a higher amount of copper, copper converted to copper oxides or other insoluble compounds, such as belloite, which was detected by XRD. Interestingly, the copper content was the same as the theoretical ones in the case of the P25-based composites, with major differences being observed just for sample P25-10Cu. The results obtained by EDX correlate perfectly with the observations in the section in which the XRD patterns of the samples were investigated.
Figure 3. Element mapping of P25-5Cu composite.
(b)
Figure 2.X-ray diffraction (XRD) patterns of the composites. (a) Evonik Aeroxide P25 (89% anatase and 11% rutile photocatalyst (P25). (b) Aldrich anatase (AA)-based. New reflections were detectable between 30–35 (2θ◦) when 10% copper is present, pointing out the presence of belloite.
In the case of P25-based samples, the Cu content was a relatively constant 0.5–1.9 wt.%, while starting from sample P25-5Cu, a substantial amount of belloite appeared, as well, in 2.5 (P25-5Cu) and 7.5 wt.% (P25-10Cu), respectively. The appearance of Cu(OH)Cl is not surprising, as CuCl2was used a precursor, and Cu nanoparticles are small-sized during the synthesis and tend to hydroxylate.
A similar phenomenon was observed in our recent work, as well [45]. Cu nanoparticles tend to agglomerate as soon as they are formed, and this was also observed here, obtaining ~50–60 nm particle sized Cu (samples P25-0.5Cu and P25-1Cu), while for the sample and P25-1.5Cu, an even higher aggregation degree was observed. This achieved an invalid value of<75 nm, suggesting a recrystallization phenomenon, which indeed took place at higher copper content, when belloite was formed, which showed a 35.2 nm mean primary crystallite size in both samples (P25-5Cu and P25-10Cu), while the Cu nanoparticles remained at the<75 nm value. In the case of the AA-based samples, Cu was not identifiable since they are most probably non-crystalline, although their presence
was proven by other methods (e.g., EDX). However, the Cu(OH)Cl phase was noticed as starting from the sample AA-5Cu in 3.2 wt.%, while in sample AA-10Cu, this value was 3.8 wt.%. The primary mean crystallite size was 34.8 nm in both samples. The case of AA-based samples demonstrates that the total amount of Cu was not anchored after the chemical reduction process.
3.2. Transmission Electron Microscopy
To verify the presence of Cu nanoparticles, transmission electron microscopy was used. Figure S1 shows two TEM micrographs of P25-10 Cu composite, in which darker spots may indicate copper nanoparticles. The copper nanoparticles were 1–2 nm in size, while P25 (containing both anatase and rutile nanocrystals) were about 20–40 nm [46]. TiO2nanocrystals did not show any specific shape, and spherical and polyhedral particles were both found. The copper nanoparticles also did not have any specific shape; rather, they are spherical and randomly located on the surface of the TiO2crystals.
To ascertain the presence of Cu nanoparticles, more precise approaches were needed.
3.3. Energy-Dispersive X-Ray Spectroscopy (EDX)
EDX was performed to confirm the elemental composition of the composites. The results show that copper is present with TiO2, so the synthesis was successful. This can also be clearly seen in Figure3.
Furthermore, for AA-based composites, interesting results were observed, which are summarized in Table1, together with the results for the P25-based composites. It was noticed that, as the theoretical copper content increases, the difference between the theoretical and real content increases. Especially in the case of the catalysts containing 5% and 10% Cu, significant differences can be observed. This phenomenon can be explained in several ways: The copper nanoparticles did not adhere onto the surface, or partial transformation to other compounds (which may be soluble in water) can be also presumed. In such a way, it is possible that, in the composites, which contained a higher amount of copper, copper converted to copper oxides or other insoluble compounds, such as belloite, which was detected by XRD. Interestingly, the copper content was the same as the theoretical ones in the case of the P25-based composites, with major differences being observed just for sample P25-10Cu. The results obtained by EDX correlate perfectly with the observations in the section in which the XRD patterns of the samples were investigated.
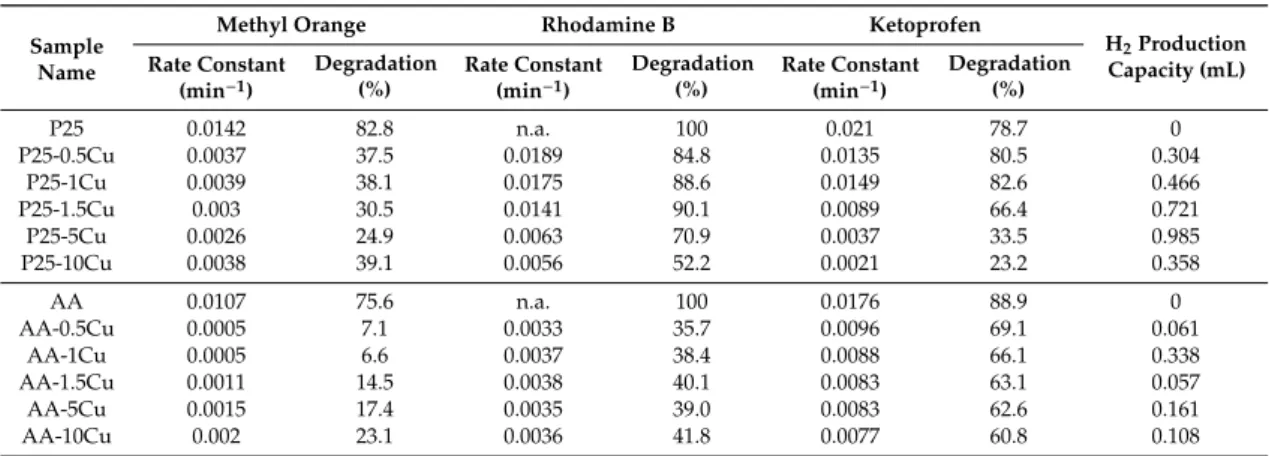
Table 1.The theoretical and real content of Cu in the composites, and the band gap energies and the degradation efficiencies (for methyl orange and ketoprofen) of the composites. EDX=energy-dispersive X-ray spectroscopy.
Composite Name
Cu (%) Band Gap
(eV)
Methyl Orange Degradation (%)
Ketoprofen Degradation (%)
Rhodamine B Degradation (%) Theoretical Real (EDX)
AA-0.5Cu 0.5 0.45 3.19 7.1 69.1 35.7
AA-1Cu 1.0 0.94 3.21 6.6 66.1 38.4
AA-1.5Cu 1.5 0.69 3.18 14.5 63.1 40.1
AA-5Cu 5.0 2.35 3.18 17.4 62.6 39
AA-10Cu 10.0 3.95 3.18 23.1 60.8 41.8
P25-0.5Cu 0.5 0.5 2.97 37.5 80.5 84.8
P25-1Cu 1.0 1.1 2.95 38.1 82.6 88.6
P25-1.5Cu 1.5 1.9 2.91 30.5 66.4 90.1
P25-5Cu 5.0 4.7 2.83 24.9 33.5 70.9
P25-10Cu 10.0 6.5 2.85 39.1 23.2 52.2
AA - - 3.24 75.6 88.9 100
P25 - - 3.04 82.8 78.7 100
Catalysts2020,10, 85 8 of 19
Catalysts 2020, 10, x FOR PEER REVIEW 7 of 20
Figure 2. X-ray diffraction (XRD) patterns of the composites. (a) Evonik Aeroxide P25 (89% anatase and 11% rutile photocatalyst (P25). (b) Aldrich anatase (AA)-based. New reflections were detectable between 30–35 (2θ°) when 10% copper is present, pointing out the presence of belloite.
3.2. Transmission Electron Microscopy
To verify the presence of Cu nanoparticles, transmission electron microscopy was used. Figure S1 shows two TEM micrographs of P25-10 Cu composite, in which darker spots may indicate copper nanoparticles. The copper nanoparticles were 1–2 nm in size, while P25 (containing both anatase and rutile nanocrystals) were about 20–40 nm [46]. TiO2 nanocrystals did not show any specific shape, and spherical and polyhedral particles were both found. The copper nanoparticles also did not have any specific shape; rather, they are spherical and randomly located on the surface of the TiO2 crystals.
To ascertain the presence of Cu nanoparticles, more precise approaches were needed.
3.3. Energy-Dispersive X-Ray Spectroscopy (EDX)
EDX was performed to confirm the elemental composition of the composites. The results show that copper is present with TiO2, so the synthesis was successful. This can also be clearly seen in Figure 3. Furthermore, for AA-based composites, interesting results were observed, which are summarized in Table 1, together with the results for the P25-based composites. It was noticed that, as the theoretical copper content increases, the difference between the theoretical and real content increases. Especially in the case of the catalysts containing 5% and 10% Cu, significant differences can be observed. This phenomenon can be explained in several ways: The copper nanoparticles did not adhere onto the surface, or partial transformation to other compounds (which may be soluble in water) can be also presumed. In such a way, it is possible that, in the composites, which contained a higher amount of copper, copper converted to copper oxides or other insoluble compounds, such as belloite, which was detected by XRD. Interestingly, the copper content was the same as the theoretical ones in the case of the P25-based composites, with major differences being observed just for sample P25-10Cu. The results obtained by EDX correlate perfectly with the observations in the section in which the XRD patterns of the samples were investigated.
Figure 3. Element mapping of P25-5Cu composite.
(b)
Figure 3.Element mapping of P25-5Cu composite.
3.4. Diffuse Refllectance Spectroscopy
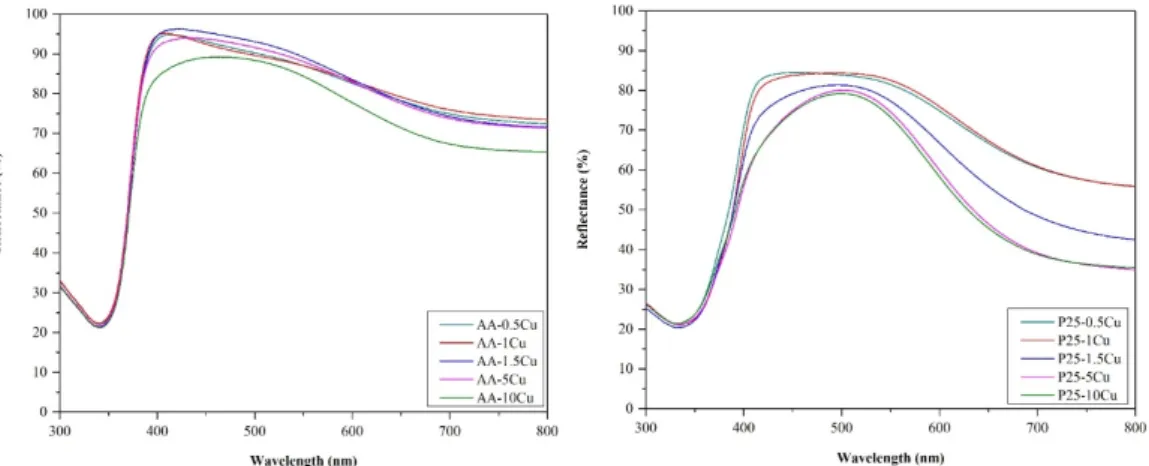
The diffuse reflection spectra differed depending on Cu content, as can be seen in Figure4, so in all cases, the excitation threshold was influenced; in the case of AA, this effect was neglectable. It was found that the presence of copper reduced the bandgap energy in the case of P25. This can be explained considering several facts:
• On the surface of P25 particles, copper was anchored more efficiently, as demonstrated in the previous sections.
• It is interesting that the composites based on AA did not change their band-gap energy. Usually, if a composite component is present in a higher concentration, it should also be visible in the optical properties (in the case of P25, it was visible in the spectra). Therefore, the key to explain this anomaly lies in the number of contacts between Cu containing particles and TiO2. P25 is made of smaller crystallites (25–40 nm) than AA (~80 nm); therefore, the ratio between the Cu and titania particles is totally different, as demonstrated in our recent papers [47,48]. More precisely, as the anatase particles are twice as large in AA than in P25, therefore, the possibility of contacting a Cu containing particle is high in AA, while in the case of P25, it is low. In the latter case, it could be imagined that any kind of inhomogeneity in Cu particle distribution will be visible in the DRS spectra, as well, as it was in our case.
Catalysts 2020, 10, x FOR PEER REVIEW 8 of 20
Table 1. The theoretical and real content of Cu in the composites, and the band gap energies and the degradation efficiencies (for methyl orange and ketoprofen) of the composites. EDX = energy- dispersive X-ray spectroscopy.
Composite Name
Cu (%)
Band Gap (eV)
Methyl Orange Degradation (%)
Ketoprofen Degradation (%)
Rhodamine B Degradation (%) Theoretical Real
(EDX)
AA-0.5Cu 0.5 0.45 3.19 7.1 69.1 35.7 AA-1Cu 1.0 0.94 3.21 6.6 66.1 38.4 AA-1.5Cu 1.5 0.69 3.18 14.5 63.1 40.1
AA-5Cu 5.0 2.35 3.18 17.4 62.6 39 AA-10Cu 10.0 3.95 3.18 23.1 60.8 41.8 P25-0.5Cu 0.5 0.5 2.97 37.5 80.5 84.8 P25-1Cu 1.0 1.1 2.95 38.1 82.6 88.6 P25-1.5Cu 1.5 1.9 2.91 30.5 66.4 90.1
P25-5Cu 5.0 4.7 2.83 24.9 33.5 70.9 P25-10Cu 10.0 6.5 2.85 39.1 23.2 52.2
AA - - 3.24 75.6 88.9 100
P25 - - 3.04 82.8 78.7 100
3.4. Diffuse Refllectance Spectroscopy
The diffuse reflection spectra differed depending on Cu content, as can be seen in Figure 4, so in all cases, the excitation threshold was influenced; in the case of AA, this effect was neglectable. It was found that the presence of copper reduced the bandgap energy in the case of P25. This can be explained considering several facts:
• On the surface of P25 particles, copper was anchored more efficiently, as demonstrated in the previous sections.
• It is interesting that the composites based on AA did not change their band-gap energy. Usually, if a composite component is present in a higher concentration, it should also be visible in the optical properties (in the case of P25, it was visible in the spectra). Therefore, the key to explain this anomaly lies in the number of contacts between Cu containing particles and TiO2. P25 is made of smaller crystallites (25–40 nm) than AA (~80 nm); therefore, the ratio between the Cu and titania particles is totally different, as demonstrated in our recent papers [47,48]. More precisely, as the anatase particles are twice as large in AA than in P25, therefore, the possibility of contacting a Cu containing particle is high in AA, while in the case of P25, it is low. In the latter case, it could be imagined that any kind of inhomogeneity in Cu particle distribution will be visible in the DRS spectra, as well, as it was in our case.
Figure 4. Diffuse reflectance spectroscopy (DRS) spectra (AA-based is shown in the top figure; P25- based is shown in the bottom figure) of the composites: The influence of the excitation threshold is more accentuated on the P25-based catalysts, while the presence of belloite shows an impact on the whole absorption spectrum and the band-gap value itself.
Figure 4.Diffuse reflectance spectroscopy (DRS) spectra (AA-based is shown in the top figure; P25-based is shown in the bottom figure) of the composites: The influence of the excitation threshold is more accentuated on the P25-based catalysts, while the presence of belloite shows an impact on the whole absorption spectrum and the band-gap value itself.
Furthermore, the presence of belloite boosted the visible light absorption of the material, conferring a slight greenish appearance of the samples. It seems also that, after belloite appears in the P25-containing samples, the band gaps decrease 0.1 eV abruptly, showing the intervening in the whole composite functioning mechanism, while this effect never appeared for AA-based composites.
3.5. Photocatalytic Performance of the Composites
3.5.1. Photodegradation of Methyl Orange
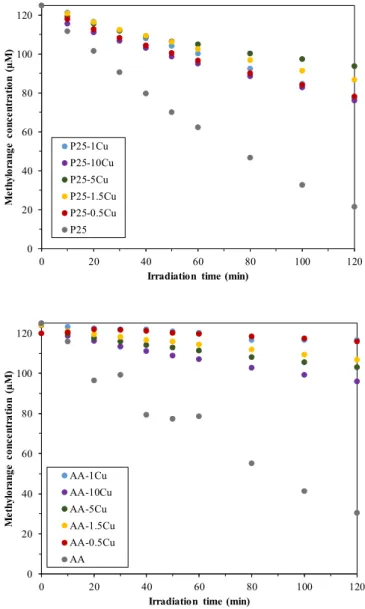
Figure5shows the decomposition curves of methyl orange using the prepared composites.
Unfortunately, none of the copper modified catalysts showed better photocatalytic activity than the base photocatalysts. However, this fact does not mean that the composites would be inactive, as a small amount of methyl orange was degraded in each case. The efficiency values are summarized in TableCatalysts 2020, 10, x FOR PEER REVIEW 10 of 20 1.
Figure 5. Degradation of methyl orange under UV illumination—the composites did not show better activity than the corresponding bare titania. P25-based composites proved to be more efficient than the AA-based ones.
3.5.3. Photodegradation of Rhodamine B
Rhodamine B solution was also used for testing the photocatalytic activity. Figure 7 shows the degradation efficiencies of the synthetized composites. The base catalysts achieved outstanding results, as they decomposed all the Rhodamine B at the end of the 120 min experiment. So, none of the prepared composites managed to show a better performance than their copper-free counterpart.
The P25-based composites showed better photoactivity than the AA-based ones. The degradation efficiencies are also summarized in Table 2. The best activity was performed by P25-1.5Cu (90.1%), which was the highest conversion value among all three types of photocatalytic tests (methyl orange, ketoprofen, and Rhodamine B). It is worth mentioning that all P25-based composites achieved degradation efficiencies above 50%. The AA-based composited had a slightly lower activity, but each of them decomposed at least 35% of the Rhodamine B. The best activity was obtained by AA-10Cu (41.8%), which was followed closely by AA-1.5Cu (40.1%). Altogether, for the degradation of Rhodamine B, 1.5% of copper nanoparticles was the most suitable.
0 20 40 60 80 100 120
0 20 40 60 80 100 120
Methylorange concentration (µM)
Irradiation time (min) P25-1Cu
P25-10Cu P25-5Cu P25-1.5Cu P25-0.5Cu P25
0 20 40 60 80 100 120
0 20 40 60 80 100 120
Methylorange concentration (µM)
Irradiation time (min) AA-1Cu
AA-10Cu AA-5Cu AA-1.5Cu AA-0.5Cu AA
Figure 5.Degradation of methyl orange under UV illumination—the composites did not show better activity than the corresponding bare titania. P25-based composites proved to be more efficient than the AA-based ones.
For composites that contain AA and copper nanoparticles, the increase in copper content improved the photocatalytic activity. No correlation between copper content and photocatalytic activity was observed in the series of P25-based composites. However, in both cases, the best photocatalytic activity was shown by the composite which contained 10% copper nanoparticles. These results contradict those found in the literature. Several publications reported that larger amounts (5%, 10%) were added to the TiO2surface, but the results demonstrate that the minor amounts of copper (0.5%, 3%) resulted in better photocatalytic activity [26,27]. There is no correlation between the specific surface area of the composites and the photocatalytic activity, as the surface area of the titanias (P25—45–55 m2/g
Catalysts2020,10, 85 10 of 19
and AA—10 m2/g) was not affected by the presence of Cu nanoparticles [29]. Moreover, at such a low concentration values of Cu, the surface area of the base photocatalyst cannot be changed significantly.
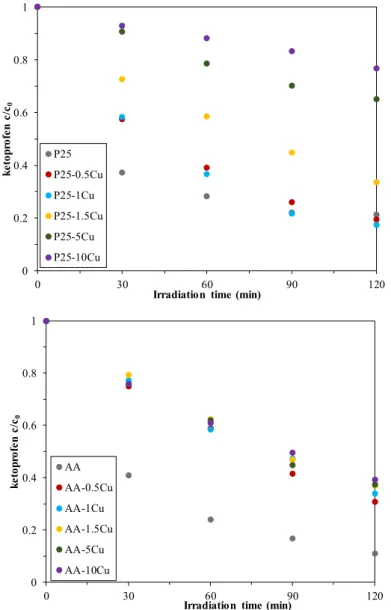
3.5.2. Photodegradation of Ketoprofen
For ketoprofen decomposition, the results are more promising than the methyl orange degradation.
Ketoprofen was removed by each photocatalyst, and even some of the P25-based composites achieved better activity at the end of the 120 min experiment than the base photocatalyst. As in the previous chapter, the conversion values for ketoprofen are summarized in Table 1. Figure 6presents the photocatalytic degradation curves of ketoprofen. In the case of AA and copper composites, the copper content did not significantly influence the activity (69.1–60.8% conversion values). For P25-based catalysts, however, there was a significant difference between the photocatalytic efficiencies, depending on the percentage of the present copper (values between 80.5–23.2%). Contrary to the methyl orange degradation, the increase in copper content reduced the activity in both cases, with the best photocatalytic activity being the composites containing 0.5% Cu (in both cases). Reproducibility was tested in certain cases; however, the results were of no interest. Therefore, they are not included in the manuscript.Catalysts 2020, 10, x FOR PEER REVIEW 11 of 20
Figure 6. Degradation of ketoprofen under the irradiation of UV light—some of the composites achieved better activity than the base catalyst but only in the case of P25.
0 0.2 0.4 0.6 0.8 1
0 30 60 90 120
ketoprofen c/c0
Irradiation time (min) P25
P25-0.5Cu P25-1Cu P25-1.5Cu P25-5Cu P25-10Cu
0 0.2 0.4 0.6 0.8 1
0 30 60 90 120
ketoprofen c/c0
Irradiation time (min) AA
AA-0.5Cu AA-1Cu AA-1.5Cu AA-5Cu AA-10Cu
0 10 20 30 40 50 60 70 80 90 100
Degradation efficiency (%)
Figure 6. Degradation of ketoprofen under the irradiation of UV light—some of the composites achieved better activity than the base catalyst but only in the case of P25.
Catalysts2020,10, 85 11 of 19
3.5.3. Photodegradation of Rhodamine B
Rhodamine B solution was also used for testing the photocatalytic activity. Figure7shows the degradation efficiencies of the synthetized composites. The base catalysts achieved outstanding results, as they decomposed all the Rhodamine B at the end of the 120 min experiment. So, none of the prepared composites managed to show a better performance than their copper-free counterpart. The P25-based composites showed better photoactivity than the AA-based ones. The degradation efficiencies are also summarized in Table2. The best activity was performed by P25-1.5Cu (90.1%), which was the highest conversion value among all three types of photocatalytic tests (methyl orange, ketoprofen, and Rhodamine B). It is worth mentioning that all P25-based composites achieved degradation efficiencies above 50%. The AA-based composited had a slightly lower activity, but each of them decomposed at least 35% of the Rhodamine B. The best activity was obtained by AA-10Cu (41.8%), which was followed closely by AA-1.5Cu (40.1%). Altogether, for the degradation of Rhodamine B, 1.5% of copper nanoparticles was the most suitable.
Figure 6. Degradation of ketoprofen under the irradiation of UV light—some of the composites achieved better activity than the base catalyst but only in the case of P25.
0 0.2 0.4 0.6 0.8 1
0 30 60 90 120
ketoprofen c/c0
Irradiation time (min) P25
P25-0.5Cu P25-1Cu P25-1.5Cu P25-5Cu P25-10Cu
0 0.2 0.4 0.6 0.8 1
0 30 60 90 120
ketoprofen c/c0
Irradiation time (min) AA
AA-0.5Cu AA-1Cu AA-1.5Cu AA-5Cu AA-10Cu
0 10 20 30 40 50 60 70 80 90 100
Degradation efficiency (%)
Figure 7. Photocatalytic degradation efficiencies of Rhodamine B solution under UV light—the P25-based composites showed better activity than the AA-based ones.
Table 2.Conversion vs. reaction rate constant for all the investigated samples.
Sample Name
Methyl Orange Rhodamine B Ketoprofen
H2Production Capacity (mL) Rate Constant
(min−1)
Degradation (%)
Rate Constant (min−1)
Degradation (%)
Rate Constant (min−1)
Degradation (%)
P25 0.0142 82.8 n.a. 100 0.021 78.7 0
P25-0.5Cu 0.0037 37.5 0.0189 84.8 0.0135 80.5 0.304
P25-1Cu 0.0039 38.1 0.0175 88.6 0.0149 82.6 0.466
P25-1.5Cu 0.003 30.5 0.0141 90.1 0.0089 66.4 0.721
P25-5Cu 0.0026 24.9 0.0063 70.9 0.0037 33.5 0.985
P25-10Cu 0.0038 39.1 0.0056 52.2 0.0021 23.2 0.358
AA 0.0107 75.6 n.a. 100 0.0176 88.9 0
AA-0.5Cu 0.0005 7.1 0.0033 35.7 0.0096 69.1 0.061
AA-1Cu 0.0005 6.6 0.0037 38.4 0.0088 66.1 0.338
AA-1.5Cu 0.0011 14.5 0.0038 40.1 0.0083 63.1 0.057
AA-5Cu 0.0015 17.4 0.0035 39.0 0.0083 62.6 0.161
AA-10Cu 0.002 23.1 0.0036 41.8 0.0077 60.8 0.108
n.a.—not available.
3.5.4. The Comparison of Pseudo-First Order Kinetics and the Achieved Degradation Efficiencies For all the degradation experiments, the reaction rate constants were calculated and are summarized in Table 1alongside the conversion values achieved (it must be noted that, in the case of Rhodamine B degradation of bare P25 and AA, the reaction rate constants were not evaluated due to the 100% degradation efficiency in a very short time). The general observation is that those
Catalysts2020,10, 85 12 of 19
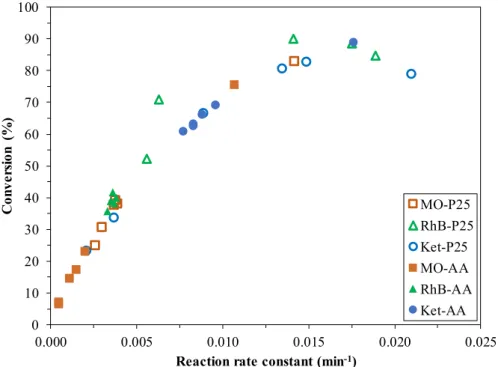
composites which have about the same degradation rate have almost the same reaction rate constants (e.g., for methyl orange degradation, P25-0.5Cu reached 37.5% removal efficiency and the reaction rate constant of 0.0037 min−1, while P25-1Cu showed an efficiency of 38.1%, with the reaction rate constant of 0.0039 min−1). Therefore, it can be concluded that the photocatalysts with the same degradation yield showed the same reaction rate constants, as well. Moreover, as 36 degradation data was available, the degradation yield values and the reaction rate constants are represented and shown in Figure8.
It was found that, with the increase of the rate constants, the conversion values were increasing, as well, to a certain point, and after it, a decrease was observed. The data points in the increase section of the curve are mostly the samples with Cu, while the maximum point and decrease section are the pure photocatalyst, showing that the presence of Cu aligns the conversion values with the reaction rate constants. This could coincide with the proposed reaction mechanism of the investigated compounds, more specifically, of ketoprofen.
Catalysts 2020, 10, x FOR PEER REVIEW 13 of 20
As discussed, until now, the main role of the Cu resides in separating the charges and transferring it to the ketoprofen molecule.
As shown above the electron and the hole utilization was exclusively focused on the decarboxylation of ketoprofen, meaning that the electron transfer and utilization from TiO2 can be equally possible from Cu and from TiO2, as well, balancing out the possible influence on the degradation trend of the copper contents of the samples. This results in a direct relationship between the degradation rate and reaction rate constant, which seems to be valid for all the investigated organic compounds’ degradation. In addition, it can be pointed out the fact that the kinetics of the degradation process do not change as the composite composition changes, which is very interesting since Cu usually intervenes in the degradation pathway.
Figure 8. The evolution of the photocatalytic conversion of the studied organic pollutants in function of the reaction rate constant.
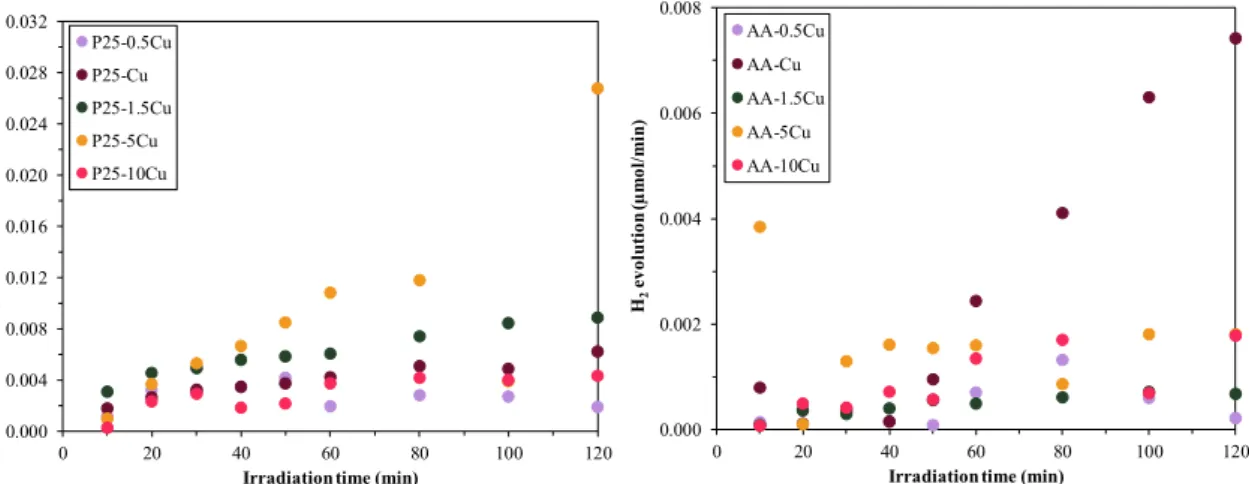
3.5.5. Photocatalytic H2 Production
The photocatalytic hydrogen producing capacity is evaluated in this section. During the photocatalytic conversion under oxygen-free conditions, oxalic acid is mineralized according to the following reaction:
(COOH)2 + 2h+ + 2e− = 2CO2 + H2.
Oxalic acid was used as sacrificial agent, since this method was developed and well-attended by our research group. Using both composites, it was found that the presence of copper nanoparticles contributed to hydrogen generation, as it is commonly known that TiO2 by itself is not suitable for this process. For composites containing P25 and copper, with the increase of Cu content, a better hydrogen producing capability (0.5 < 10 < 1 < 1.5 < 5) was achieved (Figure 9), as the higher copper content resulted in a more efficient charge separation. Although the 10% sample is out of the observed trend, this can be attributed to the presence of belloite, which probably enhances the hydrogen production up to a certain amount (sample P25-5Cu), while, in excess, it shows an inhibitory effect (sample P25-10Cu). In the case of AA-based catalysts, there is no correlation between copper content and the hydrogen-generating capacity. The sample containing 1% copper produced the highest amount of hydrogen. The other samples had similar performance. What can also be observed is that P25-based photocatalysts developed more hydrogen than the AA-based ones because the particle
0 10 20 30 40 50 60 70 80 90 100
0.000 0.005 0.010 0.015 0.020 0.025
Conversion (%)
Reaction rate constant (min-1)
MO-P25 RhB-P25 Ket-P25 MO-AA RhB-AA Ket-AA
Figure 8.The evolution of the photocatalytic conversion of the studied organic pollutants in function of the reaction rate constant.
The degradation mechanism of the copper containing catalysts may follow two main reaction pathways. In both approaches, Cu is considered a very efficient charge separator (the electron affinity of copper is well-known), meaning that the electron is spatially separated from the hole. This consideration yields two approaches:
• It is known that ketoprofen can react with holes directly. This is a plausible approach as the holes are available on the surface of the titania nanoparticles. By the oxidation via holes in the first step, a carbocation is obtained, which can be easily decarboxylated.
• Ketoprofen can uptake the generated photoelectrons, as well. This can occur in two ways:
# First, the ketoprofene molecule captures a photoelectron, forming carbanionic intermediate at the surface of titania (where no Cu is present), which can react further with a hole if one is formed in the vicinity of the organic molecule. This scenario can also lead to a fast decarboxylation of the molecule.
# The photoelectron can be captured, as well, directly from the Cu itself. The resultant carbanionic intermediate results in a metastable radical, which can be transformed into several products, as well.
As discussed, until now, the main role of the Cu resides in separating the charges and transferring it to the ketoprofen molecule.
As shown above the electron and the hole utilization was exclusively focused on the decarboxylation of ketoprofen, meaning that the electron transfer and utilization from TiO2 can be equally possible from Cu and from TiO2, as well, balancing out the possible influence on the degradation trend of the copper contents of the samples. This results in a direct relationship between the degradation rate and reaction rate constant, which seems to be valid for all the investigated organic compounds’ degradation. In addition, it can be pointed out the fact that the kinetics of the degradation process do not change as the composite composition changes, which is very interesting since Cu usually intervenes in the degradation pathway.
3.5.5. Photocatalytic H2Production
The photocatalytic hydrogen producing capacity is evaluated in this section. During the photocatalytic conversion under oxygen-free conditions, oxalic acid is mineralized according to the following reaction:
(COOH)2+2h++2e−=2CO2+H2.
Oxalic acid was used as sacrificial agent, since this method was developed and well-attended by our research group. Using both composites, it was found that the presence of copper nanoparticles contributed to hydrogen generation, as it is commonly known that TiO2by itself is not suitable for this process. For composites containing P25 and copper, with the increase of Cu content, a better hydrogen producing capability (0.5<10<1<1.5<5) was achieved (Figure9), as the higher copper content resulted in a more efficient charge separation. Although the 10% sample is out of the observed trend, this can be attributed to the presence of belloite, which probably enhances the hydrogen production up to a certain amount (sample P25-5Cu), while, in excess, it shows an inhibitory effect (sample P25-10Cu). In the case of AA-based catalysts, there is no correlation between copper content and the hydrogen-generating capacity. The sample containing 1% copper produced the highest amount of hydrogen. The other samples had similar performance. What can also be observed is that P25-based photocatalysts developed more hydrogen than the AA-based ones because the particle size of P25 is smaller, and the surface area is larger; therefore, copper nanoparticles are located on a larger surface [47], and the sacrificial agent can be degraded more efficiently, as well.
Catalysts 2020, 10, x FOR PEER REVIEW 14 of 20
size of P25 is smaller, and the surface area is larger; therefore, copper nanoparticles are located on a larger surface [47], and the sacrificial agent can be degraded more efficiently, as well.
Figure 9. H2 evolution of the composites (P25—left-hand image; AA—right-hand image), showing the enhanced H2 production of P25-based composites.
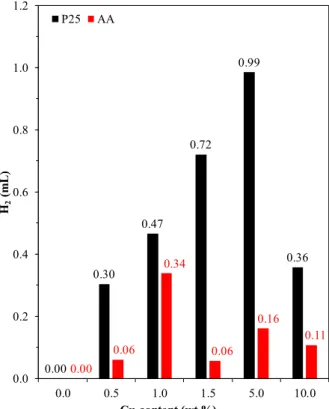
In addition, the total hydrogen generation was evaluated (Figure 10). The generation rate may be dependent from the oxidation state changes in the Cu nanoparticles, and the real overall hydrogen generation performance can be more accurately given if the amount of hydrogen generated is estimated by integrating the area under the evolution curves. If this issue is considered, then, in the case of AA-based composites, the maximum H2 production rate is achieved at 1.0 wt.% of Cu, while in the 1.5 wt.% Cu, the H2 production decreases.
Figure 10. The amount of the generated hydrogen in function of the Cu content of the composites and the base photocatalyst.
Furthermore, in the case of P25-based composites, this trend seems to be untrue, as it increases until 5 wt.% of Cu, decreasing afterwards. These two results are rather interesting because the optimal noble metal content reported in the literature is between 1–1.5% for photocatalytic applications.
0.000 0.004 0.008 0.012 0.016 0.020 0.024 0.028 0.032
0 20 40 60 80 100 120
H2evolution (µmol/min)
Irradiation time (min) P25-0.5Cu
P25-Cu P25-1.5Cu P25-5Cu P25-10Cu
0.000 0.002 0.004 0.006 0.008
0 20 40 60 80 100 120
H2evolution (µmol/min)
Irradiation time (min) AA-0.5Cu
AA-Cu AA-1.5Cu AA-5Cu AA-10Cu
0.00 0.30
0.47 0.72
0.99
0.36
0.00 0.06
0.34
0.06 0.16
0.11 0.0
0.2 0.4 0.6 0.8 1.0 1.2
0.0 0.5 1.0 1.5 5.0 10.0
H2(mL)
Cu content (wt.%) P25 AA
Figure 9.H2evolution of the composites (P25—left-hand image; AA—right-hand image), showing the enhanced H2production of P25-based composites.
In addition, the total hydrogen generation was evaluated (Figure10). The generation rate may be dependent from the oxidation state changes in the Cu nanoparticles, and the real overall hydrogen generation performance can be more accurately given if the amount of hydrogen generated is estimated