Applied Surface Science 565 (2021) 150605
Available online 12 July 2021
0169-4332/© 2021 Published by Elsevier B.V.
Full Length Article
Combination of iodine-deficient BiOI phases in the presence of CNT to enhance photocatalytic activity towards phenol decomposition under visible light
Nikita Sharma
a,b, Zsolt Pap
a,c,d,*, Istv ´ an Sz ´ ekely
c,e, Monica Focsan
c, G ´ abor Karacs
f, Zoltan Nemeth
b, Seema Garg
g, Klara Hernadi
a,h,*aDepartment of Applied and Environmental Chemistry, University of Szeged, H–6720 Rerrich B´ela 1, Szeged, Hungary
bAdvanced Materials and Intelligent Technologies Higher Education and Industrial Cooperation Centre, University of Miskolc, H-3515 Miskolc, Hungary
cNanostructured Materials and Bio-Nano-Interfaces Centre, Institute for Interdisciplinary Research on Bio-Nano-Sciences, Babeș–Bolyai University, RO-400271, Treboniu Laurian 42, Cluj-Napoca, Romania
dInstitute of Research-Development-Innovation in Applied Natural Sciences, “Babeș-Bolyai” University, Fˆantˆanele 30, RO-400294, Cluj-Napoca, Romania
eFaculty of Physics, Babeș–Bolyai University, M. Kog˘alniceanu 1, 400084 Cluj–Napoca, Romania
fMTA-ME Materials Science Research Group, ELKH, H-3515 Miskolc-Egyetemv´aros, Hungary
gDepartment of Chemistry, Amity Institute of Applied Sciences, Amity University, Sector-125, Noida, U.P. 201313, India
hInstitute of Physical Metallurgy, Metal Forming and Nanotechnology, University of Miskolc, HU-3515 Miskolc-Egyetemv´aros, C/1 108, Miskolc, Hungary
A R T I C L E I N F O Keywords:
Bismuth oxo-iodide Carbon nanotubes Bismuth oxy iodides Iodine deficient Phenol Rhodamine B Crystallization
A B S T R A C T
In this work, we have prepared BiOI/CNT composites by hydrothermal method and studied the impact of CNT and hydrothermal treatment conditions (temperature and time) simultaneously on phenomena such as crystal- lization. The samples were studied using X-ray Diffraction (XRD), nitrogen sorption (Brunauer–Emmett–Teller (BET) specific surface areas), Scanning Electron Microscopy assisted with Energy Dispersive X-Ray spectroscopy (SEM-EDX), High Resolution Transmission Electron Microscopy (HRTEM), UV–vis Diffuse Reflectance spec- troscopy (DRS), Raman spectroscopy and photoluminescence spectroscopy (PL). The different heat treatments applied and varied amount of CNT was found to have a profound effect on the structural, morphological, compositional and optical properties of the prepared composites. The distinguishable changes in the above- mentioned properties were clearly visible for the samples prepared at higher temperature and longer duration (150 ◦C, 6.30 h). Surprisingly, the presence of other phases of BiOI, such as Bi7O9I3, Bi4O5I2, Bi5O7I, also co- existed at the same time, although in low amount. Finally, for the study, the photocatalytic efficiency of the prepared samples was tested for phenol and RhB, as model pollutants, under visible light irradiation for 240 min and 120 min, respectively. The results revealed that the composites prepared at higher temperature with longer duration showed superior performance for the photodegradation of phenol and RhB. Additionally, the com- posites performed better than their respective reference samples in each case. Interestingly, the introduction of CNT promoted the crystallinity in the composites and promising results for the removal of phenol and RhB were achieved by the use of low power ordinary visible lamps.
1. Introduction
Photocatalysis is considered as one of the “green technology” in the areas of environmental remediation such as in air sterilization, removal of pollutants and inactivation of microorganisms like viruses from wastewater [1]. Lately, bismuth oxyhalides (BiOX) have emerged as a new class of non-titania photocatalysts in the field of heterogeneous
photocatalysis. These are popularly known for its visible light photo- catalytic response, primarily, due to their narrow band gap and the electronic structure of Bi [2]. As a thumb rule, the photocatalytic ac- tivity is affected with the positions of valence band (VB) and conduction band (CB) of the photocatalyst besides the mobility of charge carriers. In case of Bi-based semiconductor photocatalyst, hybridized O 2p and Bi 6 s valence bands are present, unlike other metal oxides which consists of
* Corresponding authors at: Department of Applied and Environmental Chemistry, University of Szeged, H–6720 Rerrich B´ela 1, Szeged, Hungary.
E-mail addresses: pzsolt@chem.u-szeged.hu (Z. Pap), hernadi@chem.u-szeged.hu (K. Hernadi).
Contents lists available at ScienceDirect
Applied Surface Science
journal homepage: www.elsevier.com/locate/apsusc
https://doi.org/10.1016/j.apsusc.2021.150605
Received 6 May 2021; Received in revised form 1 July 2021; Accepted 8 July 2021
only O 2p orbitals. The presence of this largely dispersed Bi 6 s orbital is beneficial for increasing the mobility of photogenerated charge carriers and reducing the band gap, as broader valence bands enhance the charge transportation. Besides this, their unique layered structure also plays an important role in effective charge separation.
BiOI, as compared to other members of BiOX family, has the lowest band gap energy ~ 1.6–1.9 eV and crystallizes into tetragonal mat- lockite structure. It consist of layers of [Bi2O2]2+slabs interleaved by double slabs of negatively charged halogen atoms. BiOI has been syn- thesized with different morphologies from two-dimensional nanoplates or nanosheets to three-dimensional microflowers. The photocatalytic degradation of pollutants by BiOI included Rhodamine B (RhB) [3], Methyl Orange (MO) [4], Methylene Blue (MB) [5], caffeic acid [6], gallic acid [7], phenol [8,9], bisphenol-A [10] and reduction of Cr (VI) to Cr (III) [11] etc. This shows a huge tendency of BiOI in the field of photocatalysis for waste water treatment [8]. Apart from its higher photocatalytic response, in some cases, BiOI nanocomposites such as with graphene has shown higher adsorption capacity for dyes [12].
However, it still suffers from low photocatalytic efficiency when it comes to practical applications. This is mainly due to the high valence band position which lowers its photo-oxidation ability and promotes fast recombination of photo-generated charge carriers [13,14,15]. Efforts have been made to improve its visible light response, such as facet- controlled synthesis of BiOI [16], morphology-controlled synthesis [17], modifications using metals [18], non-metals (activated carbon, graphene oxide, carbon nanotube) [13] or noble elements (Au, Ag, Pt) [19]. The modifications with several carbon nanostructures including g- C3N4 and carbon dots are also being employed for increasing the effi- ciency of photocatalytic processes [20212223]. All of these works resulted in higher photon absorption ability and hindered the e-/h+ recombination.
In order to elevate its photocatalytic response under visible light region, strategies like composites formation or heterojunctions have been adopted resulting in the efficient separation of electron–hole pairs [24,25]. Moreover, it has a great potential for tuning the desired elec- tronic structure and properties of composites. The most common syn- thesis methods used for the preparation of BiOI and its composites includes hydrothermal [26], solvothermal [27,28] and precipitation [29], out of which, hydrothermal synthesis is the most widely used. J F Florez-Rios et al. reported the hydrothermal synthesis of BiOI and studied the photodegradation of methyl orange dye as model pollutant under visible and UV light source. They found that BiOI powders exhibited better photocatalytic activity under visible light than in UV light. Subsequently, other oxide forms of BiOI were also discovered later, such as, Bi4O5I2, Bi5O7I, Bi7O9I3, α, β- Bi2O3. The thermal treat- ment of BiOI, unlike other bismuth oxyhalides, result in deficiency of iodine atoms, possibly, due to easy loss of iodine and subsequently, producing iodine-deficient BiOI. These BiOI oxide forms and its com- posite were reported to exhibit higher photoactivity than pristine BiOI [30]. Their applications include photocatalysis, photovoltaic applica- tions [31,32,33], photoelectrochemical devices [34], H2 production [35], X-ray detectors [36] and in antifouling activity [37].
A huge amount of research is focused on enhancing the degradation efficiency of the photocatalysts. However, less attention is paid to investigate the thorough study on the roles of modifiers, such as carbonaceous materials, and hence, explaining their influence on certain important phenomena, such as crystallization. One such commonly used modifier is carbon nanotubes which has been widely studied in the diverse field of research including material science, electrochemistry, applied physics, polymer science and environmental sciences. This is evident by the unceasing growth in number of publications concerning CNT in different areas, over the years.
Nearly all of them has focused on two common roles of CNT during photodegradation of organic pollutants. Firstly, the role as a charge separator, where it acts as an electron sink capturing the photogenerated electrons and therefore, extending the lifespan of electron and hole pairs
[38]. In this way the recombination of charge carriers is prevented which leads to an increased photocatalytic activity [39,40,41]. Sec- ondly, it acts as a support material in most cases, especially in a photocatalyst-composite system, because of its large surface area [42].
However, there could be many other roles played by CNTs that needs investigation, such as induced band-gap shifting, crystal orientation, degree of crystallinity, and light absorption properties etc. which has a direct or indirect impact on the photocatalytic activity, also evident from our previous work with BiOBr and CNT composites [43]. None- theless, the amount of CNT is also a governing factor in many cases [44,45]. Some of the studies reported optimum loading amount of CNT that results in enhanced activity while higher amount of CNT marked a decrease in photocatalytic activity due to the light absorption by CNT that becomes prevalent [46].
In this work, we have synthesized composites of bismuth oxoiodides with carbon nanotubes pointing out the role of carbon nanotubes in a composite formation and its influence on the photocatalytic activity.
The samples were prepared via hydrothermal method with varying amount of CNTs to examine their photocatalytic efficiency by studying the photocatalytic degradation of phenol and RhB under visible light.
2. Experimental
2.1. Chemicals and reagents
Bismuth nitrate pentahydrate [Bi (NO3)3⋅5H2O] (Sigma–Aldrich, 98.0%), glacial acetic acid (Molar Chemicals Ltd., 100%), potassium iodide (Molar Chemicals, 99.7 %), functionalized carbon nanotubes (Nanothinx S.A., Greece), Phenol (VWR extra pure, 100%) and RhB (Alfa Aesar, no purity data given). All the reagents were of analytical grade and used without further purification. Deionized water was used for the entire study. Methanol of HPPLC-grade was used for HPLC measurements.
2.2. Preparation of BiOI and BiOI/CNT composites
In this work, 12 samples of BiOI/CNT composites were prepared via hydrothermal crystallization applying different synthesis parameters, such as time and temperature of the hydrothermal crystallization, and the carbon nanotube content. For each set of synthesis conditions, 4 reference samples were also prepared without CNT. In the synthesis process, two solutions A and B were prepared. For solution A, 3 g Bi (NO3)3⋅5H2O was dissolved in 3 mL glacial acetic acid under continuous magnetic stirring and heated up to 45 ◦C to speed up the mixing process until a clear transparent solution was obtained. Furthermore, a calcu- lated amount of CNT was added based on the pre-defined composition values (0.5, 1, 2 wt%) followed by 25 mL deionized water. The mixture was sonicated for 1 h to obtain a black-coloured suspension and this was called solution A. For solution B, 1.03 g potassium iodide (KI) was dis- solved in 25 mL deionized water. Solution B was added dropwise to solution A under continuous magnetic stirring and followed by 20 min of homogenization. The colour of the solution changed from yellowish to dark green and finally a brick red coloured precipitate was formed at the end of 20 min. The mixture was transferred to 120 mL Teflon®-lined stainless-steel autoclave and subjected to heat treatment at different temperature and time intervals (120 ◦C & 150 ◦C for 4:30 h and 6:30 h each). It was allowed to cool down at room temperature and the product was collected and washed with ethanol and deionized water, three times, each time using centrifugation at 4400 rpm for 5 min. The final product was dried at 60–80 ◦C in a vacuum furnace overnight. The Table 1 shows the list of samples prepared and following terminology has been used throughout this study.
2.3. Characterisation
The products were characterized by X-Ray Diffraction (XRD) using a
Rigaku Miniflex II diffractometer (2θ◦=10–70◦, λ (CuKα) =0.15418 nm) equipped with a graphite monochromator for the analysis of the crystal phase and structural properties of the prepared composites, such as the degree of crystallinity and crystal orientations. The mean primary crystallite size was also calculated for the samples using the Scherrer equation [47]. N2 adsorption–desorption measurements were carried out to measure the specific surface areas of the samples, according to the BET (Brunauer-Emmett-Teller) method. Morphological and elemental compositional analysis were carried out using Scanning Electron Mi- croscopy (SEM) with energy-dispersive X-ray (EDX) spectrometer and Transmission Electron Microscopy (TEM). For TEM measurements, the as-prepared samples were examined by high-resolution transmission electron microscopy (HRTEM, FEI Technai G2 electron microscope, 200 kV) to explore the morphology and particle size of the nanocomposites.
Sample preparation was made by dropping an aqueous suspension of the nanocomposites on 300 mesh copper grids (lacey carbon, Ted Pella Inc.).
The diameters of the nanoparticles were measured on the HRTEM im- ages based on the original scale bar using ImageJ software. The optical property was analyzed using Diffuse Reflectance Spectroscopy (UV–vis- DRS) JASCO-V650 with an integration sphere (ILV-724) (λ =300–800 nm). The indirect band-gap energy was calculated using the Kubelka- Munk equation, that is [F(R).hν] p =A(hν – Eg), where, h is Planck constant, Eg is the band gap energy, A is constant and p is dependent on the type of optical transition and is obtained by plotting the graph be- tween (αhν)1/2 vs. photon energy (hν). Raman spectroscopy was used to study the composite formation and crystal defects in the prepared composites. A multilaser confocal Renishaw in Via Reflex Raman spec- trometer equipped with a RenCam CCD detector was employed to record the Raman spectra. The 532 nm (green) laser was applied as an excita- tion source. Using a 0.9NA objective of 100 ×magnification, the Raman spectra were collected. The integration times were 20 s, 1800 lines/mm grating for all spectra, and 10% of the maximum laser intensity – laser power was 20 mW. 4 cm−1 was the spectral resolution. The photo- luminescence (PL) spectra of the materials were acquired on a fluores- cence spectrophotometer (JASCO LP-6500 spectrofluorometer) with 1 nm spectral resolution equipped with Xe lamp as the excitation source and coupled to an epifluorescence accessory (EFA 383 module). The measurements were recorded in the wavelength range of 350–800 nm with fixed excitation wavelength at 365 and 450 nm.
2.4. Photocatalytic measurements
The photocatalytic activity of the composites was determined by measuring the degradation of phenol and rhodamine B in an aqueous solution under visible light. In this test, 4 ×24 W visible light lamps (irradiation time =4:00 h) were used as visible light source. The pho- toreactor system was equipped with a thermostat containing 1 M sodium nitrite solution to eliminate UV light and thus prevent variation in the results. The suspension of the pollutant and photocatalyst was contin- uously purged with air to keep the dissolved oxygen concentration constant during the whole experiment. The initial concentration of phenol (C0) used for the study was 0.1 mM while for RhB was 0.02 mM.
The amount of catalyst loaded was 1.0 g ⋅ L-1 with 130 mL total volume of the suspension (Vsusp). The suspension was ultra-sonicated for 5 min.
For phenol, the suspension was kept in dark for 30 min to ensure the establishment of adsorption–desorption equilibrium with continuous stirring and air supply with irradiation time of 240 min. However, in case of RhB, 60 min of dark period was used and the photocatalytic decomposition was carried out for 120 min. The samples were collected at different time intervals in both case of pollutants. The samples collected were then centrifuged for 3 min at 15000 rpm and filtered using Filtratech 0.25 µm syringe filter. The decrease in concentration of the model pollutants (phenol and RhB) were measured by HPLC and UV spectrophotometer, respectively. HPLC Merck-Hitachi L-7100 with a low-pressure gradient pump, equipped with a Merck-Hitachi L-4250 UV–Vis detector and a Lichrospher Rp 18 column using a methanol/
water (50:50 v/v) mixture as eluent was used for measurements. The detection wavelength for RhB was 553 nm and for phenol 210 nm.
3. Results and discussions 3.1. X-Ray diffraction (XRD)
In the first instance, the diffraction patterns of the as-prepared BiOI/
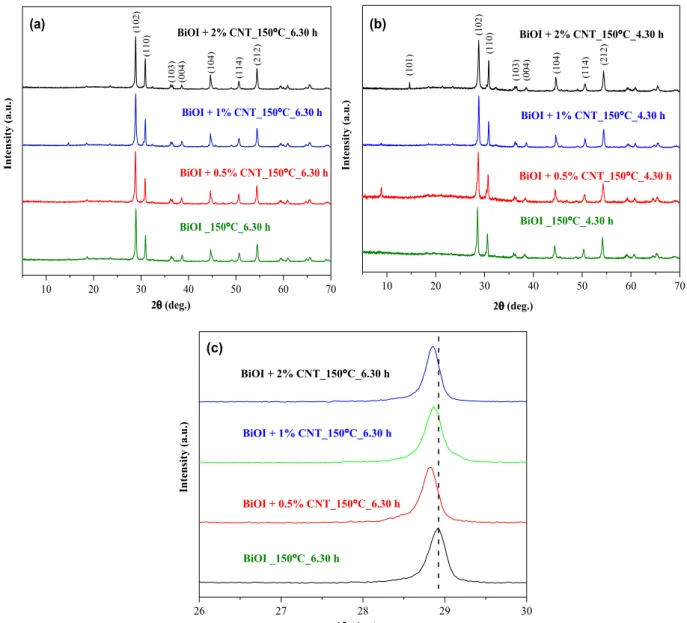
CNT composites and their appropriate references was investigated. The presence of pure BiOI and the coexistence of different iodine-deficient BiOI phases was detected. Phases such as Bi4O5I2, Bi7O9I3 and Bi5O7I were observed. Fig. 1 (a) and (b) shows the diffraction pattern of the sample series prepared at 150 ◦C at 6.30 and 4.30 h, respectively. The characteristic peaks for CNT was not observed due to their relatively low amount.
It is interesting to note that all the characteristic peaks for BiOI tetragonal phase (JCPDS 00–73-2062, 10–0445) were shifted to smaller diffraction angles (shown in Fig. 1 (c)). For instance, the characteristic peak for the most intense peak (102) plane of BiOI was shifted from 29.7◦to 28.6◦-28.8◦(Fig. 1 (c)). This shifting was observed in nearly all the samples. The peaks found at 28.6◦ and 28.8◦ corresponds to the characteristic peak of Bi7O9I3 and Bi4O5I2, respectively, also reported previously[14,15]. This shifting of peaks is probably due to the extra bismuth and oxygen atoms in BiOI crystal lattice which is well- supported by other reports giving rise to other iodine-deficient bis- muth oxoiodides[48]. The diffraction pattern of Bi4O5I2 (characteristic peak at 28.8◦JCSD-713448) is quite different from that of BiOI (char- acteristic peak at 29.7◦, JCPDS no.–10–0445), which makes it easier to distinguish between these two phases. Interestingly, it has been reported that the diffractogram of tetragonal BiOI and Bi7O9I3 are very similar and hard to identify the two phases [26]. We can say that this statement seems to be misleading since after a thorough literature reading we found that the standard JCPDS file of Bi7O9I3 diffraction pattern is wrongly quoted everywhere and rather, in most cases, denoted to Bi4O5I2-based studies. Therefore, we concluded that the diffraction patterns of Bi4O5I2 and Bi7O9I3 are very close to each other with their characteristic peaks at 28.8◦and 28.6◦. This is because the more the iodine loss, the stronger the shift of diffraction peaks to lower angle is observed due to increase in lattice parameters [49].
Through XRD results it seems that the presence of Bi4O5I2 is observed in the case of samples prepared at higher temperature (150 ◦C) while lower temperature leads to stabilisation of Bi7O9I3 and Bi5O7I phases.
This phase transformation process in BiOI is supported by the fact that as the heat treatment is applied or calcination of BiOI is progressed, pure BiOI transforms to other oxide forms since those are thermodynamically favourable [50]. Yu. Changlin et al. also reported about the thermal instability of BiOI [51]. Unlike reported in their work about the lower temperature conditions influencing the crystallinity of the samples, in our case, CNTs enhanced the crystallinity of our samples which was also observed in our previous work [43]. With increasing amount of CNT, higher degree of crystallization was observed which, indeed, influences the photodegradation efficiency. In this way, it could be said that CNT Table 1
List of BiOI and BiOI/CNT composite samples prepared at different synthesis conditions.
List of the as-prepared samples with different CNT amount and at different synthesis temperature and time conditions
BiOI_120◦C_4.30 h BiOI_150◦C_4.30 h
BiOI +0.5 %CNT_120◦C_4.30 h BiOI +0.5 %CNT_150◦C_4.30 h BiOI +1 %CNT_120◦C_4.30 h BiOI +1 %CNT_150◦C_4.30 h BiOI +2 %CNT_120◦C_4.30 h BiOI +2 %CNT_150◦C_4.30 h BiOI_120◦C_6.30 h BiOI_150◦C_6.30 h
BiOI +0.5 %CNT_120◦C_6.30 h BiOI +0.5 %CNT_150◦C_6.30 h BiOI +1 %CNT_120◦C_6.30 h BiOI +1 %CNT_150◦C_6.30 h BiOI +2 %CNT_120◦C_6.30 h BiOI +2 %CNT_150◦C_6.30 h
favours ordered structure. Hence, for obtaining crystalline structures, CNT could play a significant role. Finally, the primary crystallite size of all the samples were calculated via Scherrer Equation and fall in the range between 55 nm and 90 nm, except for the sample “BiO- I_120◦C_4.30 h”. Moreover, the variations in crystallite size were found to be independent of the amount of CNTs. There is also no significant difference observed in the particle size based on different synthesis conditions. On whole, the effect of synthesis conditions on the occur- rence of different forms of bismuth oxoiodides are following:
(i) Applying higher temperature conditions for longer duration (150 ◦C, 6.30 h), Bi4O5I2 phase was identified.
(ii) When the temperature was increased but with shorter duration (150 ◦C, 4.30 h), Bi4O5I2 phase became prominent again.
(iii) When the temperature was decreased (at 120 ◦C), irrespective of time, the end result indicated the presence of different phases (Bi7O9I3 +Bi5O7I). In a similar condition, the presence of mixed phases was observed and such changes were stated due to the difference in pH conditions, as reported by Xian Xao et al. [52].
These results suggest that the heat-treatment process plays a very
crucial role in defining the conversion and formation of new crystal structures, also highlighted by Hang Liu [53]. Herein, correctly identi- fying the different phases of BiOI becomes very important as will be discussed in the subsequent sections. As we know, high temperature treatment of BiOI such as annealing or calcination results in phase transformation of BiOI. However, in our study, phase transformation of BiOI occurred at lower temperature conditions. This subject, therefore, raises question on the stability of BiOI formation even at lower synthesis temperature conditions. If the above descriptions are true about the presence of iodine-deficiency species then we may get some confirma- tion through the following section of EDX (Section 3.2).
3.2. Energy dispersive X-Ray analysis (EDX)
The samples were tested for their elemental composition by EDX spectrometer. As demonstrated in the previous sections of XRD, the higher temperature condition led to changes in structural property of the composites. Interestingly, similar observations were also seen in case of compositional characteristics. The EDX measurement of samples syn- thesised at 150 ◦C showed the compositional changes which indicated the iodine-deficiency, as presented in Table 2. Further, the iodine
10 20 30 40 50 60 70
(102)
Intensity (a.u.)
2 (deg.)
(212)
(114)
(104)
(004)(103)
(110)
BiOI + 2% CNT_150 C_6.30 h
BiOI + 1% CNT_150 C_6.30 h
BiOI + 0.5% CNT_150 C_6.30 h
BiOI _150 C_6.30 h
(a)
10 20 30 40 50 60 70
(110)
BiOI _150 C_4.30 h
BiOI + 0.5% CNT_150 C_4.30 h BiOI + 1% CNT_150 C_4.30 h
(104) (212)(114)
(004)(103)
(101)
Intensity (a.u.)
2 (deg.)
(102) BiOI + 2% CNT_150 C_4.30 h
(b)
26 27 28 29 30
BiOI _150 C_6.30 h BiOI + 2% CNT_150 C_6.30 h
Intensity (a.u.)
2 (deg.) BiOI + 1% CNT_150 C_6.30 h
BiOI + 0.5% CNT_150 C_6.30 h (c)
Fig. 1. XRD diffractograms of BiOI and BiOI/CNT sample series belonging to the higher temperature conditions prepared at different time intervals (a) 150 ◦C at 6.30 h (b) 150 ◦C at 4.30 h (c) expanded XRD diffraction patterns of the BiOI/CNT samples fabricated at 150 ◦C for 6.30 h.
leaching was also observed during washing of samples which again in- dicates the loss of iodine from the samples. Not only this but iodine fumes were also visible when autoclaves were opened at the end of synthesis process and the “free” iodine painted the Teflon of the auto- clave in “pinkish/purplish” colour that again proves iodine deficiency in the prepared samples. At this point, it is important to note that iodine was not added in excess (see synthesis section). The EDX spectrum demonstrated the presence of main elements of the composites (Bi, O and I). EDX spectra of a sample can be found in Fig S1 (Supporting file).
This loss of iodide atoms could be considered as defects which, in turn, are known for enhancing the photocatalytic response. The defects could act as active centre at the interface between catalyst and organic pollutant surface. For instance, Montero et al has reported a direct connection between the photocatalytic activity and defects type indi- cating that they play an important role in altering the photocatalytic response [54]. In several other cases it could be seen that presence of defects extended the light absorption spectral range of many photo- catalysts, including ZnO and TiO2 [55,56].
3.3. Scanning electron microscopy (SEM) and high resolution Transmission electron microscopy (TEM)
The morphology of the composites was analysed by SEM. As shown in Fig. 2, clearly two distinct types of morphologies were observed with changes in the hydrothermal crystallization temperature conditions.
With rise in temperature from 120 ◦C to 150 ◦C, a complete trans- formation in morphology was observed, from sheet-like to microflower- type morphology, respectively. The prepared composites have irregular nanosheet-like morphology with smooth surface at 120 ◦C, as shown in Fig. 2 (a-c). The catalyst particles could be seen as aggregated on the CNT’s surface. CNT were found to be non-uniformly distributed throughout the sample. Also, the nanosheets were stacked on top of each other and partially aggregated as well (Fig. 2 (a)). Apart from agglom- eration of nanosheets and carbon nanotubes, there were holes present on
the surface of microsheets obtained at lower temperature conditions (120 ◦C). Similar porous-kind of morphology was also observed by Yang et al, where they synthesized porous Bi5O7I nanosheets [57]. At higher temperature (150 ◦C), microflower-like morphology was found. Fig. 2 shows the deposition of catalyst particles on the walls of CNT. In most of the studies, it was reported that the use of solvents like polyethylene glycol [58] can facilitate in obtaining hierarchal structures and helps in the prevention of agglomeration of sheets but the use of water doesn’t seems to solve this problem. However, in our study, no organic solvent was used throughout the study, rather change in temperature conditions led to a three-dimensional morphology. It could be said that the self- assembly of sheets occurred at higher temperature conditions without the use of surfactants or any template-directing agents.
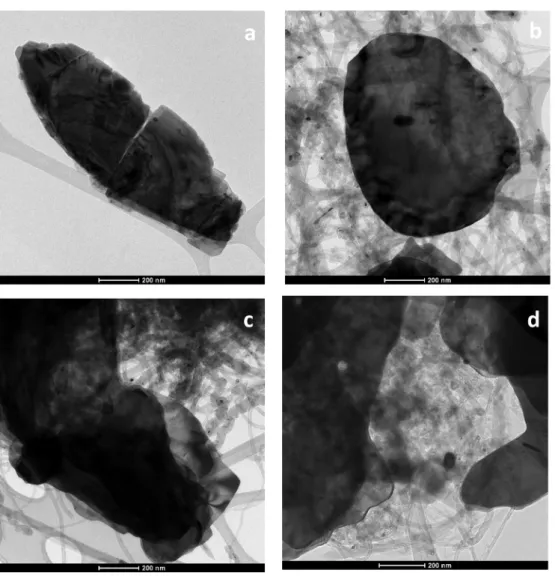
The morphology of MWCNT-based composite materials was inves- tigated by HRTEM technique. Fig. 3 a-d shows TEM micrographs of BiOI (Fig. 3 a), and BiOI/CNT (Fig. 3 b-d) nanocomposites at various CNT content, respectively. From TEM images, it can be concluded that larger BiOI inorganic microparticles are attached to the surface of CNTs. Based on detailed electron microscopy investigation, no significant difference was found between the morphologies of nanocomposites produced with various CNT contents. We also took into consideration that the TEM images show only a two-dimensional projection of the real three- dimensional particles; consequently, the observed particle size distri- bution is practically a distribution of the projected dimension of the particles. Based on the TEM observations the average particle size of the BiOI particles was approximately 1 µm which showed good agreement with the measured particles size values originating from XRD and SEM investigations.
3.4. N2 Adsorption
All the samples prepared were found to have low specific surface area ranging from 2.6 to 9.2 m2/g. However, no specific trends were observed with different CNT content or hydrothermal synthesis Table 2
Atomic ratio values of Bi/I/O elements in sample series of BiOI and BiOI/CNT prepared at 150 ◦C and 4.30 h.
Sample Bi (atomic%) I% (atomic%) O% (atomic%) Theoretical Ratio (Bi:I:O) Experimental Ratio (Bi:I:O)
BiOI_150◦C _4.30 h 15.44 14.48 66.39 1:1:1 1:0.93:4.30
BiOI +0.5 %CNT_150◦C _4.30 h 16.47 14.49 64.51 1:1:1 1:0.88:3.92
BiOI +1 %CNT_150◦C _4.30 h 16.37 15.12 64.00 1:1:1 1:0.92:3.91
BiOI +2 %CNT_150◦C _4.30 h 17.43 14.53 65.41 1:1:1 1:0.83:3.75
5 m
5 m 5 m
5 m 5 m 5 m
(a) (b) (c)
(d) (e) (f)
120°C
150°C
Fig. 2. SEM micrographs of BiOI and BiOI/CNT composites prepared at 120 ◦C and 150 ◦C (a) BiOI +1 %CNT_120◦C_6.30 h (b) BiOI_120◦C_4.30 h (c) BiOI +1 % CNT_120◦C_4.30 h (d, e) BiOI +1 %CNT_150◦C_6.30 h (f) BiOI +0.5 %CNT_150◦C_4.30 h.
conditions (time and temperature). The low specific surface area of composites is also evident from XRD which is the higher primary crys- tallite size of the prepared samples. As discussed, the samples have low
specific surface areas which was also reported in a study by Yun Jang et al. [57]. These low values for specific surface area of our samples is usual in case of bismuth-based semiconductors such as bismuth Fig. 3. Representative TEM micrographs of BiOI (a); BiOI +0.5% CNT (b); BiOI +1% CNT (c) and BiOI +2% CNT nanocomposites (d) prepared at 150C and 6.30 h.
1.5 2.0 2.5 3.0 3.5 4.0 4.5
0.0 0.5 1.0 1.5 2.0 2.5
(F®.hv)0.5
Energy (eV) BiOI_120 C_4.30 h BiOI+0.5% CNT_120 C_4.30 h BiOI+1% CNT_120 C_4.30 h BiOI+2% CNT_120 C_4.30 h BiOI+120 C_6.30 h BiOI+0.5 % CNT_120 C_6.30 h
BiOI+1 % CNT_120 C_6.30 h BiOI+2 % CNT_120 C_6.30 h
1.5 2.0 2.5 3.0 3.5 4.0 4.5
0.0 0.5 1.0 1.5 2.0 2.5
BiOI_150 C_4.30 h BiOI+0.5% CNT_150 C_4.30 h BiOI+1% CNT_150 C_4.30 h BiOI+2% CNT_150 C_4.30 h BiOI+150 C_6.30 h BiOI+0.5 % CNT_150 C_6.30 h
BiOI+1 % CNT_150 C_6.30 h BiOI+2 % CNT_150 C_6.30 h
Energy (eV)
(F®.hv)0.5
Fig. 4.UV–Vis DRS plots of transformed Kubelka-Munk function versus the energy of sample series at low and high temperature conditions with different CNT% (a) BiOI and BiOI/CNT at 120 ◦C at 4.30 h (b) BiOI and BiOI/CNT at 150 ◦C at 6.30 h.
oxoiodides [59]. The specific surface area of the sample BiOI +2 % CNT_150_6.30 h was calculated to be 6.7 m2/g which is 2.6 times of its reference sample.
3.5. Optical measurements
The optical properties of the composites were investigated by UV–Vis diffuse reflectance spectroscopy (UV-DRS). Fig. 4 (a) and (b) shows the DRS spectra of the composites for the band gap values of the prepared samples. The light absorption edge of the composites was above 620 nm which suggests that the composites can be efficiently excited under visible light. The Eg of the prepared samples fall in the range of 1.46 – 1.82 eV. In the case of the samples prepared at lower temperature condition (120 ◦C) with nanosheets morphology, Eg values was in the range between 1.60 and 1.79 eV while in the case of higher temperature (150 ◦C) with microflower-like morphology, the broader range of Eg was observed ranging from 1.46 to 1.82 eV. The blue shift in absorption edge maximum was observed. This blue shift is probably due to several iodine deficiency or defects created by iodine deficiency which modifies the band structure, also reported by Xuewen Wang et al. [34]. This is in accordance with a report where a similar shift was noticed in samples with iodine deficiency and oxygen rich bismuth oxoiodides.
Clearly, the transition from tetragonal BiOI to monoclinic Bi4O5I2 occurred when temperature was raised from 120 ◦C to 150 ◦C. As evident from our XRD and EDX discussions (Sections 3.1. and 3.2.) about the successful identification of iodine-deficient BiOI (Bi4O5I2 +Bi7O9I3 + Bi5O7I), this could be further supported through our DRS results which indicates the presence of compounds in a stoichiometric ratio.
This means that if there is presence of non-stoichiometric compounds then their peaks of first derivative spectra would be randomly distrib- uted which in contrast to our results, lies on the same point.
Another spectacular observation found was the relation of iodine deficiency on band gap values of composites. Theoretically, Bi4O5I2 has least iodine deficiency and those samples containing predominantly Bi4O5I2 phase showed lower band gap values. In contrast, Bi7O9I3 and Bi5O7I are relatively more iodine-deficient and samples with these phases attained higher band gap.
3.6. Raman measurements
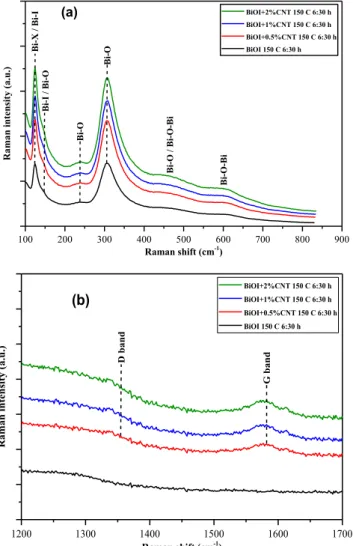
The Raman spectra of the BiOI and BiOI/CNT samples reveal infor- mation about the samples’ crystallinity and surface defects. We identi- fied vibrations modes at 96, 125, 148 (weak shoulder of the 125 cm−1 vibration mode), 238, and 307 cm−1 in the Raman spectra, as shown in Fig. 5 (a). We also observed weak shoulders in the 400 – 500 and 550 – 650 cm−1 regions. The Raman bands at 96 (slightly cut off on the spectrum), 125 and 148 cm−1 correspond to the Bi-X, respectively Bi-I bonds [60–62]. The band at 238 and 307 cm−1 correspond to Bi-O vi- brations bonds [63,64]. The shoulders in the 400 – 500 and 550 – 650 cm−1 regions have been attributed to the Bi-O and Bi-O-Bi bonds [60,63]. Regarding the presence of CNT in the composites, it is specu- lative to prove it by Raman Spectroscopy since only the G band was identified in the spectra, see Fig. 5 (b). The weak intensity of the G band and the D band’s lack could be explained by the small amount of the added CNT.
From the information obtained from the Raman spectra, there is probably not only BiOI but also other bismuth oxides in the samples, evidenced by the shoulders at 238 cm−1, between 400 and 500 and 550 – 650 cm−1 regions, and the band at 307 cm−1. These bands appeared in every sample, so it is safe to conclude that the CNT addition did not induce their presence.
To prove the presence of surface defect in the samples, respectively I- vacancies, we have used the information obtained from the Raman spectra. To determine the surface defects ratio, we have chosen the in- tensities of the 307, 238 and 125 cm−1 bands since they provide infor- mation about the Bi-O and Bi-I bonds. The ratio of the following
intensities was calculated: I307/I125, respectively I238/I125. The per- centage of carbon nanotubes directly influenced the samples’ surface defects (Fig. 6 (a) – increased percentage of CNT lead to a higher number of surface defects, but also it impacts the photocatalytic activity con- cerning phenol degradation. The sample to which no CNT was added presented the smallest number of surface defects, but also the lowest photodegradation of phenol. The addition of CNT to the samples lead to more and more surface defects; which in turn lead to a higher photo- catalytic activity for phenol degradation. This behaviour can be explained as with increase in the number of surface defects, more and more so-called active sites on the samples’ surface are present which help to generate •OH and •O2– radicals, which are crucial for the pho- tocatalytic degradation of phenol[1665].
Concerning the percentage of CNT and surface defects determined from the I238/I125 ratio (Fig. 6 (b)) no obvious trend can be observed between them, but it should be mentioned that the peak percentage of CNT lead to the highest number of surface defects. In contrast when CNT presence was on 1% the lowest number of surface defects was observed.
Just as in the case of phenol degradation, also in the case of Rhodamine B degradation the same phenomenon was observed – namely that a higher number of surface defects leads to higher conversion rates. In contrast with phenol degradation, these surface defects, in the case of Rhodamine B can act also as active sites for the adsorption of the dye, but as well can enhance the samples’ photocatalytic activity – by generating •OH and •O2– radicals, thus improving the photocatalytic activity [66,67].
100 200 300 400 500 600 700 800 900
Bi-O-Bi
Bi-O / Bi-O-Bi
Bi-O
Bi-O
Bi-X / Bi-I Bi-I / Bi-O
Raman intensity (a.u.)
Raman shift (cm-1)
BiOI+2%CNT 150 C 6:30 h BiOI+1%CNT 150 C 6:30 h BiOI+0.5%CNT 150 C 6:30 h BiOI 150 C 6:30 h
(a)
1200 1300 1400 1500 1600 1700
(b)
G band
D band
Raman intensity (a.u.)
Raman shift (cm-1)
BiOI+2%CNT 150 C 6:30 h BiOI+1%CNT 150 C 6:30 h BiOI+0.5%CNT 150 C 6:30 h BiOI 150 C 6:30 h
Fig. 5. (a) Raman spectra of BiOI and BiOI/CNT composite samples (b) D and G bands of the CNT.
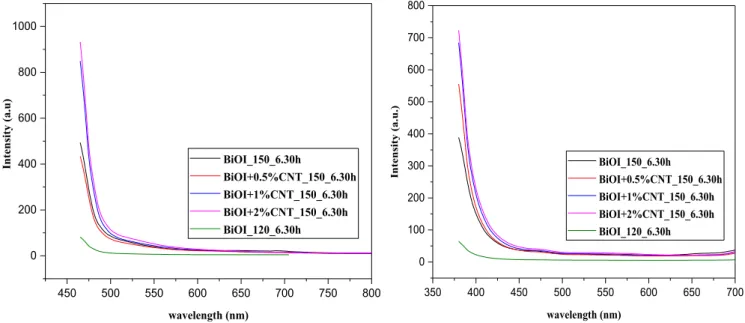
3.7. Photoluminescence spectra
The photoluminescence is one of the most useful technique to eval- uate the recombination rate of electron/hole pairs (e-/h+). Fig. 7 (a) and (b) shows the PL spectra with excitation wavelengths at 450 nm and 365 nm, respectively. As we know, the lower intensity of PL spectra means lower recombination rate of e-/h+. In our case also, we could observe lower PL intensity and no fluorescence signal detected which indicated extremely low probability of charge carriers in all the sample cases suggesting higher photodegradation for phenol.
3.8. Photocatalytic measurements
Photocatalytic efficiency of the prepared samples was demonstrated by the removal of two model pollutants (phenol and RhB) in aqueous solution under visible light (λ > 420 nm). This time-dependence degradation efficiency of the BiOI/CNT composites was compared with their respective reference samples (without CNT), as shown in Fig. 8 (a). The composites were tested first for phenol and the minimum degradation efficiency obtained was around 13% after 240 min under
visible light irradiation. This low efficiency was observed in the case of all reference samples. Conversely, an improved photocatalytic activity was seen in the case of all composites. The highest degradation effi- ciency of around 28% was achieved by the composite BiOI +0.5 % CNT_120_4.30 h followed by BiOI +2 %CNT_150_6.30 h under visible light irradiation. The obtained-results show that in case of phenol the composites performed better than their respective references with maximum degradation efficiency of almost 2.8 times of the reference samples under visible light irradiation. Supplementary file, Fig. S2 (a) and (b) show graphs representing the photocatalytic efficiency of the samples. This can be considered among promising results since phenol has a complex degradation mechanism, which involves phenol in- termediates, and the kinetics of the phenol mineralization probably consists of competitive degradation reactions between phenol and its intermediates, respectively, phenol is known to have a poor adsorption affinity. Also, ordinary lamps were used rather than expensive Xenon lamps which points towards cost-effectiveness.
The overall photocatalytic efficiency of the different sample series was also evaluated for RhB as model pollutant under visible light irra- diation for a period of 120 min. Likewise for RhB, the composites with
0.0 0.5 1.0 1.5 2.0
0.93 0.95 0.96 0.98 0.99 1.01 1.02
I307/I125 (a.u.) Phenol conversion (%) Amount of carbon nanotubes (CNT%) I307/I125 (a.u.)
(a)
12.0 14.4 16.9 19.3 21.7 24.1 26.6 29.0
Phenol conversion (%)
0.0 0.5 1.0 1.5 2.0
0.424 0.425 0.426 0.427 0.428 0.429 0.430 0.431
(b)
I238/I125 (a.u.)
RhodamineB conversion (%)
Amount of carbon nanotubes (CNT%) I238/I125 (a.u.)
42.0 44.5 47.0 49.5 52.0 54.5 57.0
RhodamineB conversion (%)
Fig. 6. Correlations between the samples surface defects and degradation efficiency in function of carbon nanotubes percentage in the samples for (a) phenol (b) RhB.
450 500 550 600 650 700 750 800
0 200 400 600 800 1000
Intensity (a.u)
wavelength (nm)
BiOI_150_6.30h
BiOI+0.5%CNT_150_6.30h BiOI+1%CNT_150_6.30h BiOI+2%CNT_150_6.30h BiOI_120_6.30h
350 400 450 500 550 600 650 700
0 100 200 300 400 500 600 700 800
Intensity (a.u.)
wavelength (nm)
BiOI_150_6.30h
BiOI+0.5%CNT_150_6.30h BiOI+1%CNT_150_6.30h BiOI+2%CNT_150_6.30h BiOI_120_6.30h
Fig. 7. Photoluminescence spectra of BiOI and BiOI/CNT composites at (a) 450 nm (b) 365 nm.
CNT showed higher photocatalytic activity than their reference samples, see Fig. 8 (b). Similarly, in supplementary file, Fig. S3 (a) and (b) compare the activity response of reference samples (without CNT) and the best performing composites (whole sample series of 150◦C_6.30 h).
As can be seen from Fig. 8 (b), with increasing CNT content, the pho- tocatalytic activity of these composites increased as well, with the maximum degradation efficiency of 56% under visible light irradiation.
This is almost 2.5 times of its reference. It is noteworthy to point here that at this temperature the composites attained micro-flower morphology, which has been known to contribute to enhancing the rate of photodegradation process. The second-best performing sample series were also from the higher temperature series but with shorter duration, which again has micro-flower type morphology. Among all, the composite “BiOI +2% CNT_150_4.30 h” showed the best photo- catalytic activity for RhB under visible light after 120 min, as evident from the Fig. 8 (b), while the same sample also performed relatively good in case of phenol photodegradation with almost 24% degradation efficiency under visible light irradiation. Majority of the samples shows increasing trend for RhB degradation as CNT content was increasing, which again proves that CNT addition also results in gain of activity, besides imparting crystallinity in the composites structures.
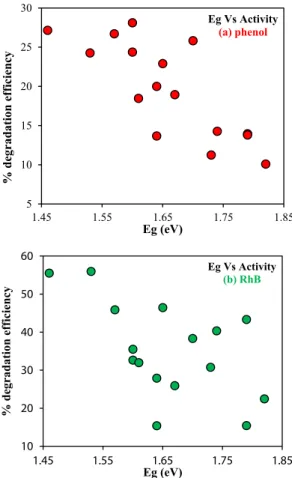
The best parameter to analyze the photocatalytic activity of the semiconductor photocatalyst is their band gap (Eg). For that reason, we made some noteworthy correlations with the Eg of all the samples with their respective photocatalytic activity for phenol and RhB and then connecting with the different phase compositions, as confirmed through our XRD, EDX and DRS results above.
Firstly, the connection between Eg and photocatalytic activity of the composites were made, shown in Fig. 9 (a) and (b). The correlation shows the similar trend for band gap energies of the composites to the
degradation efficiency for both the pollutants (phenol and RhB) under visible light. From Fig. 9, it is clear that as the band gap energy of the composites is increased, the photocatalytic activity decreases. This was an opposite trend observed as compared to our previous studies on BiOBr/CNT composites [43]. Besides, as mentioned in our DRS (Section 3.5.), the sample with dominant phase Bi4O5I2, has lower band gap energy value. Clearly, it is now also visible from our correlation that samples with lower Eg outperforms the samples with higher band gap.
Therefore, Bi4O5I2 could be regarded as an active phase. Similarly, for samples with the presence of Bi7O9I3 phase which is reverse in the case of samples with Bi5O7I phase.
Another significant correlation was made with the Eg and the pres- ence of these different iodine-deficient BiOI species. The following ob- servations were derived from this:
a) It can be seen from Fig. 10 that samples containing Bi4O5I2 (denoted by number 5) is the most active, again verified previously from Fig. 9.
b) The samples with Bi7O9I3 (denoted by number 9) have relatively moderate activity.
c) The samples with Bi5O7I (denoted by number 7) are the least active, even in its pure phase form, unlike the above-mentioned two phases, also justified from Fig. 9.
d) Another significant thing to be considered here is when the samples consisted of the pure phase only (numbered as 5 or 7 or 9), the ac- tivity was lower as compared to the samples comprising of mixed phases (for eg. 5 +9 or 9 +7 or 5 +7).
Theoretically the order of iodine deficiency in these compounds follows the order as: Bi5O7I > Bi7O9I3 > Bi4O5I2, which means Bi5O7I 0
5 10 15 20 25 30
120°C_4.30h 120°C_6.30h 150°C_4.30h 150°C_6.30h
% degradation
(a) 0% CNT 0.5% CNT 1% CNT 2% CNT
0 10 20 30 40 50 60
120°C_4.30h 120°C_6.30h 150°C_4.30h 150°C_6.30h
% degradation
(b)
0 % CNT 0.5 % CNT 1 % CNT 2 % CNT
Fig. 8. (a) Degradation efficiency of composites with different %CNT for removal of phenol under visible light (b) Degradation efficiency of composites with different %CNT for removal of RhB under visible light.
10 20 30 40 50 60
1.45 1.55 1.65 1.75 1.85
% degradation efficiency
Eg (eV)
Eg Vs Activity (b) RhB 5
10 15 20 25 30
1.45 1.55 1.65 1.75 1.85
% degradation efficiency
Eg (eV)
Eg Vs Activity (a) phenol
Fig. 9. Correlation between the band gap energy of composites with photo- catalytic degradation efficiency of (a) phenol, and (b) RhB under visible light irradiation.
has least amount of iodine out of all and Bi4O5I2 contains maximum iodine than the rest two. After carefully analyzing the correlations given in Fig. 10, we can say that the activity of pure phases was enhanced when combined with other phases. This can be thought of appearance of a “junction” at the inner composite interfaces, in other words meaning that due to the presence of mixed phases in the sample it leads to the formation of certain heterojunctions within the structure just like in the case of TiO2 (at the interface of anatase and rutile phase) and that could be the reason for an enhanced activity of the composites. Moreover, the presence of CNT is yet another important factor for increased photo- catalytic activity, as can be seen in Fig. 9 (a) and (b). With slight increase in CNT content, high photocatalytic activity can be obtained. Therefore, it could be concluded here that a number of factors are contributing in efficient removal of the pollutants (phenol and RhB) and their inter- dependence can explain the significance of studying about the instable behavior of bismuth oxoiodides.
4. Conclusion
In summary, BiOI/CNT composites were synthesised at different time and temperature conditions via hydrothermal method. Different compositions of composites with CNT were prepared (0.5%, 1%, 2%).
All three different parameters (synthesis temperature, synthesis time and CNT) have affected the prepared composites in different ways. First and foremost, noticeable changes were observed through SEM in- vestigations in morphology indicating the transformation from nano- sheets to microflower-like structures as the temperature increased.
Thereafter, higher degradation efficiency for phenol and RhB was ach- ieved by BiOI/CNT composites than their respective reference samples.
Moreover, the composites with microflower morphology showed supe- rior photocatalytic performance for both the pollutants. The results achieved for the photodegradation of phenol, in this study, are prom- ising since ordinary visible light was used as a source of irradiation, unlike Xe-lamps which are commonly used. The different aspects re- ported for the enhanced photocatalytic activity of the composites are crystallinity, presence of more than one phase (iodine-deficient) in BiOI, CNT and last but not the least, the synthesis parameters. By changing the synthesis conditions, we observed that mixed phases in BiOI were pre- sent. In this way, we can say that this study provides a clear under- standing of the instability of BiOI existence as pure phase even at lower temperature conditions, without using any special treatments, like annealing or calcination, which requires higher temperature conditions.
At every point it is vital to identify the different type of BiOI present so as to answer adequately which phase is responsible for the photocatalytic activity enhancement.
CRediT authorship contribution statement
Nikita Sharma: Conceptualization, Visualization, Investigation, Writing - original draft, Formal analysis. Zsolt Pap: Conceptualization, Visualization, Data curation. Istvan Sz´ ´ekely: Investigation, Software.
Monica Focsan: Investigation, Data curation. Gabor Karacs: Investi-´ gation, Visualization. Zoltan Nemeth: Formal analysis. Seema Garg:
Supervision. Klara Hernadi: Writing - review & editing, Supervision, Resources.
Declaration of Competing Interest
The authors declare that they have no known competing financial interests or personal relationships that could have appeared to influence the work reported in this paper.
Acknowledgement
This work was supported by the Indo-Hungarian TET project ´ (T´ET_15_IN-1-2016-0013 and Department of Science and Technology, Delhi, India (INT/HUN/P-06/2016). The authors would like to acknowledge the financial support received from Bilateral Scholarship, Tempus Public Foundation, Hungary. Special thanks to my colleagues Korn´elia Ba´an, Szilvia Fodor, Gyulav´ari Tamas, Kov´ ´acs G´abor for car- rying out N2 adsorption, SEM and DRS measurements. This research was supported by the European Union and the Hungarian State, co-financed by the European Regional Development Fund in the framework of the GINOP-2.3.4-15-2016-00004 project, aimed to promote the cooperation between higher education and the industry.
Appendix A. Supplementary data
Supplementary data to this article can be found online at https://doi.
org/10.1016/j.apsusc.2021.150605.
References
[1] A. Habibi-Yangjeh, S. Asadzadeh-Khaneghah, S. Feizpoor, A. Rouhi, Review on heterogeneous photocatalytic disinfection of waterborne, airborne, and foodborne viruses: Can we win against pathogenic viruses? J. Colloid Interface Sci. 580 (2020) 503–514, https://doi.org/10.1016/j.jcis.2020.07.047.
[2] H. AN, Y. DU, T. WANG, C. WANG, W. HAO, J. ZHANG, Photocatalytic properties of BiOX (X =Cl, Br, and I), Rare Met. 27 (3) (2008) 243–250.
[3] X. Wang, S. Yang, H. Li, W. Zhao, C. Sun, H. He, High adsorption and efficient visible-light-photodegradation for cationic Rhodamine B with microspheric BiOI photocatalyst, RSC Adv. 4 (80) (2014) 42530–42537, https://doi.org/10.1039/
C4RA05506C.
[4] X. Xiao, Y. Lin, B. Pan, W. Fan, Y. Huang, Photocatalytic degradation of methyl orange by BiOI/Bi4O5I2 microspheres under visible light irradiation, Inorg. Chem.
Commun. 93 (2018) 65–68, https://doi.org/10.1016/j.inoche.2018.05.009.
[5] T. Yan, H. Liu, M. Sun, X. Wang, M. Li, Q. Yan, W. Xu, B. Du, Efficient photocatalytic degradation of bisphenol A and dye pollutants over BiOI/Zn2SnO4 heterojunction photocatalyst, RSC Adv. 5 (14) (2015) 10688–10696, https://doi.
org/10.1039/C4RA13990A.
[6] A.C. Mera, Y. Moreno, J.Y. Pivan, O. Pe˜na, H.D. Mansilla, Solvothermal synthesis of BiOI microspheres: Effect of the reaction time on the morphology and photocatalytic activity, J. Photochem. Photobiol. A Chem. 289 (2014) 7–13, https://doi.org/10.1016/j.jphotochem.2014.05.015.
[7] A.C. Mera, D. Contreras, N. Escalona, H.D. Mansilla, BiOI microspheres for photocatalytic degradation of gallic acid, J. Photochem. Photobiol. A Chem. 318 (2016) 71–76, https://doi.org/10.1016/j.jphotochem.2015.12.005.
[8] Y. Li, J. Wang, H. Yao, L. Dang, Z. Li, Journal of Molecular Catalysis A : Chemical Efficient decomposition of organic compounds and reaction mechanism with BiOI photocatalyst under visible light irradiation, “Journal Mol. Catal. A, Chem. 334 (1- 2) (2011) 116–122, https://doi.org/10.1016/j.molcata.2010.11.005.
[9] X. Huang, Q. Guo, B. Yan, H. Liu, K. Chen, S. Wei, Y. Wu, L.i. Wang, Study on photocatalytic degradation of phenol by BiOI/Bi2WO6 layered heterojunction synthesized by hydrothermal method, J. Mol. Liq. 322 (2021) 114965, https://doi.
org/10.1016/j.molliq.2020.114965.
[10] M. Pan, H. Zhang, G. Gao, L.u. Liu, W. Chen, Facet-Dependent Catalytic Activity of Nanosheet-Assembled Bismuth Oxyiodide Microspheres in Degradation of Bisphenol A, Environ. Sci. Technol. 49 (10) (2015) 6240–6248, https://doi.org/
10.1021/acs.est.5b00626.
[11] J. Jiang, Z. Mu, P. Zhao, H. Wang, Y. Lin, Photogenerated charge behavior of BiOI/
g-C3N4 photocatalyst in photoreduction of Cr (VI): A novel understanding for high- 7
9+7
9+7 9+7
BiOI + X 5 7 9
9+7 5+7
5+7 5+7
5 5
5 + 9 5 + 9
0 5 10 15 20 25 30
1.45 1.5 1.55 1.6 1.65 1.7 1.75 1.8 1.85
degradation efficiency (%)
Eg(eV) 5 = Bi4O5I2
7 = Bi5O7I 9 = Bi7O9I3
Fig. 10. Correlation with Eg, photocatalytic efficiency and different phases of iodine-deficient BiOI.