molecules
Article
The Effect of the Reducing Sugars in the Synthesis of Visible-Light-Active Copper(I) Oxide Photocatalyst
Szilvia Fodor1,2, Lucian Baia2,3 , Kornélia Baán1, Gábor Kovács2,4 , Zsolt Pap1,2,4,5,* and Klara Hernadi1,6,*
Citation: Fodor, S.; Baia, L.; Baán, K.;
Kovács, G.; Pap, Z.; Hernadi, K. The Effect of the Reducing Sugars in the Synthesis of Visible-Light-Active Copper(I) Oxide Photocatalyst.
Molecules2021,26, 1149. https://
doi.org/10.3390/molecules26041149
Academic Editor: Marco Anni
Received: 13 January 2021 Accepted: 17 February 2021 Published: 21 February 2021
Publisher’s Note:MDPI stays neutral with regard to jurisdictional claims in published maps and institutional affil- iations.
Copyright: © 2021 by the authors.
Licensee MDPI, Basel, Switzerland.
This article is an open access article distributed under the terms and conditions of the Creative Commons Attribution (CC BY) license (https://
creativecommons.org/licenses/by/
4.0/).
1 Department of Applied and Environmental Chemistry, University of Szeged, Rerrich tér 1,
6720 Szeged, Hungary; fod_szilvia@chem.u-szeged.hu (S.F.); kornelia.baan@chem.u-szeged.hu (K.B.)
2 Nanostructured Materials and Bio-Nano-Interfaces Centre, Institute for Interdisciplinary Research on Bio-Nano-Sciences, Treboniu Laurian 42, 400271 Cluj-Napoca, Romania; lucian.baia@phys.ubbcluj.ro (L.B.);
gkovacs@chem.ubbcluj.ro (G.K.)
3 Faculty of Physics, Babes,–Bolyai University, M. Kogălniceanu 1, 400084 Cluj-Napoca, Romania
4 Institute of Environmental Science and Technology Tisza Lajos krt. 103, 6720 Szeged, Hungary
5 Institute of Research-Development-Innovation in Applied Natural Sciences, Babes-Bolyai University, Fântânele 30, 400294 Cluj-Napoca, Romania
6 Institute of Physical Metallurgy, Metal Forming and Nanotechnology, University of Miskolc, 3515 Miskolc-Egyetemváros, Hungary
* Correspondence: pzsolt@chem.u-szeged.hu (Z.P.); hernadi@chem.u-szeged.hu (K.H.)
Abstract:In the present work, shape tailored Cu2O microparticles were synthesized by changing the nature of the reducing agent and studied subsequently.D-(+)-glucose,D-(+)-fructose,D-(+)xylose,
D-(+)-galactose, andD-(+)-arabinose were chosen as reducing agents due to their different reducing abilities. The morpho-structural characteristics were studied by X-ray diffraction (XRD), scanning electron microscopy (SEM), and diffuse reflectance spectroscopy (DRS), while their photocatalytic activity was evaluated by methyl orange degradation under visible light (120 min). The results show that the number of carbon atoms in the sugars affect the morphology and particle size (from 250 nm to 1.2µm), and differences in their degree of crystallinity and photocatalytic activity were also found.
The highest activity was observed when glucose was used as the reducing agent.
Keywords:reducing sugars; copper(I) oxide; visible light activity; photocatalysts; shape tailoring
1. Introduction
One of the most promising approaches to convert solar energy into chemical energy is heterogenous photocatalysis [1,2]. The photocatalytic degradation of organic pollutants in wastewater can be achieved by using different semiconductors irradiated with ultraviolet or visible light [3].
Due to the practical usage of natural solar energy for wastewater treatment, the development of visible-light-active semiconductors is preferable. To this end, different types of photocatalysts were created, of which the most researched are perhaps the SnS2[4], ZnS [5], BiOX(X = Cl, Br, I) [6], and MWO4(M2+= Co, Cu, Pb, Cd, Mn, and Zn) [7]. An example of promising results using vis-light-active photocatalysts were presented by Ning et al. [8]. Many parameters can affect the photocatalytic activity, this is the reason why several scientific publications focus on this feature.
In solution-phase synthesis of Cu2O crystals, a typical route is the simple reduction of copper (II) salts [9,10]. By modifying the experimental parameters (e.g., temperature, stabi- lizing agent, or reducing agent) investigated so far, significant structural and morphological differences were induced and thus, the photocatalytic activity of the semiconductors could be increased [11]. The morphology [12], optical properties [13–15], crystal structure [16,17], and applicability [18,19] of semiconductors can also be controlled by varying the previously listed synthesis parameters.
Molecules2021,26, 1149 2 of 9
One of the parameters just mentioned can be the temperature [20] or the stabilizing agent [9,10]. As mentioned above, different precursor materials can be used, which can lead to changes in the properties of the product as well [9].
The amount and the type of the reducing agents may also have an important influence, similar to the effect of compounds used in noble metal nanoparticles’ synthesis [21,22].
The most commonly used reducing agents in the synthesis of noble metal nanoparticles are hydrazine and borohydride (strong reducing agents) or sometimes hydrogen gas for slower reduction, which result in different particle shapes [23–25].
Typical reducing agents for the synthesis of Cu2O are ascorbic acid [26–28] and glucose [29–32]. However, a systematic study concerning the influence of different reducing agents is still missing.
Since photocatalysis can be considered/viewed as a green chemical water purification process regarding some aspects, it is important for these semiconductors to be produced in the most environmentally friendly manner possible. As examples, in their environmentally friendly synthesis, glucose and other aldose and ketose sugars were demonstrated as promising candidates for reducing agents [33].
For this reason, in this study, the production of Cu2O semiconductors was accom- plished by chemical reduction with sugars having different carbon chain length, which has also been demonstrated by Kumbhar, P et al. [34]. The impact of these compounds on the characteristics of the semiconductors and their photocatalytic behavior was studied.
2. Results
2.1. Investigation of Structural Properties of Cu2O Samples—Dependence on Reducing Agent Scanning electron microscopy was used to study the morphology of the Cu2O mi- croparticles. From the SEM micrographs shown in Figure1, a microcubic Cu2O morphology can be observed, which could be related to the ethylenediaminetetraacetic acid (EDTA) complexing agent used in the synthesis [10,30]. The particle size distributions are presented in the inserted histograms of the samples.
Molecules 2021, 26, x 2 of 9
One of the parameters just mentioned can be the temperature [20] or the stabilizing agent [9,10]. As mentioned above, different precursor materials can be used, which can lead to changes in the properties of the product as well [9].
The amount and the type of the reducing agents may also have an important influ‐
ence, similar to the effect of compounds used in noble metal nanoparticles’ synthesis [21,22]. The most commonly used reducing agents in the synthesis of noble metal nano‐
particles are hydrazine and borohydride (strong reducing agents) or sometimes hydrogen gas for slower reduction, which result in different particle shapes [23–25].
Typical reducing agents for the synthesis of Cu2O are ascorbic acid [26–28] and glu‐
cose [29–32]. However, a systematic study concerning the influence of different reducing agents is still missing.
Since photocatalysis can be considered/viewed as a green chemical water purification process regarding some aspects, it is important for these semiconductors to be produced in the most environmentally friendly manner possible. As examples, in their environmen‐
tally friendly synthesis, glucose and other aldose and ketose sugars were demonstrated as promising candidates for reducing agents [33].
For this reason, in this study, the production of Cu2O semiconductors was accom‐
plished by chemical reduction with sugars having different carbon chain length, which has also been demonstrated by Kumbhar, P et al. [34]. The impact of these compounds on the characteristics of the semiconductors and their photocatalytic behavior was studied.
2. Results
2.1. Investigation of Structural Properties of Cu2O Samples—Dependence on Reducing Agent Scanning electron microscopy was used to study the morphology of the Cu2O micro‐
particles. From the SEM micrographs shown in Figure 1, a microcubic Cu2O morphology can be observed, which could be related to the ethylenediaminetetraacetic acid (EDTA) complexing agent used in the synthesis [10,30]. The particle size distributions are pre‐
sented in the inserted histograms of the samples.
Figure 1. Scanning electron microscopy (SEM) micrographs of Cu2O microcubes obtained from CuCl2 precursor; the effect of the reducing sugars (top row: sugars containing six carbon atoms; bottom row: sugars containing five carbon atoms) can be observed in the size distribution and the morphology; the inset figure on the upper left for each sample contains Figure 1.Scanning electron microscopy (SEM) micrographs of Cu2O microcubes obtained from CuCl2precursor; the effect of the reducing sugars (top row: sugars containing six carbon atoms; bottom row: sugars containing five carbon atoms) can be observed in the size distribution and the morphology; the inset figure on the upper left for each sample contains the SEM micrograph of a single particle, while the particle size distribution is presented in the upper right corner of each micrograph.
Molecules2021,26, 1149 3 of 9
From the histograms, the predominant size was ~1.2µm in most cases. The exceptions were sample Cu2O_GA, where the size distribution of the particles was wide (0.5–1.5µm), and sample Cu2O_XY, where smaller particles with a size of 250 nm and larger particles with a size of 1.2µm could be simultaneously observed.
Furthermore, the SEM micrographs show another interesting morphological fea- ture: in case of a reducing sugar of six carbon atoms (Cu2O_GA, Cu2O_GL, Cu2O_FR)—
additional edges appeared on the microcubes’ faces; this phenomenon was not observed in the samples where the reducing sugar contained five carbon atoms.
The degree of the delimiting planes which formed the new edge was calculated using ImageJ. The highest value was registered for fructose (16◦), followed by glucose (9◦), while the smallest angle was in the case of galactose (4◦). After analyzing the morphology of the particles, the crystal structure of the particles was determined by X-ray diffractome- try (XRD).
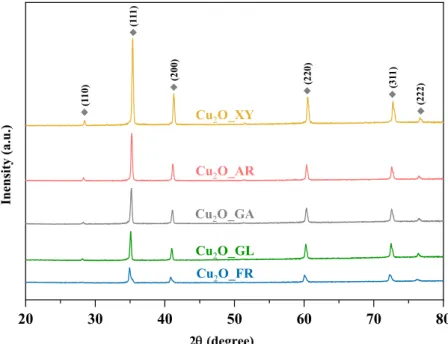
The XRD patterns of the microcubes are shown in Figure2. All the diffractions of the samples observed at 2θ◦ values of 29.40◦, 36.33◦, 42.16◦, 61.47◦, 73.35◦, and 77.41◦ can be attributed to the characteristic diffractions of cubic Cu2O (JCPDS file no. 05–0667), which correspond to the (110), (111), (200), (220), (311), and (222) crystallographic planes, respectively. From the XRD patterns, no other characteristic signals of CuO or Cu can be detected, indicating that pure Cu2O was obtained.
Molecules 2021, 26, x 3 of 9
the SEM micrograph of a single particle, while the particle size distribution is presented in the upper right corner of each micrograph.
From the histograms, the predominant size was ~1.2 μm in most cases. The excep‐
tions were sample Cu2O_GA, where the size distribution of the particles was wide (0.5–
1.5 μm), and sample Cu2O_XY, where smaller particles with a size of 250 nm and larger particles with a size of 1.2 μm could be simultaneously observed.
Furthermore, the SEM micrographs show another interesting morphological feature:
in case of a reducing sugar of six carbon atoms (Cu2O_GA, Cu2O_GL, Cu2O_FR)—addi‐
tional edges appeared on the microcubes’ faces; this phenomenon was not observed in the samples where the reducing sugar contained five carbon atoms.
The degree of the delimiting planes which formed the new edge was calculated using ImageJ. The highest value was registered for fructose (16°), followed by glucose (9°), while the smallest angle was in the case of galactose (4°). After analyzing the morphology of the particles, the crystal structure of the particles was determined by X‐ray diffractometry (XRD).
The XRD patterns of the microcubes are shown in Figure 2. All the diffractions of the samples observed at 2θ° values of 29.40°, 36.33°, 42.16°, 61.47°, 73.35°, and 77.41° can be attributed to the characteristic diffractions of cubic Cu2O (JCPDS file no. 05–0667), which correspond to the (110), (111), (200), (220), (311), and (222) crystallographic planes, respec‐
tively. From the XRD patterns, no other characteristic signals of CuO or Cu can be de‐
tected, indicating that pure Cu2O was obtained.
Figure 2. XRD patterns of the Cu2O samples—all the characteristic diffractions of Cu2O were marked with a grey rectangle.
As the signal/noise ratio increases, the degree of crystallinity decreases in the diffrac‐
tograms (from top to bottom, Figure 2).
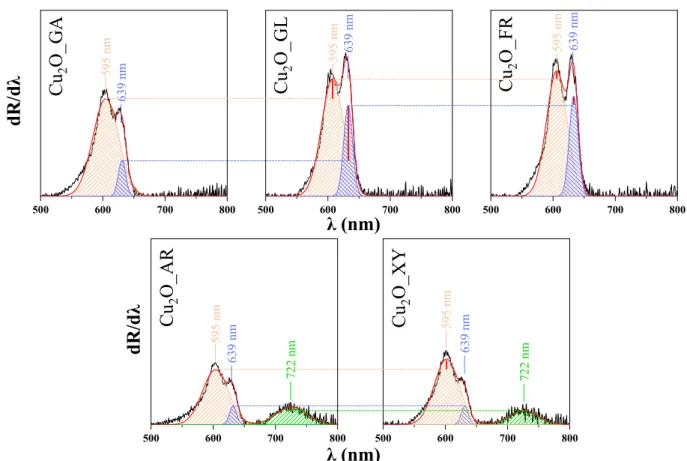
To investigate the optical properties of the Cu2O materials, their diffuse reflectance spectroscopy (DRS) spectra were recorded, then the first derivatives of the spectra were plotted (Figure 3) and deconvoluted. The deconvolution revealed the appearance of three different peaks located at 595 nm (2.08 eV), 639 nm (1.94 eV) and 722 nm (1.71 eV). The peak corresponding to the band gap value of Cu2O was observed at 1.94 eV (at 639 nm) but several other possible electron transitions could be assigned based on the literature [35].
20 30 40 50 60 70 80
Cu2O_XY
Cu2O_FR Cu2O_GA Cu2O_AR
Cu2O_GL
Inensity (a.u.)
2(degree)
(111)
(110) (200) (220) (311) (222)
Figure 2.XRD patterns of the Cu2O samples—all the characteristic diffractions of Cu2O were marked with a grey rectangle.
As the signal/noise ratio increases, the degree of crystallinity decreases in the diffrac- tograms (from top to bottom, Figure2).
To investigate the optical properties of the Cu2O materials, their diffuse reflectance spectroscopy (DRS) spectra were recorded, then the first derivatives of the spectra were plotted (Figure3) and deconvoluted. The deconvolution revealed the appearance of three different peaks located at 595 nm (2.08 eV), 639 nm (1.94 eV) and 722 nm (1.71 eV). The peak corresponding to the band gap value of Cu2O was observed at 1.94 eV (at 639 nm) but several other possible electron transitions could be assigned based on the literature [35].
Molecules2021,26, 1149 4 of 9
Molecules 2021, 26, x 4 of 9
Figure 3. The deconvolution of the first order‐derivative diffuse reflectance spectroscopy (DRS) spectra of the synthe‐
sized Cu2O samples (500–800 nm).
As detailed in the discussion of SEM micrographs, influence of the reducing sugars’
carbon chain length (five vs. carbon six carbon atoms) was observed. In the DRS spectra of Cu2O_XY and Cu2O_AR, a new band appeared at 722 nm assigned to the localized sur‐
face plasmon resonance (LSPR) [36] of Cu2O. The broad appearance of this LSPR band is in agreement with the literature [37–40]. Localized surface plasmon resonance can be ob‐
served at increased concentration of free carriers (holes) in the material due to the intro‐
duction of copper vacancies, resulting in the increase of hole concentration as well [41,42].
The LSPR is related to and dependent on the degree of crystallinity [35]. This is in agreement with the observations reported here, as the specific LSPR band was observed only in the case of samples with the highest crystallinity (Cu2O_XY and Cu2O_AR).
The peak located at 595 nm can be explained by the appearance of the excitonic bandgap, which can form when the semiconductor absorbs a photon of higher energy than its own band gap [40]. The exciton band for Cu2O is located around 2.1 eV [40,41].
2.2. Investigation of the Effect of Reducing Sugars on the Photocatalytic Activity of Cu2O Samples
After the physico‐chemical characterization of the samples, their photocatalytic per‐
formance was determined using visible light irradiation, using methyl orange as model pollutant. As it was mentioned in the introduction, photocatalytic oxidation is an im‐
portant purification process that involves a light‐activated catalyst which reacts with ad‐
sorbed organic pollutants to oxidize them. Essentially, these molecules undergo a chemi‐
cal reaction that transforms them into harmless substances. As shown in Figure 4, the ef‐
ficiency of the methyl orange (MO) photodegradation by the different Cu2O samples showed promising results.
500 600 700 800
Cu
2O_AR
500 600 700 800
Cu
2O_FR
500 600 700 800
Cu
2O_GA
500 600 700 800
Cu
2O_ GL
500 600 700 800
Cu
2O_XY
595 nm 639 nm 639 nm595 nm 639 nm595 nm
595 nm 639 nm 595 nm 639 nm
722 nm 722 nm
dR/ d λ dR/d λ
λ (nm)
λ (nm)
Figure 3.The deconvolution of the first order-derivative diffuse reflectance spectroscopy (DRS) spectra of the synthesized Cu2O samples (500–800 nm).
As detailed in the discussion of SEM micrographs, influence of the reducing sugars’
carbon chain length (five vs. carbon six carbon atoms) was observed. In the DRS spectra of Cu2O_XY and Cu2O_AR, a new band appeared at 722 nm assigned to the localized surface plasmon resonance (LSPR) [36] of Cu2O. The broad appearance of this LSPR band is in agreement with the literature [37–40]. Localized surface plasmon resonance can be observed at increased concentration of free carriers (holes) in the material due to the introduction of copper vacancies, resulting in the increase of hole concentration as well [41,42].
The LSPR is related to and dependent on the degree of crystallinity [35]. This is in agreement with the observations reported here, as the specific LSPR band was observed only in the case of samples with the highest crystallinity (Cu2O_XY and Cu2O_AR).
The peak located at 595 nm can be explained by the appearance of the excitonic bandgap, which can form when the semiconductor absorbs a photon of higher energy than its own band gap [40]. The exciton band for Cu2O is located around 2.1 eV [40,41].
2.2. Investigation of the Effect of Reducing Sugars on the Photocatalytic Activity of Cu2O Samples After the physico-chemical characterization of the samples, their photocatalytic per- formance was determined using visible light irradiation, using methyl orange as model pollutant. As it was mentioned in the introduction, photocatalytic oxidation is an important purification process that involves a light-activated catalyst which reacts with adsorbed organic pollutants to oxidize them. Essentially, these molecules undergo a chemical reac- tion that transforms them into harmless substances. As shown in Figure4, the efficiency of the methyl orange (MO) photodegradation by the different Cu2O samples showed promising results.
Molecules2021,26, 1149 5 of 9
Molecules 2021, 26, x 5 of 9
Figure 4. Degradation curves of methyl orange during the photocatalytic degradation tests under visible light irradiation.
Significant differences were observed among the photocatalytic activities of the sam‐
ples. In case of the arabinose‐reduced sample (Cu2O_AR), the photocatalytic activity was negligible with a conversion of only 6.4%. The highest activity, 91.2%, was observed with the Cu2O reduced by glucose (Cu2O_GL).
As shown in Figure 5, the small specific surface area values also proved that hierar‐
chical systems were not composed of smaller crystallites. The sample with the lowest spe‐
cific surface area was Cu2O_FR (0.1 m2/g) and the largest is Cu2O_GL (2 m2/g). It is well known that the accuracy of N2 adsorption (Brunauer–Emmett–Teller ‐ BET) analysis is very low in the region of the above‐mentioned specific surface area values. However, there is some surprising correlation between photocatalytic activity and specific surface areas. Differences in surface area of the samples can also contribute to the observed dif‐
ferences in photocatalytic activity.
0 0.1 0.2 0.3 0.4 0.5 0.6 0.7 0.8 0.9 1
0 20 40 60 80 100 120
C/C0
Irradiation time (min) Cu O_GL
Cu O_FR Cu O_GA Cu O_AR Cu O_XY
6.41
17.80
31.43
60.51
91.26 Conversion (%)
KONVERZIÓ (%)
2 2 2 2 2
Figure 4.Degradation curves of methyl orange during the photocatalytic degradation tests under visible light irradiation.
Significant differences were observed among the photocatalytic activities of the sam- ples. In case of the arabinose-reduced sample (Cu2O_AR), the photocatalytic activity was negligible with a conversion of only 6.4%. The highest activity, 91.2%, was observed with the Cu2O reduced by glucose (Cu2O_GL).
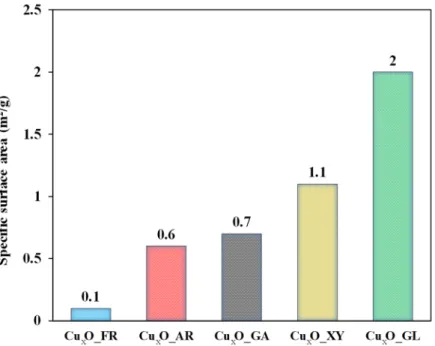
As shown in Figure5, the small specific surface area values also proved that hier- archical systems were not composed of smaller crystallites. The sample with the lowest specific surface area was Cu2O_FR (0.1 m2/g) and the largest is Cu2O_GL (2 m2/g). It is well known that the accuracy of N2adsorption (Brunauer–Emmett–Teller - BET) analysis is very low in the region of the above-mentioned specific surface area values. However, there is some surprising correlation between photocatalytic activity and specific surface areas.
Differences in surface area of the samples can also contribute to the observed differences in photocatalytic activity.
Regarding micrometer sized photocatalyst particles and their very low specific surface areas, aspects responsible for the enhanced photocatalytic activity should be discovered elsewhere. The possible role of interparticle voids seems to be a plausible solution, in turn, bulky microcubes in SEM images (Figure1) do not make it very probable that they possess notable extent of porosity. Nevertheless, such a significant difference in photocatalytic activities of samples highlights the importance of using different sugars. One hypothetical reason could be an instrumentally undetectable constraint, which is caused by the diversity of sugar molecules.
Molecules2021,26, 1149 6 of 9
Molecules 2021, 26, x 6 of 9
Figure 5. Specific surface area of the Cu2O samples—N2 adsorption measurements (BET).
Regarding micrometer sized photocatalyst particles and their very low specific sur‐
face areas, aspects responsible for the enhanced photocatalytic activity should be discov‐
ered elsewhere. The possible role of interparticle voids seems to be a plausible solution, in turn, bulky microcubes in SEM images (Figure 1) do not make it very probable that they possess notable extent of porosity. Nevertheless, such a significant difference in photo‐
catalytic activities of samples highlights the importance of using different sugars. One hy‐
pothetical reason could be an instrumentally undetectable constraint, which is caused by the diversity of sugar molecules.
3. Materials and Methods 3.1. Materials
In the syntheses, copper (II) chloride dihydrate(CuCl2 2H2O, Alfa Aesar, Karlsruhe, Germany, 99+%) was used as precursor. As stabilization agent, ethylenediaminetet‐
raacetic acid (EDTA, C10H16N2O8, Molar, Halásztelek, Hungary, 99.5%) was used. Addi‐
tionally, sodium hydroxide—NaOH (Molar, Halásztelek, Hungary, 99.98%) was used as precipitation agent and D‐(+)‐glucose (Acros Organics, Morris Plains, NJ, USA, 99%), D‐ (+)‐fructose (Alfa Aesar, Kandel, Germany, 98+%), D‐(+)‐xylose (Alfa Aesar, Kandel, Ger‐
many, 98+%), D‐(+)‐galactose (VWR, Radnor, PA, USA, 98+%) and D‐(+)‐arabinose (Sigma Aldrich, St Louis, MO, USA ≥99%) as reducing agents. For the purification step, Milli‐Q water and acetone (VWR, ≥99.5%) were used. All the chemicals were used without further purification.
3.2. Characterization Methods
X‐ray diffractograms (XRD) were acquired by a Rigaku Miniflex II diffractometer (Prague, Czech Republic) using Cu‐Kα radiation (λ = 1.5406 Å), equipped with a graphite monochromator. Data points were taken in the 2θ° = 20–80° range at a scan speed of 1∙(2θ°)∙min−1 [42].
Scanning electron microscopy (SEM) micrographs were recorded with a Hitachi S‐
4700 Type II FE‐SEM (Tokyo, Japan) instrument, which operates using a cold field emis‐
sion gun (5–15 kV). The size distribution of the particles was estimated from the SEM micrographs (100 particles were measured) using the ImageJ 1.52d software (Bethesda, MD, USA).
Figure 5.Specific surface area of the Cu2O samples—N2adsorption measurements (BET).
3. Materials and Methods 3.1. Materials
In the syntheses, copper (II) chloride dihydrate (CuCl22H2O, Alfa Aesar, Karlsruhe, Germany, 99+%) was used as precursor. As stabilization agent, ethylenediaminetetraacetic acid (EDTA, C10H16N2O8, Molar, Halásztelek, Hungary, 99.5%) was used. Additionally, sodium hydroxide—NaOH (Molar, Halásztelek, Hungary, 99.98%) was used as precipita- tion agent andD-(+)-glucose (Acros Organics, Morris Plains, NJ, USA, 99%),D-(+)-fructose (Alfa Aesar, Kandel, Germany, 98+%),D-(+)-xylose (Alfa Aesar, Kandel, Germany, 98+%),D- (+)-galactose (VWR, Radnor, PA, USA, 98+%) andD-(+)-arabinose (Sigma Aldrich, St Louis, MO, USA≥99%) as reducing agents. For the purification step, Milli-Q water and acetone (VWR,≥99.5%) were used. All the chemicals were used without further purification.
3.2. Characterization Methods
X-ray diffractograms (XRD) were acquired by a Rigaku Miniflex II diffractometer (Prague, Czech Republic) using Cu-Kαradiation (λ= 1.5406 Å), equipped with a graphite monochromator. Data points were taken in the 2θ◦ = 20–80◦ range at a scan speed of 1·(2θ◦)·min−1[42].
Scanning electron microscopy (SEM) micrographs were recorded with a Hitachi S-4700 Type II FE-SEM (Tokyo, Japan) instrument, which operates using a cold field emission gun (5–15 kV). The size distribution of the particles was estimated from the SEM micrographs (100 particles were measured) using the ImageJ 1.52d software (Bethesda, MD, USA).
A JASCO-V650 (USA, Portland) spectrophotometer with an integration sphere (ILV- 724) was used for measuring the diffuse reflectance spectroscopy (DRS) spectra of the samples (λ= 300–800 nm). The possible electron transitions were evaluated by plotting dR/dλvs. λ, where R is the reflectance andλis the wavelength [43], while the indirect band gap of the photocatalysts was determined via the Kubelka–Munk method [44].
The N2adsorption experiments (BET) were performed to calculate the specific surface areas of the samples, for which a BELCAT-A (Osaka, Japan)device was used to record the isotherms at 77 K.
3.3. Assessment of the Photocatalytic Efficiencies
A photoreactor system with 4×24 W visible light lamps (irradiation time = 120 min) was used to measure the photocatalytic activities. The reactor was thermostated at 25◦C us- ing 1 M NaNO2, to eliminate any UV irradiation. The photocatalyst suspension containing
Molecules2021,26, 1149 7 of 9
the pollutant (initial concentration of methyl orange (MO) C0,MO= 30µM; catalyst content Cphotocatalyst= 1.0 g·L−1; total volume of the suspension Vsusp= 100 mL) was continuously purged with air to keep the concentration of dissolved oxygen constant during the whole experiment. The concentration decrease of the organic substrate was followed using an Agilent 8453 spectrophotometer (Agilent Technologies, Waldbronn, Germany) at 464 nm.
It is important to mention that the photolysis of MO under the applied conditions was negligible [11].
4. Conclusions
Cu2O semiconductor photocatalysts were prepared under the influence of five differ- ent reducing sugars. The differences in optical properties, crystal structure, and photocat- alytic activity of the samples were highlighted by examining the effect of the reducing sugars.
It seems that the particle size distribution was the most sensitive to the induced differ- ences in the reaction mixture. The reducing agents used caused a wide size distribution spectrum of the particles from 250 nm to 2.5µm. For each sample, usually a ~1.2µm size was determined.
A significant difference can be observed as a function of the number of carbon atoms in the reducing sugars: using reducing agents containing five carbon atoms, a new peak appears at 722 nm in the first-order-derivative of the DRS spectra. This peak is assigned to the localized surface plasmon resonance (LSPR) of the Cu2O particles, which is also related to the degree of crystallinity, as this peak appeared in the spectra of the highly crystalline samples. The change in the ratio of the conduction- (at 639 nm) and the exciton bands (at 595 nm) and the change in the specific surface area of copper(I) oxide particles explains the magnitude of the photocatalytic excitability. Moreover, in spite of the low specific surface area, a very high adsorption of MO and a high photoactivity were observed, pointing out the importance of the surface quality pointed out by the DRS spectra of the samples.
Author Contributions: Conceptualization, S.F.; Formal analysis, L.B.; Funding acquisition, K.H.
and Z.P.; Investigation, K.B., S.F.; Methodology, G.K., L.B.; Project administration, K.H. and Z.P.;
Supervision, K.H. and Z.P.; Visualization, S.F.; Writing—original draft, S.F.; Writing—review and editing, L.B.; G.K., K.H. and Z.P. All authors have read and agreed to the published version of the manuscript.
Funding:S.F. acknowledges the financial support of “GINOP-2.3.2-15-2016-00013”, NTP-NFTÖ-20- B-0328 and NKFI-K-124212 projects and Z.P. acknowledges the financial support of the Premium postdoctoral fellowship and the Bolyai János Fellowship of the Hungarian Academy of Sciences.
Institutional Review Board Statement:Not applicable.
Informed Consent Statement:Not applicable.
Data Availability Statement:Not applicable.
Acknowledgments:The authors would like to acknowledge the help of Niharika Sharma for carrying out a part of the synthesis section.
Conflicts of Interest:The authors declare no conflict of interest.
Sample Availability:Not available.
References
1. Herrmann, J.M. Photocatalysis fundamentals revisited to avoid several misconceptions.Appl. Catal. B Environ.2010,99, 461–468.
[CrossRef]
2. Herrmann, J.M. Heterogeneous photocatalysis: Fundamentals and applications to the removal of various types of aqueous pollutants.Catal. Today1999,53, 115–129. [CrossRef]
3. Vilar, V.J.P.; Amorim, C.C.; Brillas, E.; Puma, G.L.; Malato, S.; Dionysiou, D.D. AOPs: Recent advances to overcome barriers in the treatment of water, wastewater and air.Environ. Sci. Pollut. Res.2017,24, 5987–5990. [CrossRef]
4. Mondal, C.; Ganguly, M.; Pal, J.; Roy, A.; Jana, J.; Pal, T. Morphology controlled synthesis of SnS2nanomaterial for promoting photocatalytic reduction of aqueous Cr(VI) under visible light.Langmuir2014,30, 4157–4164. [CrossRef]
Molecules2021,26, 1149 8 of 9
5. Zhang, S. Preparation of controlled-shape ZnS microcrystals and photocatalytic property. Ceram. Int. 2014,40, 4553–4557.
[CrossRef]
6. Cheng, H.; Huang, B.; Dai, Y. Engineering BiOX (X = Cl, Br, I) nanostructures for highly efficient photocatalytic applications.
Nanoscale2014,6, 2009–2026. [CrossRef]
7. García-Pérez, U.M.; Martínez-De La Cruz, A.; Peral, J. Transition metal tungstates synthesized by co-precipitation method: Basic photocatalytic properties.Electrochim. Acta2012,81, 227–232. [CrossRef]
8. Wan, X.; Wang, Y.; Jin, H.; Ning, Z. Morphology transformation of Cu2O particles for photocatalytic degradation organic wastewater: First-principles calculation.Ceram. Int.2019,45, 21091–21098. [CrossRef]
9. Almeida, M.; Alcácer, L. Growth of large single crystals of triethylammonium BIS-tetracyanoquinodimethane—TEA (TCNQ)2.
J. Cryst. Growth1983,62, 183–188. [CrossRef]
10. Chen, K.; Xue, D. Crystallisation of cuprous oxide.Int. J. Nanotechnol.2013,10, 4. [CrossRef]
11. Fodor, S.; Baia, L.; Focs,an, M.; Hernádi, K.; Pap, Z. Designed and controlled synthesis of visible light active copper(I)oxide photocatalyst: From cubes towards the polyhedrons—With Cu nanoparticles.Appl. Surf. Sci.2019,484, 175–183. [CrossRef]
12. Abdullah, H.; Kuo, D.H.; Chen, Y.H. High-efficient n-type TiO2/p-type Cu2O nanodiode photocatalyst to detoxify hexavalent chromium under visible light irradiation.J. Mater. Sci.2016,51, 8209–8223. [CrossRef]
13. Tomar, L.J.; Desai, R.K.; Chakrabarty, B.S. Study of optical properties of hydrothermally synthesized Cu/Cu2O/CuO nanocrystals.
AIP Conf. Proc.2013,1536, 245–246. [CrossRef]
14. Yin, M.; Wu, C.-K.; Lou, Y.; Burda, C.; Koberstein, J.T.; Zhu, Y.; O’Brien, S. Copper Oxide Nanocrystals.J. Am. Chem. Soc.2005, 127, 9506–9511. [CrossRef]
15. Lu, Q.; Yu, Y.; Ma, Q.; Chen, B.; Zhang, H. 2D Transition-Metal-Dichalcogenide-Nanosheet-Based Composites for Photocatalytic and Electrocatalytic Hydrogen Evolution Reactions.Adv. Mater.2016,28, 1917–1933. [CrossRef] [PubMed]
16. Salavati-Niasari, M.; Banaiean-Monfared, G.; Emadi, H.; Enhessari, M. Synthesis and characterization of nickel sulfide nanoparti- cles via cyclic microwave radiation.Comptes Rendus Chim.2013,16, 929–936. [CrossRef]
17. Kumar, A.; Saxena, A.; De, A.; Shankar, R.; Mozumdar, S. Facile synthesis of size-tunable copper and copper oxide nanoparticles using reverse microemulsions.RSC Adv.2013,3, 5015–5021. [CrossRef]
18. Oluyamo, S.S.; Nyagba, M.S.; Ambrose, S.; Ojo, S. Optical Properties of Copper (I) Oxide Thin Films Synthesized by SILAR Technique.IOSR J. Appl. Phys.2014,6, 102–105. [CrossRef]
19. Musza, K.; Szabados, M.;Ádám, A.A.; Kónya, Z.; Kukovecz,Á.; Sipos, P.; Pálinkó, I. Ball Milling of Copper Powder Under Dry and Surfactant-Assisted Conditions—On the Way Towards Cu/Cu2O Nanocatalyst.J. Nanosci. Nanotechnol.2018,19, 389–394.
[CrossRef]
20. Liu, J.; Xue, D. Thermal oxidation strategy towards porous metal oxide hollow architectures.Adv. Mater.2008,20, 2622–2627.
[CrossRef]
21. Coutanceau, C.; Urchaga, P.; Brimaud, S.; Baranton, S. Colloidal Syntheses of Shape- and Size-Controlled Pt Nanoparticles for Electrocatalysis.Electrocatalysis2012,3, 75–87. [CrossRef]
22. Boutonnet, M.; Kizling, J.; Stenius, P.; Maire, G. The preparation of monodisperse colloidal metal particles from microemulsions.
Colloids Surf.1982,5, 209–225. [CrossRef]
23. Barroso, F.; De Dios, M.; Tojo, C.; Blanco, M.C.; López-Quintela, M.A. A computer simulation study on the influence of the critical nucleus on the mechanism of formation of nanoparticles in microemulsions.Colloids Surf. A Physicochem. Eng. Asp.2005,270–271, 78–82. [CrossRef]
24. De Dios, M.; Barroso, F.; Tojo, C.; Blanco, M.C.; López-Quintela, M.A. Effects of the reaction rate on the size control of nanoparticles synthesized in microemulsions.Colloids Surf. A Physicochem. Eng. Asp.2005,270–271, 83–87. [CrossRef]
25. Eriksson, S.; Nylén, U.; Rojas, S.; Boutonnet, M. Preparation of catalysts from microemulsions and their applications in heteroge- neous catalysis.Appl. Catal. A Gen.2004,265, 207–219. [CrossRef]
26. Jiang, D.; Xing, C.; Liang, X.; Shao, L.; Chen, M. Synthesis of cuprous oxide with morphological evolution from truncated octahedral to spherical structures and their size and shape-dependent photocatalytic activities.J. Colloid Interface Sci.2016,461, 25–31. [CrossRef] [PubMed]
27. Chen, K.; Song, S.; Xue, D. Faceted Cu2O structures with enhanced Li-ion battery anode performances.CrystEngComm2015,17, 2110–2117. [CrossRef]
28. Liu, Q.M.; Yasunami, T.; Kuruda, K.; Okido, M. Preparation of Cu nanoparticles with ascorbic acid by aqueous solution reduction method.Trans. Nonferrous Met. Soc. China2012,22, 2198–2203. [CrossRef]
29. Wang, Y.; Zhou, K. Effect of OH−on morphology of Cu2O particles prepared through reduction of Cu(II) by glucose.J. Cent.
South Univ.2012,19, 2125–2129. [CrossRef]
30. Liu, F.; Wu, J.; Chen, K.; Xue, D. Morphology Study by Using Scanning Electron Microscopy.Education2010, 1781–1792. [CrossRef]
31. Cao, Y.; Wang, Y.J.; Zhou, K.G.; Bi, Z. Morphology control of ultrafine cuprous oxide powder and its growth mechanism.Trans.
Nonferrous Met. Soc. China2010,20, s216–s220. [CrossRef]
32. Dong, Y.; Li, Y.; Wang, C.; Cui, A.; Deng, Z. Preparation of cuprous oxide particles of different crystallinity.J. Colloid Interface Sci.
2001,243, 85–89. [CrossRef]
Molecules2021,26, 1149 9 of 9
34. Kumbhar, P.; Sawant, J.; Ghosalkar, A. Catalysis for Renewable Chemicals. InIndustrial Catalytic Processes for Fine and Specialty Chemicals; Elsevier: Amsterdam, The Netherlands, 2016; pp. 597–662. ISBN 9780128014578.
35. Hutter, E.; Fendler, J.H. Exploitation of localized surface plasmon resonance.Adv. Mater.2004,16, 1685–1706. [CrossRef]
36. Lan, T.; Fallatah, A.; Suiter, E.; Padalkar, S. Size controlled copper (I) oxide nanoparticles influence sensitivity of glucose biosensor.
Sensors2017,17, 1944. [CrossRef] [PubMed]
37. van der Stam, W.; Berends, A.C.; de Mello Donega, C. Prospects of Colloidal Copper Chalcogenide Nanocrystals.ChemPhysChem 2016,17, 559–581. [CrossRef]
38. Zhao, Y.; Pan, H.; Lou, Y.; Qiu, X.; Zhu, J.; Burda, C. Plasmonic Cu2−xS nanocrystals: Optical and structural properties of copper-deficient copper(I) sulfides.J. Am. Chem. Soc.2009,131, 4253–4261. [CrossRef] [PubMed]
39. Kazimierczuk, T.; Fröhlich, D.; Scheel, S.; Stolz, H.; Bayer, M. Giant Rydberg excitons in the copper oxide Cu2O.Nature2014,514, 343–347. [CrossRef] [PubMed]
40. Kavoulakis, G.; Chang, Y.C.; Baym, G. Fine structure of excitons in CuO2. Phys. Rev. B Condens. Matter Mater. Phys.1997,55, 7593–7599. [CrossRef]
41. Borgohain, K.; Murase, N.; Mahamuni, S. Synthesis and properties of Cu2O quantum particles.J. Appl. Phys.2002,92, 1292–1297.
[CrossRef]
42. Flak, D.; Braun, A.; Mun, B.S.; Park, J.B.; Parlinska-Wojtan, M.; Graule, T.; Rekas, M. Spectroscopic assessment of the role of hydrogen on surface defects, on the electronic structure and transport properties of TiO2, ZnO and SnO2nanoparticles.Phys.
Chem. Chem. Phys.2013,15, 1417–1430. [CrossRef] [PubMed]
43. Kubelka, P. Ein Beitrag Zur Optik Der Farbanstriche.Z. Tech. Phys.1931,12, 593–601.
44. Wang, G.; van den Berg, R.; de Mello Donega, C.; de Jong, K.P.; de Jongh, P.E. Silica-supported Cu2O nanoparticles with tunable size for sustainable hydrogen generation.Appl. Catal. B Environ.2016,192, 199–207. [CrossRef]