APPLICATION OF FLEXIBLE MULTI-ELEMENTAL ICP-OES DETECTION IN FRACTIONATION OF POTENTIALLY TOXIC ELEMENT CONTENT OF SOLID ENVIRONMENTAL SAMPLES BY A
SEQUENTIAL EXTRACTION PROCEDURE
György Heltai1, Zoltán Győri2, Ilona Fekete1, Gábor Halász1, Katalin Kovács1, Anita Takács1,3, Lamlile Khumalo1, Márk Horváth1
1Szent István University, Department of Chemistry, 2100 Gödöllő, Páter K. Street 1, Hungary
2Debrecen University, Nutrition Institute, 4032, Debrecen, Egyetem Square 1., Hungary
3Department of Hydro - and Plant Ecology, Danube Research Institute, Centre for Ecological Research, Hungarian Academy of Sciences, Budapest
ABSTRACT
Remediation of areas contaminated by potentially toxic elements (PTE) requires the appropriate assessment of the environmental mobility of contaminants. The fractionation techniques developed for agrochemical and environmental purposes model the pathways of environmental mobilization mainly by sequential extraction procedures. In Europe mostly the simplified extraction scheme proposed by Community Bureau of Reference (BCR) in 1993 is widely used, why only to this certified sediment sample (BCR 701) is available, certified for fractionation of six elements (Cu, Cd, Cr, Ni, Pb, Zn). In the BCR extracts the reagent- solvents applied in leaching steps cause strong matrix interferences when for determination the PTE-contents of these solutions the multielemental capacity of inductively coupled plasma optical emission spectrometry (ICP-OES) should be utilized. Due to the different source of contamination the flexible multi-elemental ICP-OES method should be applied for analysis of the different BCR-extractant-solvent media which makes possible the reliable detection of all occurring PTE in the area. For this purpose as the most adequate solution the application of ICP-OES spectrometer with charge-coupled device (CCD)-detection was selected which is able to record the entire spectral range between 120-800 nm. On the basis of detailed study of BCR-solvent-matrix- and expected-analite-line interferences it was established that the sensitivities of the prominent lines of pollutant elements strongly depend on the type of extractants. For improving the accuracy of analytical results obtained for soils and environmental sediments, matrix matched calibration, internal standardization and robust plasma conditions were recommended and optimized. The successful application of this methodology is presented for a PTE-contamited lake sediment sample and for selected typical Hungarian soil samples stored in sample bank of Hungarian Soil Protection Information and Monitoring System.
Keywords: potentially toxic element; sequential extraction; fractionation; ICP-OES;
multielemental determination; sediments and soils.
1. INTRODUCTION
Mobility and biological impact of potentially toxic elements (PTE) is determined by the chemical speciation of these elements in the environmental systems. According to recommendation of IUPAC Committees [1] speciation means the quantitative distribution of a given element among its chemical species identifiable in the system. Total biological risk assessment in PTE-contaminated areas should be based on complete speciation of detectable
contaminant elements, however complete speciation is an impracticable analytical task, As a compromise, fractionation techniques were developed in which the solvents (reagents) modeling the pathways of environmental mobilization are applied sequentially for the extraction of PTE content of solid environmental samples as proposed by Tessier [2]. In Europe it is the simplified extraction scheme issued by Community Bureau of Reference (BCR) in 1993 and modified in 2001 that is most widely used [3, 4]. Up to now this has been only a fractionation procedure, to which certified sediment samples (BCR 601 and 701) were issued [4, 5, 6, 7, 8, 9, 10], therefore was it selected for present quality assessment studies.
In the 1st, 2nd and 3rd steps of the BCR procedure batch leaching technique is applied, the solid sediment or soil sample is shaken by the reagent-solvents for 16 hours and the extracts are separated by centrifugation respectively. By this way the chemical structures of the sediment or soil samples are gradually decomposed and the following mobility fractions of PTE can be distinguished:
1ststep: Water-soluble and carbonate-bound fraction, dissoluble in diluted acetic acid;
2ndstep: Associated with reducible Fe- and Mn-oxides, dissoluble in hydroxilamine hydrochloride;
3rdstep: Organic complexed and sulphides, dissoluble after oxidation by H2O2 in ammonium- acetate;
(+1) step: Residual fraction, soluble by digestion in oxidative acids (HNO3/H2O2, or aqua regia).
The certification is given only for the 1st, 2nd and 3rd fractions, for determination of the (+1) residual fraction and for direct analysis of PTE content of original BCR 701 CRM sample only indicative values are given for aqua regia extraction according to ISO Norm 11466 [11].
Standardization of the BCR procedure, however, has up to now been hindered by methodological problems:
The solvents applied in the BCR system do not model natural mobilization processes and do not preserve intact species forms for further speciation analysis.
The time demands of the batch leaching extraction steps is too long (4-5 days).
Certified reference material (CRM) sample which is certified for the fractionation of six elements (Cu, Cd, Cr, Ni, Pb, Zn) is available only for freshwater sediments, therefore the extension of validation for other environmental matrices (soils, rocks, ores, solid wastes) and for further PTE is limited.
The results of completion the BCR sequential extraction procedure is four solutions with the excess concentration of reagents applied in leaching steps. When for determination the PTE-contents of these solutions the multi-elemental capacity of spectrochemical analytical techniques like inductively coupled plasma optical emission spectrometry (ICP-OES) or inductively coupled plasma mass spectrometry (ICP-MS) should be utilized, we have to calculate with significant solvent-matrix interferences, which may strongly influence the reliability of analytical results.
Up to now methodological developments to improve the BCR system have been mainly focused on extraction procedures: continuous flow systems were developed [ 12, 13, 14, 15, 16,17], alternative reagents were applied [18, 19, 20, 21,22] and acceleration of batch leaching by sonication [23] or microwave treatment [24] was applied. A review of the methodological development of the BCR sequential extraction procedure was given in our previous papers [25a,b].
When the elaboration and the modification of BCR procedure was performed in 1993 and in 2001 the matrix interferences caused by the reagent content of BCR extractant-solvents during spectrochemical element detection were not systematically assessed. In those interlaboratory analytical campaigns all participating laboratories have applied their own
methodology and quality assurance individually for element analysis, and the results of different methods as applied in different laboratories were compared statistically to detect sources of methodological errors of analytical procedures [3, 4, 5, 6, 7, 8, 9, 10]. For the determination of Cu, Cd, Cr, Ni, Pb, Zn concentrations in BCR extracts flame atomic absorption spectrometry (FAAS), electrothermal atomization atomic absorption spectrometry (ETA-AAS), ICP-OES and ICP-MS methods were applied in the different laboratories and the solvent matrix interferences were mainly reduced by solvent-matrix-matched calibration and in several cases by standard addition. The calibrations were optimized for the above six elements individually and only in a few cases ICP-OES or ICP-MS multi-elemental calibration was applied.
In spite of the above methodological problems the application of BCR procedure in risk assesment of PTE-contaminations is exponentially growing. Most of the applications were elaborated for PTE contaminated sediments. Soils and other environmental matrices were less often considered, because CRM is available only for sediments to the BCR procedure.
Demand for the extension of application and validation to more PTE in other matrices (soils, rocks, sewage sluids, red mud, gravitation dust, compost, biofilm, etc.), however, is continuously growing, and for this purpose the application of robust simultaneous multi- elemental spectrochemical methods with flexible selection of analite elements seems to be the optimal choice [26-49]. Considering this trend the main goal of our recent study was to support the extension of BCR-fractionation to different solid matrices and to more PTE by means of elaboration a robust and flexible multielemental ICP-OES methodology. For this purpose the HORIBA Jobin Yvon ACTIVA-M ICP-OES spectrometer was selected which is equipped with rapid scanning charge-coupled device (CCD)-detection system and is able to record and acquisite the entire spectral range between 120-800 nm and supplied with a data base of single-element spectra with spectroscopic data under standard ICP operating conditions for 75 elements [50,51]. This data base, the instrument arrengement and operation mode provides appropriate information for multi-line selection adopted to the analytical task [52]. The program suggests more lines for each analyte that are adequate for the defined concentration range and that are not interfered by the concomitant elements when they are present at their highest expected concentration. The number of lines to be suggested, as well as sensitivity and interference filtering criteria, are user-defined. The analyte spectrum can be displayed along with those of concomitant elements and the blank spectrum. This helps in the acceptance or rejection of a line, and to determine the correct background correction positions [52]. In the users manual there are several proposal for optimal conditions for multi-elemental analysis of different type of samples (aequeos, oil, organic, salt), however such a complex task as the sequential extraction when four different aqeous solvent-matrix is applied requires additional study of matrix effects caused by BCR-extractants during multi-elemental ICP-OES determination, and a careful survey of spectral line coincidences of proposed analite lines [53, 54].
In a preliminary study BCR-solvent matrix matched multi-elemental ICP-OES calibration was applied for ten elements (Cd, Cr, Cu, Ni, Pb, Zn, Co, Fe, Mn, V) and the ICP-OES operating conditions were applied according to producer’s manual proposal to aeqeous matrices [54]
and accuracy of BCR procedure was controlled by fractionation of element content of BCR- 701 sediment CRM sample. It was established that the sensitivity of ICP-OES determinations is strongly influenced by calibration solvent matrix, and the summarized recoveries of certified concentrations of the three certificated extraction steps are acceptable for all certified elements. However in the individual extraction steps for several elements are significantly outlying from the acceptable limits [25b]. For reliable application therefore this simple matrix matched calibration was not proved satisfactory and further improvement was necessary
based on study of the extractant-solvent matrix interferences [55] and controlling the interelement analite interferences. Utilizing the possibility of whole analytical spectral range acquisition the BCR solvent blank spectra, single elemental analite element spectra in each BCR solvent and finally the multi-elemental analite spectra in each BCR solvent were recorded with expected highest concentrations. All these spectra were stored in an electronic library and then the best interference-free spectral lines were selected on the basis of a detailed comparison of these spectra for all extractant media and for all analytical lines proposed by the instrument producer. After this the multi-elemental matrix matched calibration was repeated at elevated RF-power for reduction the solvent matrix effects [49, 55] with more robust plasma conditions, and internal standardization was applied to improve the reliability. Main goal of this methodological studies was the elaboration of such multielemental ICP-OES method which is flexibly and reliably applicable for evaluation of PTE-mobility in soils and in sediments by BCR-fractionation. The successful application of this optimalized method is presented on real lake-sediment and soil samples.
2. EXPERIMENTAL
2.1. BCR Sequential Extraction Procedure and its Quality Assesment
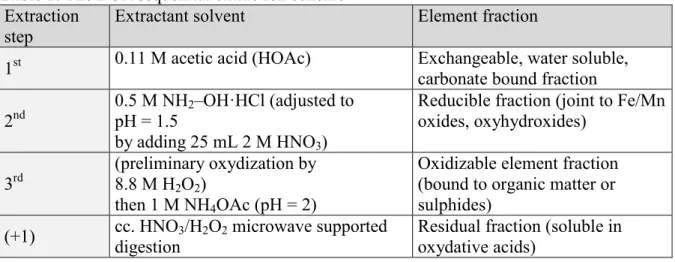
Quality assessment of BCR procedure with the CRM 701 sediment, reference sample was performed. The fractionation of its element content was performed according to the modified BCR protocol in triplicates, as described in Table 1 [10]. The 1st, 2nd and 3rd batch leaching steps were performed for 16 hours using a mechanical end-over-end shaker, at a speed of 240 ± 10 rpm, followed by centrifugation at 3000 g for 20 minutes.
Table 1. The BCR sequential extraction scheme Extraction
step
Extractant solvent Element fraction
1st 0.11 M acetic acid (HOAc) Exchangeable, water soluble, carbonate bound fraction 2nd
0.5 M NH2–OH·HCl (adjusted to pH = 1.5
by adding 25 mL 2 M HNO3)
Reducible fraction (joint to Fe/Mn oxides, oxyhydroxides)
3rd
(preliminary oxydization by 8.8 M H2O2)
then 1 M NH4OAc (pH = 2)
Oxidizable element fraction (bound to organic matter or sulphides)
(+1) cc. HNO3/H2O2 microwave supported digestion
Residual fraction (soluble in oxydative acids)
For the extraction of residual fraction in the (+1) step microwave supported cc. HNO3/H2O2
digestion was applied according to the former Hungarian Standard [56].
Total soluble element content of the CRM 701 sample was determined also by microwave supported cc. HNO3/H2O2 digestion of the original sample.
The results of microwave supported cc. HNO3/H2O2 digestion-extraction were compared with aqua regia digestion-extraction according to ISO Norm 11466 [11] and with microwave supported aqua regia digestion-extraction.
2.2. Element Analytical Instrument [54]
HORIBA Jobin Yvon ACTIVA-M ICP-OES spectrometer was employed, which is able to record the entire UV-VIS spectrum range by rapid scanning CCD detection.
Generator: radio frequency, solid-state, 40.68 MHz, water cooled, 800-1550 W.
Plasma: fully demountable torch (3 mm i.d., alumina injector) with software controlled gas flow system. The gas-flows can be set by switching between valves of fix nominal cross-flow capacity:
Plasma gas flow: P1: 12 L/min, P2: 16 L/min.
Sheath gas flow: G1: 0.3 L/min, G2: 0.5 L/min, G3: 0.7 L/min.
Auxiliary gas flow: OFF: 0 L/min, ON: 0.6 L/min.
Nebulizer gas pressure: 2.86 bar.
Sample introduction: concentric glass nebulizer, cyclonic glass spray chamber, 3 channels peristaltic pump. Aerosol transport by the sheath device (patented HORIBA Jobin Yvon system).
Optical system: thermo-regulated, 0.64 meter focal length, dual back-to-back gratings, 4343 g/mm and 2400 g/mm used in the 1st order with optical resolution <10 pm for 120-430 nm and <18 pm for 430-800 nm.
Wavelength range: 120-800 nm, reference line set by the user (C 193.026 nm, or the Ar 404.442 nm).
Detection: back thinned illuminated CCD, 2048x512 pixels (13.5x13.5 μm), Peltier cooled.
2.3. ICP-OES Operational Parameters, Optimalization of Calibration
In the first stage of this study BCR-solvent matrix matched multi-elemental calibration was applied for ten elements (Cd, Cr, Cu, Ni, Pb, Zn, Co, Fe, Mn, V) applying operational analytical parameters and lines according to producer’s manual proposed for multi-elemental analysis of environmental water samples (1st settings) [25b, 54]. Study of solvent matrix effects and spectral interferences was performed applying this 1st settings. Study of spectral interferences in the different calibration solutions is described in APPENDIX 1.
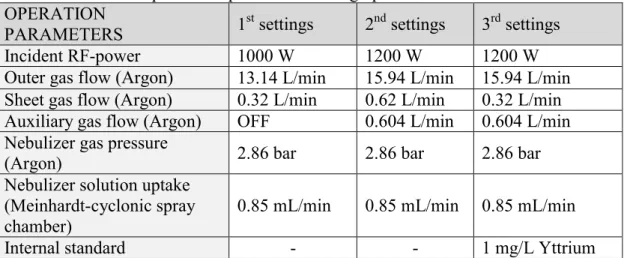
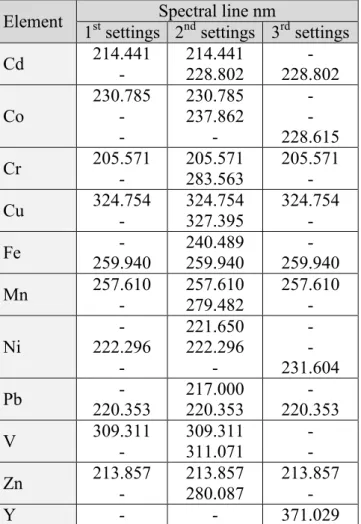
After that the matrix matched calibration was repeated at elevated RF-power and for all elements at least two analytical lines were selected (2nd settings) with gas flows proposed by producer to the applied RF-power. In 3rd settings the same RF-power was applied as in the 2nd settings but sheet gas flow was reduced and the Yttrium internal standard was applied, and interference-free analytical lines were selected for all elements (Table 2 and Table S2).
Table 2. ICP-OES operational parameters during optimalization of calibration OPERATION
PARAMETERS 1st settings 2nd settings 3rd settings
Incident RF-power 1000 W 1200 W 1200 W
Outer gas flow (Argon) 13.14 L/min 15.94 L/min 15.94 L/min Sheet gas flow (Argon) 0.32 L/min 0.62 L/min 0.32 L/min Auxiliary gas flow (Argon) OFF 0.604 L/min 0.604 L/min Nebulizer gas pressure
(Argon) 2.86 bar 2.86 bar 2.86 bar
Nebulizer solution uptake (Meinhardt-cyclonic spray
chamber) 0.85 mL/min 0.85 mL/min 0.85 mL/min
Internal standard - - 1 mg/L Yttrium
2.4. Preparation of Matrix Matched Calibration Solutions
For preparing the calibration solutions MERCK CertiPUR ICP multi-element 1.11355.0100 standard solution was used, containing elements Ag, Al, B, Ba, Bi, Ca, Cd, Co, Cr, Cu, Fe, Ga, In, K, Li, Mg, Mn, Na, Ni, Pb, Sr, Tl, Zn in 1000 mg/L concentraion. Volumes corresponding to 0, 5 and 20 mg/L concentrations were pipetted into a 50 ml volumetric flask and then diluted by solvents applied in the steps of BCR sequential extraction procedure:
1st step: 0.11 M acetic acid
2nd step: 0.5 M hydroxylamine-hydrochloride 3rd step: 1 M ammonium-acetate
(+1) step: 13 (m/m)% nitric acid 3. RESULTS
3.1. Fractionation Results Obtained with BCR-solvent Matrix Matched Multi-elemental Calibration for the Three Different Operational Settings
At producer proposed analytical line wavelengths several spectral overlapping was occurred as described in APPENDIX 1. On Figure S1, S2, S3, S4 characteristic interelemental line coincidences are presented for Cd, Co, Pb and Zn lines proposed to application. As a result of interelemental line coincidence study it was estabilished that primary producer proposed analytical lines can be used for Cr, Cu, Fe, Mn, Pb, and Zn, but low level spectral interferences occur for Zn and Pb. For Cd, Co, Ni the primary proposed lines could not be used. As an example for result of rejection of primary proposed analytical line the analytical calibration lines obtained for Cd at three different operational settings in case of different solvents are presented on Figure S5(a). For comparison on Figure S5(b) the analytical calibration lines obtained for Zn using the primary proposed lines at three different operational settings in case of different solvents are presented.
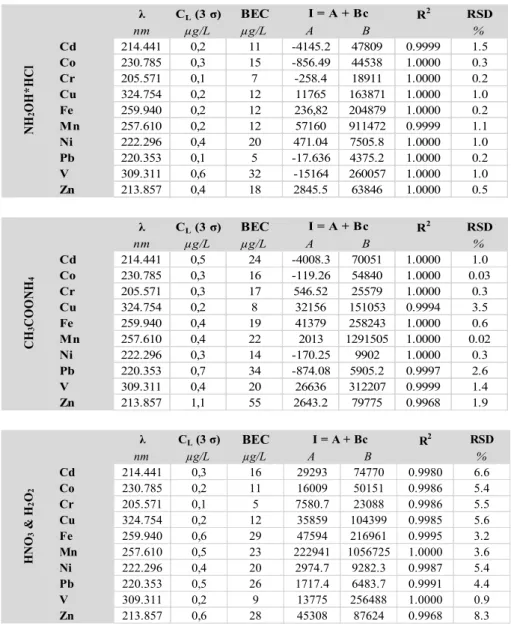
For detailed comparison the parameters of analytical calibration lines, the background equivalent concentrations (BEC) and the instrumental detection limits [LOD(3σ)] obtained for different extraction matrices at three different ICP-OES operational settings are summarized in Tables S3, S4, S5 of APPENDIX 2. Data in Table S3 of APPENDIX 2 were published earlier [25b], but as a reference for comparison is given there too.
It can be observed that the calibration solvent media strongly influences the slope of the analytical calibration lines (i.e. the B sensitivity values) at the three different operational settings. The residual standard deviation values show, that the best fitting of analytical lines was achieved at 3rd operational settings. The solvent matrix influence can be easier compared if the B sensitivity values are normalized to the (+1) step solvent [13 (m/m) % nitric acid]
while in general nitric acid medium is used in ICP-OES calibration (Table 3).
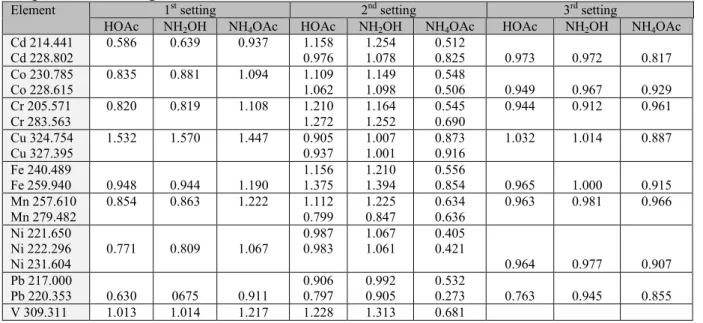
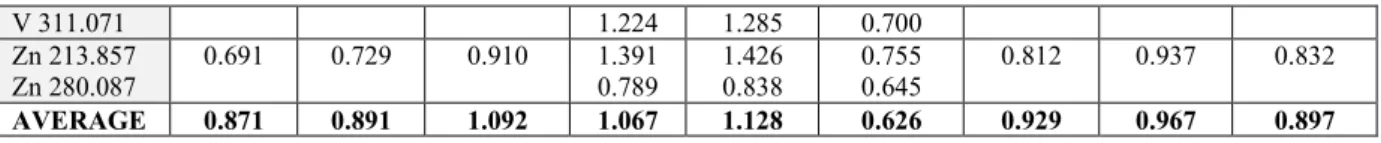
Table 3. The ratio of B sensitivity values in different extractant media related to the corresponding sensitivity values obtained in 13 (m/m) % nitric acid medium at the three operational setting.
Element 1st setting 2nd setting 3rd setting
HOAc NH2OH NH4OAc HOAc NH2OH NH4OAc HOAc NH2OH NH4OAc Cd 214.441
Cd 228.802
0.586 0.639 0.937 1.158 0.976
1.254 1.078
0.512
0.825 0.973 0.972 0.817 Co 230.785
Co 228.615
0.835 0.881 1.094 1.109 1.062
1.149 1.098
0.548
0.506 0.949 0.967 0.929 Cr 205.571
Cr 283.563
0.820 0.819 1.108 1.210 1.272
1.164 1.252
0.545 0.690
0.944 0.912 0.961 Cu 324.754
Cu 327.395 1.532 1.570 1.447 0.905
0.937 1.007
1.001 0.873
0.916 1.032 1.014 0.887 Fe 240.489
Fe 259.940 0.948 0.944 1.190 1.156
1.375 1.210
1.394 0.556
0.854 0.965 1.000 0.915 Mn 257.610
Mn 279.482
0.854 0.863 1.222 1.112 0.799
1.225 0.847
0.634 0.636
0.963 0.981 0.966 Ni 221.650
Ni 222.296
Ni 231.604 0.771 0.809 1.067
0.987 0.983
1.067 1.061
0.405 0.421
0.964 0.977 0.907 Pb 217.000
Pb 220.353 0.630 0675 0.911
0.906 0.797
0.992 0.905
0.532
0.273 0.763 0.945 0.855 V 309.311 1.013 1.014 1.217 1.228 1.313 0.681
V 311.071 1.224 1.285 0.700 Zn 213.857
Zn 280.087 0.691 0.729 0.910 1.391
0.789 1.426
0.838 0.755
0.645 0.812 0.937 0.832
AVERAGE 0.871 0.891 1.092 1.067 1.128 0.626 0.929 0.967 0.897
It can be established that at the 1st operational settings using the acetic acid and hydroxilamin-hydrocloride containing calibrant solvents significant decrease of sensitivity was obtained which mainly can be attributed to the nebulization matrix-effects [55]. On contrary the 1 M ammonium-acetate containing calibration solvent resulted in significant, but uneven increase of sensitivities for different elements. In this case probably chemical matrix interferences have overcompensated the nebulization-matrix effects.
When the incident RF-power was increased to get more robust plasma at 2nd settings the reverse situation was experienced: in the acetic acid and hydroxilamin-hydrocloride containing calibrant solvents significant, but uneven increase of sensitivities was obtained while the ammonium-acetate containing calibration solvent resulted in dramatic decrease of sensitivities for different elements. These effects probably can be attributed to change of plasma shape due to the elevated sheet gas flow, while the position of observation height is fixedly set to optimal compromise conditions by the producer.
When 3rd settings was used the sheet gas flow was reduced at elevated RF-power and Yttrium internal standard was applied. In this case the sensitivities in all three calibrant media shows more uniform picture the ratios in all cases are less than 1.000, in the case of acetic acid and hydroxilamin-hydrocloride containing calibrant solvents these differences are not significant.
At this 3rd settings the background equivalent concentrations (BEC) are minimal and change in a narrow range supporting the right selection of Yttrium internal standard. If solutions of such diverse composition should be analyzed reliably application of an internal standard is necessary.
The robustness of the three plasma operational settings was controlled by the determination of intensity ratio of magnesium ionic and atomic lines [MgII(280.271 nm)/MgI(285.213 nm)] as proposed by J.M. Mermet [57]. The results summarized in Table 4 clearly show that the robustness of plasma drastically decreased at 2nd operational settings and by the 3rd operational settings was improved related to the 1st operational settings which is proposed by the manufacturer to multi-elemental analysis of environmental water samples.
Table 4. Results of robustness control of three operational settings by determination of the MgII(280.271 nm)/MgI(285.213 nm) ionic/atomic line intensity ratio measured in different BCR extracts. (In brackets MgI 285.213 nm line/background intensity ratios are given.) BCR extractant Intensity ratio of MgII(280.271 nm)/MgI(285.213 nm) lines
1st settings 2nd settings 3rd settings
0.11 M HOAc 8 (64.7) 3 (119.3) 9 (70.9)
0.5 M NH2OH·HCl 8 (61.3) 3 (137.3) 10 (66.7)
1 M NH4 OAc 9 (64.6) 3 (55.0) 11 (66.5)
13 (m/m) % HNO3 8 (61.7) 3 (142.8) 9 (70.4)
Summarizing the above it may be concluded that improving the robustness of the plasma and elimination of matrix effects caused by the calibrant solvents is not possible by increasing the incident RF-power only while in this case the MgI 285.213 nm line/background intensity ratios were changed drastically and to achieve more robust conditions the sheet gas flow must be adopted properly.
3.2. Accuracy of fractionation applying the BCR-solvent Matrix Matched Multi- elemental Calibration
Accuracy of the above described improvement of calibration can be justified when we compare the fractionation results of the BCR-701 CRM sample applying the 1st and 3rd settings in Table 5. The measured concentrations of three repeated fractionations were compared by Student test with certified values. With the 1st operational settings at p = 1 % level in 11 case, while at p = 0.1 % level in 4 case the measured values significantly differ from the certified values. With the 3rd operational settings were no significant differences at p = 1 % level and at p = 5 % level was in 1 case significant difference (Cr 1st step).
Table 5. Average results and standard deviations of three repeated fractionation of PTE content of BCR-701 CRM sample using the 1st and 3rd ICP-OES operational settings.
Symbol * means the significant difference at p = 1 % level and symbol ** means the significant difference at p = 0.1 % level.
First setting Recovery Third setting Recovery Certified
[mg/kg] [mg/kg] [mg/kg]
1st Cd 6.45 ± 0.07 88% * 7.02 ± 0.45 96% 7.34 ± 0.35
Cr 1.88 ± 0.08 83% 3.07 ± 0.14 136% 2.26 ± 0.16
Cu 44.93 ± 0.25 91% * 50.4 ± 2.5 102% 49.3 ± 1.7
Ni 12.52 ± 0.34 81% 14.2 ± 1.0 92% 15.4 ± 0.9
Pb 1.92 ± 0.19 60% 1.97 ± 0.20 62% 3.18 ± 0.21
Zn 160 ± 4 78% * 210 ± 8 103% 205 ± 6
2nd Cd 3.96 ± 0.08 105% 3.37 ± 0.62 89% 3.77 ± 0.28
Cr 26.53 ± 0.78 58% * 43.5 ± 8.1 95% 45.7 ± 2
Cu 87.61 ± 0.81 71% ** 105 ± 20 85% 124 ± 3
Ni 19.55 ± 0.35 73% * 26.7 ± 4.7 100% 26.6 ± 1.3
Pb 92.2 ± 2.24 73% * 111 ± 18 88% 126 ± 3
Zn 98.8 ± 2.27 87% 106 ± 17 93% 114 ± 5
3rd Cd 1.17 ± 0.01 435% ** 0.34 ± 0.07 126% 0.27 ± 0.06
Cr 196.41 ± 8.24 137% 137 ± 35 96% 143 ± 7
Cu 63.59 ± 2.92 115% 76.1 ± 14.4 138% 55.2 ± 4
Ni 24.49 ± 0.35 160% * 17.9 ± 3.7 117% 15.3 ± 0.9
Pb 60.14 ± 0.82 647% ** 11.9 ± 2.5 128% 9.3 ± 2
Zn 66.44 ± 0.62 145% ** 45.5 ± 9.1 99% 45.7 ± 4
(+1) Cd 1.38 ± 0.01 0.14 ± 0.03
Cr 101 ± 4.79 80.1 ± 3.5
Cu 49.48 ± 1.92 32.1 ± 0.1
Ni 44.50 ± 1.36 32.3 ± 1.2
Pb 12.77 ± 0.30 6.17 ± 0.22
Zn 127 ± 1.36 73.7 ± 2.1
pseudo Cd 9.64 ± 0.12 8.47 ± 0.53
total Cr 291 ± 6.87 233 ± 12
Cu 258 ± 3.98 211 ± 17
Ni 77.30 ± 1.28 72 ± 5
Pb 158 ± 3.32 108 ± 10
Zn 418 ± 8.73 343 ± 18
With the operational parameters of third setting the fractionation of PTE content of BCR-701 CRM sample was performed in three repeation using:
(1) aqua regia digestion-extraction according to ISO Norm 11466 [11], (2) microwave supported aqua regia digestion-extraction,
(3) microwave supported cc. HNO3/H2O2 digestion-extraction
for determination of residual (+1) fraction and pseudototal fraction. The summaries of the Σ[1st+2nd+3rd+(+1) fractions were compared with the pseudototal fractions statistically, there were no significant differences in the three above cases. On Figures S6(a) and S6(b) this comparison presented graphically for Cr and Ni.
3.3. Application for real samples PTE-contaminated lake sediment
In our previous paper [25a] was published a longterm study of transformation of potentially toxic element pollution in a lake system Gödöllő by means of BCR-fractionation procedure.
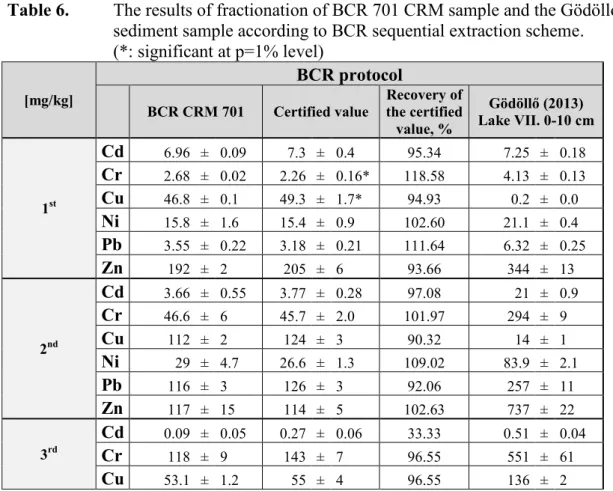
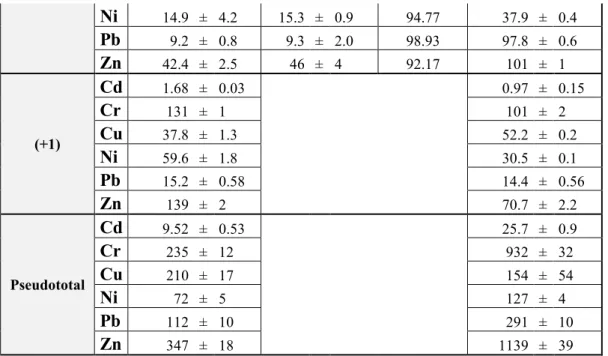
In Table 6 is presented the fractionation results of one of the most polluted sediment sample (Gödöllő-Lake VII. 0-10 cm layer) and the BCR CRM 701 sample. The reliability of the optimized ICP-OES method for evaluation of environmental mobility of PTE-pollution was controlled by the simultaneously performed fractionation of the BCR CRM 701 sample [25a].
Table 6. The results of fractionation of BCR 701 CRM sample and the Gödöllő-lake sediment sample according to BCR sequential extraction scheme.
(*: significant at p=1% level)
[mg/kg]
BCR protocol
BCR CRM 701 Certified value Recovery of the certified value, %
Gödöllő (2013) Lake VII. 0-10 cm
1st
Cd 6.96 ± 0.09 7.3 ± 0.4 95.34 7.25 ± 0.18
Cr 2.68 ± 0.02 2.26 ± 0.16* 118.58 4.13 ± 0.13
Cu 46.8 ± 0.1 49.3 ± 1.7* 94.93 0.2 ± 0.0
Ni 15.8 ± 1.6 15.4 ± 0.9 102.60 21.1 ± 0.4
Pb 3.55 ± 0.22 3.18 ± 0.21 111.64 6.32 ± 0.25
Zn 192 ± 2 205 ± 6 93.66 344 ± 13
2nd
Cd 3.66 ± 0.55 3.77 ± 0.28 97.08 21 ± 0.9
Cr 46.6 ± 6 45.7 ± 2.0 101.97 294 ± 9
Cu 112 ± 2 124 ± 3 90.32 14 ± 1
Ni 29 ± 4.7 26.6 ± 1.3 109.02 83.9 ± 2.1
Pb 116 ± 3 126 ± 3 92.06 257 ± 11
Zn 117 ± 15 114 ± 5 102.63 737 ± 22
3rd
Cd 0.09 ± 0.05 0.27 ± 0.06 33.33 0.51 ± 0.04
Cr 118 ± 9 143 ± 7 96.55 551 ± 61
Cu 53.1 ± 1.2 55 ± 4 96.55 136 ± 2
Ni 14.9 ± 4.2 15.3 ± 0.9 94.77 37.9 ± 0.4
Pb 9.2 ± 0.8 9.3 ± 2.0 98.93 97.8 ± 0.6
Zn 42.4 ± 2.5 46 ± 4 92.17 101 ± 1
(+1)
Cd 1.68 ± 0.03 0.97 ± 0.15
Cr 131 ± 1 101 ± 2
Cu 37.8 ± 1.3 52.2 ± 0.2
Ni 59.6 ± 1.8 30.5 ± 0.1
Pb 15.2 ± 0.58 14.4 ± 0.56
Zn 139 ± 2 70.7 ± 2.2
Pseudototal
Cd 9.52 ± 0.53
25.7 ± 0.9
Cr 235 ± 12
932 ± 32
Cu 210 ± 17
154 ± 54
Ni 72 ± 5
127 ± 4
Pb 112 ± 10
291 ± 10
Zn 347 ± 18
1139 ± 39
Soil samples from Hungarian Soil Protection Information and Monitoring System (four different type)
In this study the applicability of BCR-fractionation for agrochemical purposes was studied using different
physical wives soil samples. For this study four samples (Sandy soil, Sandy loam soil, Loam soil and Clay soil) were selected and the information content of BCR fractionation was compared with the information content with single step extractions applied in agrochemical practice. This project is still running and hereby only the results of BCR fractionation for 11 elements are presented (Table S6). For BCR-procedure no soil CRM is available, therefore only for the pseudototal element content certified ERM-CC141 soil sample was applied for quality assessment (Table 7). These data clearly show that the BCR-procedure with the optimized ICP-OES element detection reliably applicable for agricultural soil analysis and the number of analite elements can be increased, accordingly with the agrochemical interest (Al, Ca, Fe, K, Mg, Mn, Na)
Table 7. Measured pseudototal PTE concentrations and certified concentrations of a soil CRM sample.
LOAM SOIL Measured value Certified value
ERM-CC141 [mg/kg] [mg/kg]
Cd 214.441 nm 0,25 ± 0,03 0,25 ± 0,04 Cr 205.571 nm 37,7 ± 1,8 31 ± 4 Cu 324.754 nm 9,9 ± 0,6 12,4 ± 0,9
Mn 257.610 nm 324 ± 16 387 ± 17
Ni 222.296 nm 13,9 ± 1,7 21,9 ± 1,6 Pb 220.353 nm 27,0 ± 2,11 32,2 ± 1,4 Zn 213.857 nm 40,3 ± 3,6 50 ± 4
4. CONCLUSION
It can be concluded that optimalization of the flexible multielemental calibration for various solvent matrices gained by BCR-sequential extraction is necessary even when we apply it for fractionation of PTE content of freshwater-lake sediments. In this case the reliability of the fractionation results can be strictly controlled by simultaneous fractionation of BCR CRM 701 sample as it seems in Table 6. This procedure was successfully applied for controlling the remediation of PTE contaminated lakes like the Gödöllő-lake system [25a, 15, 22, 48]. For characterization of environmental mobility of PTE, and other micro- and macroelement content of soils the optimalized ICP-OES method can be applied successfully too. In these case the lack of soil CRM certified for BCR-fractionation does not make possible the strict control of accuracy of 1st, 2nd, and 3rd BCR-extraction step, only the pseudototal element content can be controlled by analysis of appropriate soil CRM samples. The reliability in this case can be evaluated on the basis of comparison of the sum of [1st+2nd+3rd+(+1)] fractions with the certificated pseudototal values. This comparison for data presented in Table S6 has shown an acceptable agreement. The application of BCR-fractionation for different type soil seems to be advantageous related to single step extraction procedures applied in agrochemical practice [56]. By this way about the biologically available PTE content can be characterized better and relationships with the soil properties can be also estimated. For example the influence of lime content, Fe-and Mn-oxides, and the humus content for mobilization/immobilization processes can be evaluated. This question is the subject of our ongoing project in this field. Recently this methodology is being applied for study of PTE- and radionuclide migration in a spoil area of the abandoned Uranium mine in Hungary too.
ACKNOWLEDGEMENT
This work was supported the Hungarian Scientific Research Fund (OTKA 108558, 118101).
This research was supported by the Higher Education Institutional Excellence Program (1783- 3/2018/FEKUTSTRAT) awarded by the Ministry of Human Capacities within the framework of water related researches of Szent István University.
REFERENCES
[1.] Templeton D.M., Ariese F., Cornelis R., Danielsson L.G., Muntau H., Van Leeuwen H.P., Lobinski R. (2000): Guidelines for terms related to chemical speciation and fractionation of elements. Definitions, structural aspects, and methodological approaches. Pure Appl. Chem., 72, pp. 1453-1470.
[2.] Tessier A., Campbell P.G.C., Bisson M. (1979): Sequential extraction procedure for the speciation of particulate trace metals. Analytical Chemistry, 51, pp. 844-851.
[3.] Ure A.M., Quevauviller Ph., Muntau H., Griepink B. 1993, Speciation of heavy-metals in soils and sediments -- an account of the improvement and harmonization of extraction techniques undertaken under the auspices of the BCR of the Commission-of-the-European- Communities, Int. J.Envir. Anal. Chem., 51, pp.135-151.
[4.] Pueyo M., Rauret G., Lück D., Yli-Halla M., Muntau H., Quevauviller Ph., López- Sánchez J.F. (2001): Certification of the extractable contents of Cd, Cr, Cu, Ni, Pb and Zn in a freshwater sediment following a collaboratively tested and optimised three-step sequential extraction procedure, J. Envir. Monit., 3, pp. 243-250.
[5.] Commission BCR information reference materials (CRM 601), 1997. ISBN 92-828-0127- 6.
[6.] Quevauviller P., Rauret G., López-Sánchez J.F., Rubio R., Ure A., Muntau H. (1997):
Certification of trace metal extractable contents in a sediment reference material (CRM 601) following a three-step sequential extraction procedure. Sci. Total Environ., 205, pp. 223-234.
[7.] López-Sánchez J.F., Sahuquillo A., Fiedler H.D., Rubio R., Rauret G., Muntau H., Quevauviller Ph. (1998): CRM 601, A stable material for its extractable content of heavy metals, Analyst, 123, pp. 1675-1677.
[8.] Rauret G., López-Sánchez J.F., Sahuquillo A., Rubio R., Davidson C., Ure A., Quevauviller Ph. (1999), Improvement of the BCR three step sequential extraction procedure prior to the certification of new sediment and soil reference materials, J. Envir. Monit., 1, pp.
57-61.
[9.] Sahuquillo A., López-Sánchez J.F., Rubio R., Rauret G., Thomas R.P., Davidson C.M., Ure A.M. (1999): use of a certified reference material for extractable trace metals to assess sources of uncertainty in the BCR three-stage sequential extraction procedure. Anal. Chim.
Acta, 382, pp. 317-327.
[10.] Rauret G., López-Sánchez J.F., Lück D., Yli-Halla M., Muntau H., Quevauviller Ph.
(2001), European Commission BCR information reference materials (BCR 701), ISBN 92- 894-0755-7.
[11.] Soil quality -- Extraction of trace elements soluble in aqua regia, ISO 11466:1995 [12.] Shiowatana J., Tantidanai N., Noobkaew S., Nacapricha D. (2001), A novel continuous- flow sequential extraction procedure for metal speciation in solids, J. Environ. Qual., 30, pp.1195-1205.
[13.] Frenzel W., Jimoh M. and Miro M. (2005), Hyphenated microanalytical systems for on- line and in-situ Fractionation and leaching kinetics of heavy metals in solid environmental samples. CHEM ANAL-WARSAW, 50, pp.279-299.
[14.] Heltai Gy., Percsich K., Fekete I., Barabás B., Józsa T. (2000), Speciation of waste water sediments. Microchem. J., 67, pp. 43-51.
[15.] Heltai G., Remeteiová D., Horváth M., Széles É., Halász G., Fekete I. and Flórián K.
(2011), Various fractionation procedures in study of heavy metals mobility in the environment. Ecological Chemistry and Engineering S Vol. 18, No. 1, pp. 55-65.
[16.] Spivakov B.Y., Maryutina T.A., Fedotov P.S., Ignatova S.N., Katasonova O.N., Dahmen J., Wennrich R. (2002), Separation of substances in rotating coiled columns: From trace elements to microparticles. JOURNAL OF ANALYTICAL CHEMISTRY, 57, pp.928- 934.
[17.] Fedotov P.S. (2012), Rotating coiled columns in the speciation analysis of natural samples: Dynamic fractionation of element forms in soils, sludges, and bottom sediments.
JOURNAL OF ANALYTICAL CHEMISTRY, 67, pp.399-413.
[18.] Okoro H.K., Fatoki O.S., Adekola F.A., Ximba B.J., Snyman R.G. (2012), A Review of Sequential Extraction Procedures for Heavy Metals Speciation in Soil and Sediments. OMICS Publishing Group 1: 181. doi: 10.4172/scientificreports.181 ISSN 2249–9695
[19.] Jena V., Gupta S., Dhundhel R. S., Matic N., Frančišković Bilinski S. and Devic N.
(2013), Determination of total heavy metal by sequential extraction from soil. Int. J. Res.
Environ. Sci. Technol. 3(1), pp. 35-38.
[20.] Zimmerman A. J. and Weindorf D. C. (2010), HeavyMetal and TraceMetal Analysis in Soil by Sequential Extraction: A Review of Procedures. International Journal of Analytical Chemistry Volume 2010, Article ID 387803, 7 pages, doi:10.1155/2010/387803
[21.] Sepahvand H. and Forghani A. (2012), Comparison of two sequential extraction procedures for the fractionation of zinc in agricultural calcareous soils, Chemical Speciation and Bioavailability, 24(1), pp. 13-22.
[22.] Heltai Gy., Fehér B., Percsich K., Barabás B., Fekete I. (2002), Application of sequential extraction with supercritical CO2, subcritical H2O, and an H2O/CO2 mixture for estimation of environmentally mobile heavy metal fractions in sediments, Anal. Bioanal. Chem., 373, pp.
863–866.
[23.] Rusnák R., Halász G., Horváth M., Remeteiová D. (2010), Preliminary results on the intensification of the BCR sequential extraction with sonication for sediments, soils, and gravitation dust sediment samples. Toxicological & Environmental Chemistry, 92(3), pp. 443- 452.
[24.] Nakazato T., Akasaka M. and Tao H. (2006), A rapid fractionation method for heavy metals in soil by continuous-flow sequential extraction assisted by focused microwaves.
ANAL BIOANAL CHEM, 386, pp.1515-1523.
[25.a] Heltai Gy., Győri Z., Fekete I., Halász G., Kovács K., Takács A., Boros N., Horváth M. (2018), Longterm study of transformation of potentially toxic element pollution in soil/water/sediment systembymeans of fractionationwith sequential extraction procedures.
Microchemical Journal 136 pp. 85–93.
[25.b] Heltai Gy., Fekete I., Halász G., Kovács K., Horváth M., Takács A., Boros N., Győri Z.
(2015), Mult-elemental inductively coupled plasma – optical emission spectroscopic calibration problems for sequential extraction procedure of fractionation of heavy metal content from aquatic sediments. Hungarian Journal of Industry and Chemistry, 43(1), pp.7-12.
[26.] Gleyzes C., Tellier S., Astruc M. (2002), Fractionation studies of trace elements in contaminated soils and sediments: a review of sequential extraction procedures. Trends Anal.
Chem., 21, pp. 451-467.
[27.] Sahuquillo A., Rigol A., Rauret G. (2003), Overview of the use of leaching/extraction tests for risk assessment of trace metals in contaminated soils and sediments. Trends Anal.
Chem., 22, pp. 152-159.
[28.] Žemberyová M., Barteková J., Hagarová I. (2006), The utilization of modified BCR three-step sequential extraction procedure for the fractionation of Cd, Cr, Cu, Ni, Pb and Zn in soil reference materials of different origins. Talanta, 70, pp. 973-978.
[29.] Kubová J., Matúš P., Hagarová I., Bujdoš M., Medved’ J. (2008), Utilization of optimized BCR three-step sequential and dilute HCl single extraction procedures for soil–
plant metal transfer predictions in contaminated lands. Talanta, 75, pp. 1110-1122.
[30.] Kubová J., Streško V., Bujdoš M., Matúš P., Medved’ J. (2004), Fractionation of various elements in CRMs and in polluted soils. Anal. Bioanal. Chem., 379, pp. 108-114.
[31.] Konradi E. A., Frentiu T., Ponta M. and Cordos E. (2005), Use of Sequential Extraction to Assess Metal Fractionation in Soils from Bozanta Mare, Romania. Acta Universitatis Cibiniensis Seria F Chemia 8(2005-2), pp.5-12
[32.] Barajas-Aceves M., Camarillo-Ravelo D. and Rodriguez-Vazquez R. (2015), Mobility and Translocation of Heavy Metals from Mine Tailings in Three Plant Species after Amendment with Compost and Biosurfactant. Soil and Sediment Contamination, 24(3), pp.
223-249.
[33.] Qasim B. and Motelica-Heino M. (2014), Potentially toxic element fractionation in technosoils using two sequential extraction schemes. Environmental Science and Pollution Research, 21(7), pp.5054-5065.
[34.] Wisotzky F. and Cremer N. (2003), Sequential extraction procedure in columns – Part 1:
Development and description of a new method. Environ. Geol. 44 pp.799-804.
[35.] Heltai Gy., Percsich K., Halász G., Jung K., Fekete I. (2005), Estimation of ecotoxicological potential of contaminated sediments based on a sequential extraction procedure with supercritical CO2 and subcritical H2O solvents. Microchem. J., 79, pp.231–
237.
[36.] Heltai G. (2005), Chemical interpretation of a new sequential extraction scheme based on supercritical CO2 and subcritical H2O solvents, Bulletin of the Szent István University, pp.107-122.
[37.] Dabek-Zlotorzynska E., Kelly M., Chen H., Chakrabarti C.L. (2005), Application of capillary electrophoresis combined with a modified BCR sequential extraction for estimating of distribution of selected trace metals in PM2.5 fractions of urban airborne particulate matter, Chemosphere, 58, pp. 1365-1376.
[38.] Chomchoe R., Shiowatana J., Pongsaku P. (2002), Continuous-flow system for reduction of metal readsorption during sequential extraction of soil. ANAL CHIM ACTA, 472, pp.147-159.
[39.] Tongtavee N., Shiowatana J, McLaren R.G., Buanuam J.(2005), Evaluation of distribution and chemical associations between cobalt and manganese in soils by continuous- flow sequential extraction. COMMUN SOIL SCI PLAN, 36, pp.2839-2855.
[40.] Horváth M., Boková V., Heltai G., Flórián K., Fekete I. (2010), Study of application of BCR sequential extraction procedure for fractionation of heavy metal content of soils, sediments and gravitation dusts, Toxicol. Environ. Chem., 92 (3), pp. 429-441.
[41.] Horváth M., Halász G., Kucanová E., Kuciková B., Fekete I., Remeteiová D., Heltai Gy., Flórián K. (2013), Sequential extraction studies on aquatic sediment and biofilm samples for the assessment of heavy metal mobility. Microchem. J., 107, 121-125.
[42.] Fedotov P.S., Spivakov B.Y. (2008), Static and dynamic methods of fractionation of forms of the elements in soils, silts and bottom sediments. USP KHIM, 77, pp.690-703.
[43.] Larios R., Fernandez-Martinez R., Rucandio I. (2012), Comparison of three sequential extraction procedures for fractionation of arsenic from highly polluted mining sediments.
ANAL BIOANAL CHEM, 402, pp.2909-2921.
[44.] Savonina E.Z., Fedotov P.S., Wennrich R. (2012), Fractionation of Sb and As in soil and sludge samples using different continuous-flow extraction techniques. ANAL BIOANAL CHEM, 403, pp.1441-1449.
[45.] Ogundiran M.B., Osibanjo O. (2009), Mobility and speciation of heavy metals in soils impacted by hazardous waste. Chemical Speciation and Bioavailability. 21(2), pp.59-69.
[46.] Győri Z., Alapi K., Sipos P., Zubor Á. (2003a), Effects of heavy metal on floodplain soils and pastures of the River Tisza, Hungary II. In Natural Attenuation of Metals Along the Tisza River–Floodplain–Wetlands Continuum (pp. 161–163). Debreceni Egyetem, Debrecen.
[47.] Győri Z., Alapi K., Szilágyi Sz.(2003b), Effects of heavy metal on floodplain soils and pastures of the River Tisza, Hungary I. In Natural Attenuation of Metals Along the Tisza River–Floodplain–Wetlands Continuum (pp. 146–160). Debreceni Egyetem, Debrecen.
[48.] Heltai Gy., Fekete I., Gémesi Z., Percsich K., Flórián K., Tarr Zs. (1998), Environmental evaluation of a local lake chain affected by wastewater by means of spectrochemical analytical methods. Microchem. J., 59, pp. 125-135.
[49.] Moore G.L. (1989). Introduction to Inductively Coupled Plasma Atomic Emission Spectrometry. Analytical Spectroscopy Library – Volume3., ELSEVIER, Amsterdam- Oxford-New York-Tokyo 1989., pp.287-307.
[50.] Mermet J.M., Cosnier A., Danthez Y., Dubuisson C., Fretel E., Rogérieux O., Vélasquez S. (2005) Design criteria for ICP spectrometry using advanced optical and CCD technology.
Spectroscopy. 20(2), 60–8.
[51.] Danthez Y., Dubuisson C., Fretel E., Mermet J.M., Rogérieux O. (2005) A dedicated spectra database for multiline selection in ICP-AES. Spectroscopy, Special Issue, Applications of ICP and ICP-MS Techniques for Today’s Spectroscopists 2005, 14–19.
[52.] Mermet J.M., Cosnier A., Fretel E., Vélasquez S., Grigoriev A., Dubuisson C. (2006) Multiline analysis: a key technique to enhance reliability in ICP-AES. Spectroscopy, Special Issue, Applications of ICP and ICP-MS Techniques for Today’s Spectroscopists 2006, 34–41.
[53.] http://www.speciation.net/Database/Instruments/HORIBA-Jobin-Yvon/ACTIVAM--- CCD-ICP-Spectrometer-; i2577
54. Odile Hirsch (2007) User Manual ACTIVATM Family, HORIBA Jobin Yvon Reference 31 088 536
[55.] Mermet J.M. (1998) Revisitation of the matrix effects in inductively coupled plasma atomic emission spectrometry: the key role of the spray chamber. J. Anal. At. Spectrom., 13, pp. 419-422.
[56.] Environmental testing of soils. Determination of total and soluble toxic element, heavy metal and chromium(VI) content. MSZ 21470-50:1998
[57.] Mermet, J. M. (1991) Use of magnesium as a test element for inductively coupled plasma atomic emission spectrometry diagnostics. Anal. Chim. Acta, 250, pp. 85–94.
APPENDIX
1. STUDY OF SPECTRAL INTERFERENCES IN THE DIFFERENT CALIBRATION SOLUTIONS
To detect the interfering line coincidences the following spectra were recorded in the 185-400 nm range applying the 1st operational settings:
In 0.11 M acetic acid:
-- 5 mg /L mono-elemental Cd, Co, Cr, Cu, Fe, Mn, Ni, Pb, V, Zn solutions;
-- 5 mg/L multi-elemental (Cd, Co, Cr, Cu, Fe, Mn, Ni, Pb, V, Zn) solution.
In 0.5 M hydroxylamine-hydrochloride:
-- 5 mg dm-3 mono-elemental Cd, Co, Cr, Cu, Fe, Mn, Ni, Pb, V, Zn solutions;
-- 5 mg dm-3 multi-elemental (Cd, Co, Cr, Cu, Fe, Mn, Ni, Pb, V, Zn) solution.
In 1 M ammonium-acetate:
-- 5 mg dm-3 mono-elemental Cd, Co, Cr, Cu, Fe, Mn, Ni, Pb, V, Zn solutions;
-- 5 mg dm-3 multi-elemental (Cd, Co, Cr, Cu, Fe, Mn, Ni, Pb, V, Zn) solution.
In 13 (m/m)% nitric acid:
-- 5 mg dm-3 mono-elemental Cd, Co, Cr, Cu, Fe, Mn, Ni, Pb, V, Zn solutions;
-- 5 mg dm-3 multi-elemental (Cd, Co, Cr, Cu, Fe, Mn, Ni, Pb, V, Zn) solution.
For preparation of monoelemental solutions mono-elemental standard solution (Précis Certified Standards for ICP Spectroscopy, HORIBA Scientific, France) were used.
All these spectra were stored in an electronic library and then the best interference-free spectral lines were selected on the basis of a detailed comparison of these spectra for all calibrant media and for all analytical lines proposed by the instrument producer. The results of the detectable interferences are summarized in Table S1. These results were considered when analytical lines were selected for 3rd settings operational conditions. It can be seen that primary proposed analytical lines could be used for Cr, Cu, Fe, Mn, Pb and Zn, but in some cases one has to calculate with some low level spectral interferences (Zn, Pb). For Cd, Co, Ni and V the primary proposed lines could not be used. Some tipical overlapping are presented on Figures S1, S2, S3, S4.
Figures S1. Ni and Cd overlapping at 361 nm
Figures S2. Pb and Cu overlapping at 224 nm
0 1000 2000 3000 4000 5000 6000 7000 8000 9000
361,020 361,030 361,040 361,050 361,060 361,070 361,080
Intensity [a.u.]
wavelengh [nm]
Cd Ni
Figures S3. Pb and Co overlapping at 261 nm
Figures S4. Zn and Cu overlapping at 213 nm
0 1000 2000 3000 4000 5000 6000
224,640 224,660 224,680 224,700 224,720 224,740 224,760
Intensity [a.u.]
wavelengh [nm]
ZOOM
Pb Cu
0 5000 10000 15000 20000 25000 30000
261,390 261,400 261,410 261,420 261,430 261,440 261,450 261,460 261,470
Intensity [a.u.]
wavelengh [nm]
Pb Co
0 1000 2000 3000 4000 5000
213,810 213,825 213,840 213,855 213,870 213,885 213,900
Intensity [a.u.]
wavelengh [nm]
ZOOM
Zn Cu
Figure S5. The analytical calibration lines obtained for Cd (a) and Zn (b) at three different operational settings in case of different solvents.
(a)
1st settings 2nd settings 3rd settings
(b)
1st settings 2nd settings 3rd settings
Table S1. Interfering line coincidences in the different BCR-extractant media. Meaning of symbols:
t: total overlapping, p: partial overlapping, m: minimal overlapping;
c: commeasurable intensity, l: lower than 1:10 intensity ratio, h: higher than 10:1 intensity ratio.
Analytical line
Coincident lines BCR solvent
1st 2nd 3rd (+1)
Cd 361.051 Cd 361.051
Ni 361.046 t,c -
Ni 361.046 t,c -
Ni 361.046 t,c -
Ni 361.046 t,c Mn 361.030 p,l Co 238.891 Fe 228.863 m,c Fe 228.863 m,c Fe 228.863 m,c Fe 228.863 m,c Cr 357.869
Cr 359.349
V 359.333 p,l -
- V 359.333 m,c
- V 359.333 m,c
- V 359.333 p,l Cu 224.700 Pb 224.689 t,l Pb 224.689 t,l Pb 224.689 t,l Pb 224.689 t,l Ni 232.003 Cr 232.008 t,l Cr 232.008 t,l Cr 232.008 t,l - Pb 261.418
Pb 261.418 Fe 261.382 m,c
- Fe 261.382 m,c
- Fe 261.382 m,c
Co 261.436 p,c Fe 261.382 m,h Co 261.436 p,c V 310.230
V 309.311
matrix origine p,l matrix origine p,l
matrix origine p,l -
matrix origine p,l -
matrix origine p,l -
Zn 213.856 Zn 202.551 Zn 206.196
Cu 213.851 t,l Cu 202.548 t,l
-
Cu 213.851 t,l Cu 202.548 t,l
-
- - Cr 206.154 m,c
- - Cr 206.154 m,c
Table S2. Analytical lines selected at different operational settings. In the case of 1st, 2nd, and the (+1) extracts the wavelength readout was started from the C 193.026 nm reference line. In
0 200 000 400 000 600 000 800 000 1 000 000 1 200 000 1 400 000 1 600 000 1 800 000
0,00 5,00 10,00 15,00 20,00
Intensity [a.u.]
c [mg/L]
Cd 214.441 nm
1st 2nd 3rd +1
0 20 000 40 000 60 000 80 000 100 000 120 000 140 000 160 000
0,00 5,00 10,00 15,00 20,00
Intensity [a.u.]
c [mg/L]
Cd 214.441 nm
1st 2nd 3rd +1
0,00 0,50 1,00 1,50 2,00 2,50 3,00 3,50
0,00 5,00 10,00 15,00 20,00
Intensity [a.u.]
c [mg/L]
Cd 228.802 nm
1st 2nd 3rd +1
0 200 000 400 000 600 000 800 000 1 000 000 1 200 000 1 400 000 1 600 000 1 800 000 2 000 000
0,00 5,00 10,00 15,00 20,00
Intensity [a.u.]
c [mg/L]
Zn 213.857 nm
1st 2nd 3rd +1
0 50 000 100 000 150 000 200 000 250 000 300 000 350 000 400 000 450 000
0,00 5,00 10,00 15,00 20,00
Intensity [a.u.]
c [mg/L]
Zn 213.857 nm
1st 2nd 3rd +1
0,00 0,50 1,00 1,50 2,00 2,50
0,00 5,00 10,00 15,00 20,00
Intensity [a.u.]
c [mg/L]
Zn 213.857 nm
1st 2nd 3rd +1