Please cite this article as:
Relić, D., Héberger, K., Sakan, S., Škrbić, B., Popović, A., Đorđević, D.,
Ranking and similarity of conventional, microwave and ultrasound element sequential extraction methods
Chemosphere 198, 103-110 (2018)
https://doi.org/10.1016/j.chemosphere.2017.12.200
Ranking and similarity of conventional, microwave and ultrasound element sequential extraction methods
Dubravka Relić1, Károly Héberger2, Sanja Sakan3, Biljana Škrbić4, Aleksandar Popović1, and Dragana Đorđević5 3*
1 University of Belgrade, Faculty of Chemistry, Studentski trg 12-16, Belgrade 11158, Serbia 2 Plasma Chemistry Research Group, Research Centre for Natural Sciences, Hungarian Academy of Sciences, H-1117 Budapest, Magyar tudósok krt. 2, Hungary
3 Centre of Excellence in Environmental Chemistry and Engineering – ICTM, University of Belgrade, Njegoševa 12, Belgrade 11158, Serbia
4 University of Novi Sad, Faculty of Technology, Bulevar cara Lazara 1, 21000 Novi Sad, Serbia
Correspondence: *Dr. Dragana Đorđević, Centre of Excellence in Environmental Chemistry and Engineering – ICTM, University of Belgrade, Njegoševa 12, Belgrade 11158, Serbia E-mail address: dragadj@chem.bg.ac.rs
Abbreviations: SE, sequential extraction; BCR, Community Bureau of References; CSE, conventional sequential extraction; MWSE, microwave-assisted sequential extraction; USSE, ultrasound-assisted sequential extraction; SRD, sum of the ranking differences; CRRN, comparison of ranks with random numbers.
Abstract
This study aims to compare three extraction techniques of four sequential element extraction steps from soil and sediment samples that were taken from the location of the Pančevo petrochemical industry (Serbia). Elements were extracted using three different techniques:
conventional, microwave and ultrasound extraction. A novel procedure – sum of the ranking differences (SRD) – was able to rank the techniques and elements, to see whether this method is a suitable tool to reveal the similarities and dissimilarities in element extraction techniques, provided that a proper ranking reference is available. The concentrations of the following elements Al, Ba, Ca, Cd, Co, Cr, Cu, Fe, K, Mg, Mn, Na, Ni, Pb, Si, Sn, Sr, V and Zn were determined through ICP OES. The different efficiencies and recovery values of element concentrations using each of the three extraction techniques were examined by the CRM BCR- 701. By using SRD, we obtained a better separation between the different extraction techniques and steps when we rank theirs differences among the samples while lower separation was obtained according to analysed elements. Appling this method for ordering the elements could be useful for three purposes: (i) to find possible associations among the elements; (ii) to find possible elements that have outlier concentrations or (iii) detect differences in geochemical origin or behaviour of elements. Cross-validation of the SRD values in combination with cluster and principal component analysis revealed the same groups of extraction steps and techniques.
Keywords: sequential extraction, steps and techniques comparison, ordering, pattern recognition
1 Introduction
The most important analytical tool for obtaining information on element mobility is the sequential extraction (SE) technique. The outcome of SE can provide information on the bioavailability and possible toxicity of hazardous elements in the environment. Soil and sediment samples received much scientific attention because of the significance of element pollution and the threat pollution poses to human health. There are many available SE techniques, with the currently most commonly used variety being the SE technique proposed by the European Community Bureau of References (BCR SE) (Alonso Castillo et al., 2011; Bacon and Davidson, 2008; Canepari et al., 2005; Ciceri et al., 2008; De Andrade Passos et al., 2011; Jamali et al., 2009; Martínez-Fernández et al., 2011; Nemati et al., 2011; Passos et al., 2010; Pérez-Cid et al., 1999; Relić et al., 2013a, 2013b; Tokaliog̈lu et al., 2010). With used SE we determined acid soluble, reducible, oxidizable and residual fractions of elements in four subsequent steps from soil and sediment samples.
Typically BCR SE applies an overhead rotary mixing technique. Due to its common usage, this approach is also referred to as the conventional SE (CSE). As this method is time-consuming, alternative sources of energy (microwaves, ultrasound) are often used to reduce treatment times and obtain greater reproducibility. Some authors have achieved encouraging results either ultrasound probes to successfully reduce the time required for the SE of metals from sediments (Davidson and Delevoye, 2001; Kazi et al., 2006; Pérez-Cid et al., 1998; Remeteiová et al., 2008), or ultrasound baths to reduce the extraction time of each BCR step (30 min per step) (Arain et al., 2008; Kazi et al., 2006; Leśniewska et al., 2016). In some studies, good recovery of investigated metals was observed with microwave power lower than 170 W (Arain et al., 2008;
Leśniewska et al., 2016; Pérez-Cid et al., 2001; Relić et al., 2013a, 2013b), while other reports indicate the need for higher value ranging from 180 W to (the more common) 560 W (Jamali et al., 2009; Real et al., 1994; Reid et al., 2011).
Our study focussed on the area the Pančevo petrochemical plant and surroundings, located in the town of Pančevo, Vojvodina, the northernmost province of the republic of Serbia, about 4 km from the Danube River and 18 km (north-eastern) from the capital Belgrade. In previous studies we have already demonstrated that the area of the Pančevo petrochemical plant is a moderately polluted (Relić et al., 2013a, 2013b, 2011). In the present study, after determining the elemental concentrations in the soil and sediment samples from our study area we applied a novel procedure for determining similarities and differences in the behavior of elements extracted by conventional sequential extraction (CSE), microwave-assisted sequential extraction (MWSE) and ultrasound- assisted sequential extraction (USSE). This novel procedure is based on the sum of the (absolute) ranking differences (SRD) and is capable of ordering and grouping the techniques and elements, e.g., the concentration of elements obtained in samples after four SE steps and three extraction techniques.
SRD has already been applied successfully in various scientific disciplines for solving different method and model comparison problems. It`s applications include: column selection in chromatography (the original problem for which it was developed by Héberger (2010), comparing of quantitative structure–activity relationship (QSAR) models (Vračko et al., 2010), descriptor selection in QSAR (Kar and Roy, 2012; Ojha and Roy, 2011), comparing quantitative structure–retention relationship models (Djaković-Sekulić et al., 2012; Garkani-Nejad and Ahmadvand, 2011; Héberger, 2010; Héberger and Škrbić, 2012), comparing of quantitative structure–property relationship models and, the predicting NMR chemical shifts (Liu et al., 2011), predicting solubility (Bolboaca and Jantschi, 2010), comparing computer procedures for estimating octanol–water partition coefficients (Ačanski et al., 2011; Andrić et al., 2016; Andrić and Héberger, 2015a, 2015b; Héberger and Kollar-Hunek, 2011), clustering polarity measures (Héberger and Zenkevich, 2010) including Hansen’s solubility parameters (Bielicka- Daszkiewicz et al., 2010), checking evaluation panels in food chemistry (Kollar-Hunek et al., 2008; Sipos et al., 2011), ranking sensory-principal component 1 scores (Wood et al., 2010), performance testing of Raman spectral resolution (Vajna et al., 2012), comparing chemometric methods in near infra-red spectroscopy (Gowen et al., 2011), comparing curve resolution techniques (Vajna et al., 2011), ranking of polycyclic aromatic hydrocarbons (PAHs) and polluted environmental sites (Rocha et al., 2011), biochemical assay comparisons (ELISA Veratox), and liquid chromatography for determining mycotoxin content (Tangni et al., 2011).
The calculations (ordering) were made using an Excel macro freely downloadable from http://aki.ttk.mta.hu/srd together with sample input and output files (Héberger and Kollar-Hunek, 2011). Finally, we applied our method for the first time to this data to rank and group three extraction techniques based on the similarities in extraction capacities and to rank and groups elements to recognise similar of different geochemical origin and behaviour in analysed 107 samples. The clustering pattern was justified by cluster and principal component analysis.
2 Materials and Methods
2.1 Description of the study area and samples
A total of 41 samples of soil and sediments were collected from the area of the Pančevo petrochemical industry (Relić et al., 2013a, 2013b, 2011).
The samples were packed in pouches and stored at 4 °C in order to prevent changes in the chemical composition of samples. The elements for which we analysed using inductively coupled plasma/optical emission spectrometry (ICP OES) were: Al, Ba, Ca, Cd, Co, Cr, Cu, Fe, K, Mg, Mn, Na, Ni, Pb, Si, Sn, Sr, V and Zn.
2.2 Sequential extraction techniques
Solutions for extraction were prepared using analytical grade reagents (Carlo Erba). The conditions applied in each of the three steps of the BCR extraction protocol, as well as the pseudo-total quantity of elements in solid residues after three BCR steps were presented previously (Relić et al., 2013a, 2013b). CSE was obtained during 16 h through over-head extraction of solids, requiring the use of reagent for BCR extraction. The ratio solid to solution was 1:40, also for MWSE and USSE. During the first three BCR steps of MWSE, the applied microwave power was 90W, applied during 120 s. This microwave radiation was applied after 2h of sample digestion with hydrogen-peroxide, for determining the oxidizable fraction. For USSE, ultrasonic waves at a power of 100 W for 30 minutes for each of the first two BCR steps (determining acid soluble and residual fraction) and again after sample digestion with hydrogen peroxide in the third BCR step. The fourth step, aqua regia digestion, was identical for all sequential extraction techniques: digestion of residues with a mixture of mineral acids on water bath.
2.3 Instrumentation
The elements were determined using an iCAP 6500 Duo ICP OES (Thermo Scientific, United Kingdom). The detector was an RACID86 charge injector device (CID). External standard solutions were prepared from 1000 mg L−1 stock metal solutions. For minimal interference, a multi-element standard stock solution was prepared in which the ratios of the metals were the same as in the samples. These multi-element standards were prepared in the same matrix as the extracting reagents to minimize matrix effects. Blanks were prepared for background correction.
Reagent blanks for all extractants were analyzed in parallel with all samples and found to have negligible levels of the studied elements. The instrumental calibration was checked after every 10–12 samples.
Analytical wavelengths for each element were optimized daily before calibrating the instrument.
The ICP OES was calibrated using an acid blank and metal standard. For all trace elements calibration curves the square of the correlation coefficient (R2) was ³ 0.995. The acid matrix baseline correction wavelengths for each metal were selected by comparing the observed signal intensities with the acid blank, analyte standard and sample digestion solutions. The following sequence of analyses was adhered to: first the blank, then the standards and at the end the samples in sequence. The blank intensity was subtracted from both the standard and the sample intensities. All elements were measured at the most appropriate wavelength, which was determined by the estimated composition. The sensitivity was maximized and the spectral overlap of elements was avoided as much as possible. A microwave oven (Electrolux model 2100 S, 800 W power) was used as a microwave radiation source. For extraction with ultrasound, we used a J.P. Selecta ultrasonic bath, with a maximum frequency of 42 kHz applied over a period of 30 minutes during extraction, and an effective power of 100W, without heating. A centrifuge (Tehtnica, Železniki) was used during 10 min at 3000 g separate the extracts.
2.4 Certified reference materials
Certified reference material was supplied by The Community Bureau of Reference Samples (BCR): BCR-701. The certified material was handled according to the supplier’s specifications.
2.5 Ranking and pattern recognition methods
The SRD procedure is entirely general, and it is supervised in the sense that a reference (benchmark) ranking should be available. The data should be arranged in matrix form. We
arranged two matrices consisting of objects and variables, with the objects placed in the rows and the variables in the columns of the input matrix. The first matrix contained 19 objects, which represented the averaged element concentrations, while the 12 variables represented the BCR steps with adequate extraction techniques. The second matrix contained 41 objects, representative of 41 samples and again 12 variables were the BCR steps with adequate extraction techniques.
After arranging the matrices, the second important step is the selection of a reference (benchmark) for ranking. We chose to use the average of all objects as a reference for the ranking in order to obtain a consensus ranking; random errors cancel each other out, and systematic errors of different laboratories and/or various measurement methods also cancel each other. All samples were extracted at the same time for each extraction technique and all element concentrations were measured on the same scale; hence, no data pre-processing was necessary. For the matrices, an averaged value was calculated for each row. These averaged values were added as an additional column after the last column in each matrix. However, the average is not necessarily an unbiased solution; also minimum or maximum value, or some read value can be used as reference value for ranking. Every variable in the two matrices was ranked and compared to the known reference (average) values. The absolute differences between the average and individual rankings were then calculated and summed for each technique.
The closer the SRD value is to zero the closer the variables are to the reference value. If techniques have similar SRD values this means that those techniques are similar to each other, in the sense that they could have a similar impact on the extraction of elements.
The calculations (ordering) were made using an Excel macro freely downloadable from http://aki.ttk.mta.hu/srd
together with sample input and output files (Héberger and Kollar-Hunek, 2011). Cluster, principal component and correlation analyses were also used to reveal and so validate the grouping pattern in the data. All the calculations were made using Statistica v7.0 (Tulsa Oklahoma, USA).
3 Results and Discussion
3.1 Sequential extraction of soil and sediment samples
In Table S1, we present concentrations of elements obtained after four SE steps using three extraction techniques. According to obtained results, it can be seen that the highest concentrations of analysed elements were detected after the fourth SE step, while for the majority of them the lowest values were detected in the first SE step, after extraction of an acid soluble fraction. Ca and Sr behaviours differently, these metals were extracted in highest quantities in an acid soluble fraction, because of carbonate dissolution. Comparing different techniques in each step, within the first SE, for a majority of elements, CSE was the technique that obtains the highest element concentrations. After the second and the third step, the highest values were detected after CSE also for the majority of elements.
3.2 Certified material
The concentrations of metals in the certified BCR material is presented in Relić et al. (2013a) as a mean value with one standard deviation, accuracy, precision and recovery values for all four SE steps and three extraction techniques. CSE yield a good accuracy for certified reference metals for all BCR steps. Also USSE gave good results there, except for the extracted quantities after the second BCR step. The MWSE technique had the lowest agreement with certificate concentrations among all BCR steps (Relić et al., 2013a). In Table 1 we present the sum total extracted quantities of certified reference metals, obtained by CSE, MWSE and USSE after four SE steps
and the direct pseudo-total quantity of BCR 701 by aqua regia from Sutherland (2010), to calculate the recovery values for each technique using this equation:
Recovery = ([step 1 + step 2 + step 3 + step 4]/pseudo-total concentration) × 100 (1) The lowest recovery values were obtained for Cr: for CSE 41%, for MWSE 42% and for USSE 47% and for Ni: for CSE 74.0 %, for MWSE 73.2 % and for USSE 63.8 % (Table 1), the other metals have accuracy values above 80%. Apart from Cr and Ni, Cu was the third metal to have recovery values of less than 90% for all techniques (Relić et al., 2013b). Each of Cr and Ni concentrations were recalculated according to the discrepancy in the measured values from its relevant value in the reference material. For all certified reference metals, the highest recovery values were obtained after CSE 224 with values for Cd and Pb close to or or higher than 100%
(Table 1), while for the other metals and techniques, these values were lower. This agrees with recovery 1 and 2 form Relić et al. (2013a), which were also lower than 100%. The highest metal quantities were thus extracted by CSE, and more closely to certified values, rather than using the faster techniques, while the closest recovery values were obtain for time saving techniques, for most of metals except for Cr and Ni. Lead was the only metal that has microwave and ultrasound extraction quantities more closely to certified reference value.
3.3 SRD ranking
3.3.1 SRD ranking – techniques and BCR steps vs. elements
In our matrices, the rows contained the element concentrations (the averaged value of their quantities from all samples for an adequate extraction step and technique) while the columns contained the four SE steps which we will refer to SE-I, SE-II, SE-III and SE-IV, as well as the three extraction methods: using microwaves (MW), ultrasound (US) and conventional rotary mixing (C). A notation with Roman numerals next to abbreviations of the extraction technique represents the corresponding step in the BCR SE. A simple SRD ranking is shown in Figure 1.
Figure 1
Ordering using sum of ranking differences (SRD) for 12 extraction techniques by consensus (row average was used as reference ranking) by 19 elements. The SRD values (x-axis and left y-axis) were scaled to range from 0 to 100. The theoretical distribution function was approximated by fitting a Gaussian bell curve (mean = 66.95, standard deviation = 10.15). The right y-axis contains the relative frequencies for the theoretical distribution function.
CSE-II was most similar to the average of all techniques; the elemental concentrations extracted using this technique and after the second SE step were hardly different from the averaged values, and the sum of all SRD values was the lowest overall. The techniques with artificial sources of energy applied in the second and fourth sequential steps were ranked in the first subgroup (USSE-II and MWSE-IV, both are indistinguishable from one another through SRD ranking).
The next grouping had three indistinguishable extraction techniques: MWSE-II, MWSE-III and USSE-III, and the fourth grouping consisted of CSE-III and USSE-IV. CSE-IV fairly belongs to either of groups and MWSE-I and USSE-I is indistinguishable as well. When techniques were indistinguishable it could indicate the existence of similarity in the rank differences of extraction element concentrations after the usage of these techniques. CSE-I was farthest from the other techniques but below the theoretical distribution function of random numbers (black curve in Figure 1). This indicates that there should not be significant difference between this and other techniques. When we compared techniques applied in the first BCR step, MWSE-I and USSE-I were closer to each other than to CSE-I (Figure 1), i.e. the SRD for MWSE-I and USSE-I was lower than for CSE-I. This similar SRD ranking of MWSE-I and USSE-I (Figure 1) indicates that the effect of two artificial sources of energy on the most mobile fraction of elements were similar, considering they differed from the averaged values in the same way. The closest and farthest techniques were conventional ones according to SRD ranking. Considering that CSE is the recommended technique for BCR SE together with fact that those techniques which use artificial sources of energy were located between CSE-II and CSE-I, confirms their applicability for this kind of analysis. However, the ordering process comes with some uncertainties that can significantly affect the grouping pattern. A sevenfold cross-validation (approximately seven-fold split) is suitable for assigning uncertainties to the rank numbers: approximately one-seventh of the elements were left out and the ranking was completed in a similar way to the full data set. The procedure was repeated seven times, yielding seven rankings with six-sevenths of the data and one full ranking. Uncertainties were assigned to the SRD values. The next figure (Figure S1) shows the SRD values with uncertainties in increasing order.
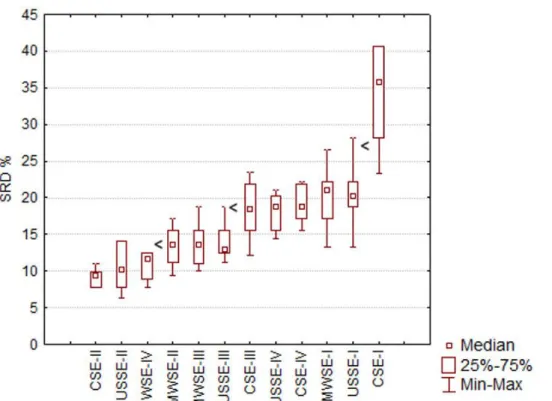
Figure S1 Box and whisker plot of the cross-validated (sevenfold) SRD values for the extraction techniques.
The sevenfold cross-validation distributed the sample extraction methods into four groups and all techniques were grouped according to their significance (Figure 2). These groups are as follows:
CSE-II, USSE-II and MWSE-IV from group I; MWSE-II, MWSE-III and USSE-III from group II;, group III contains CSE-III, USSE-IV, CSE-IV, MWSE-I and USSE-I; and CSE-I can be considered as ‘group IV’ (Figure S1). Comparing these groups there are two extraction techniques for each step in each group: first step, MWSE-I and USSE-I (group III); second step, CSE-II and USSE-II (group I); third step, MWSE-III and USSE-III (group I) and fourth step, CSE-IV and USSE-IV (group III). Figure S2 shows a hierarchical cluster analysis of the data matrix that was used in case of SRD ranking).
Figure S2 Tree diagram of the original data matrix (Euclidian distance and Ward's method were used).