https://doi.org/10.1007/s11244-020-01273-4 ORIGINAL PAPER
Cu–Fe Incorporated Graphene‑Oxide Nanocomposite as Highly Efficient Catalyst in the Degradation
of Dichlorodiphenyltrichloroethane (DDT) from Aqueous Solution
Giang H. Le1 · Tuan T. Nguyen2 · Manh B. Nguyen1 · Trang T. T. Quan1 · Trinh Duy Nguyen3 · Andras Sapi4 · Imre Szenti4 · Suresh Mutyala4 · Akos Kukovecz4 · Zoltan Konya4 · Tuan A. Vu1
Published online: 20 May 2020
© The Author(s) 2020
Abstract
Fe/graphene oxide and Cu–Fe/graphene oxide nanocomposite were synthesized by the atomic implantation method to study the photocatalytic degradation of dichlorodiphenyltrichloroethane (DDT). The synthesized nanocomposites were character‑
ized by the XRD, N2 isotherms, SEM with EDX, TEM and XPS analysis. Characterization results have reported that oxides of Cu and Fe were uniformly distributed on graphene oxide and exited in the form of Cu+ and Fe2+ ions in Cu–Fe/graphene oxide nanocomposite. The high photocatalytic DDT removal efficiency 99.7% was obtained for Cu–Fe/graphene oxide under the optimal condition of 0.2 g/L catalyst, 15 mg/L H2O2 and pH 5. It was attributed to the reduction of Fe3+ to Fe2+ by Cu+ ions and –OH radicals formation. However, it was dropped to 90.4% in the recycling study by leaching of iron and without a change in phase structure and morphology.
Graphic Abstract
Keywords Graphene oxide · CuO and Fe2O3 · Dichlorodiphenyltrichloroethane · Photocatalytic degradation
* Andras Sapi
sapia@chem.u‑szeged.hu
1 Institute of Chemistry, Vietnam Academy of Science and Technology, 18 Hoang Quoc Viet Street, Cau Giay, Hanoi, Vietnam
2 Graduate University of Science and Technology, Vietnam Academy of Science and Technology, 18 Hoang Quoc Viet Street, Cau Giay, Hanoi, Vietnam
3 Center of Excellence for Green Energy and Environmental Nanomaterials (CE@GrEEN), Nguyen Tat Thanh University, Nguyen Tat Thanh, District 4, Ho Chi Minh City 300A, Vietnam
4 Department of Applied and Environmental Chemistry, Interdisciplinary Excellence Centre, Univesity of Szeged, H‑6720, Rerrich Bela ter 1, Szeged, Hungary
1 Introduction
Dichlorodiphenyltrichloroethane (DDT), polychlorinated biphenyl (PCB), Dioxin and Furan are persistent organic pollutants that affect human health and the environment [1]. A few methods have been developed to eliminate/
degrade these pollutants such as adsorption, biodegrada‑
tion, and chemical degradation [2, 3]. Nano‑structured zero‑valent iron was claimed as a highly active site to degrade DDT in water and soil. Kang et al. have synthe‑
sized micro/nano‑structured zero‑valent iron (MNZVI) by ball‑milling industrially reduced iron powder. Plate‑like morphology of MNZVI exhibited high degradation perfor‑
mance compared to commercial zero‑valent iron powder [4]. Yehia et al. have also synthesized nano‑sized zero‑
valent iron (NZVI) by different methods. It has shown high degradation of DDT in water compared to soil [5]. Later, Tian et al. has synthesized bimetallic Ni/Fe nanoparticles to degrade DDT in aqueous solution. In this catalyst, Fe nanoparticles promoted Fenton reaction and Ni nanopar‑
ticles promoted dehydrochlorination [6].
The advanced oxidation process is one of the effective methods to degrade toxic pollutants. This refers to an oxi‑
dation process through the formation of hydroxyl radical which promoted the degradation of organic contaminants in water and subsequently it reacts with organic contami‑
nants through a series of multiple steps to form non‑toxic products like low molecular weight carboxylic acid, HCl, CO2 and H2O [7]. In the Fenton process, iron‑catalyzed hydrogen peroxide (Fe2+/H2O2) has been used for the removal of pollutants in water. It shows high degradation efficiency, simple operation and low toxicity [8]. However, it has some drawbacks such as lack of recovery of the cata‑
lyst, inefficiency in aqueous media (pH 5–9), production of a large amount of sludge and requires further treatment.
In order to overcome these drawbacks, a heterogeneous Fenton process using iron‑based catalysts such as Fe2O3, Fe3O4, FeOOH, Fe powder, Fe‑MOF, Fe‑Fe3O4 nanoparti‑
cles have been developed [9–13]. In this process, oxidation occurs at the solid–liquid interface where iron remains either in the solid phase and/or adsorbed ion.
Few research groups have synthesized composite mate‑
rials such as Fe3O4/CeO2 [12], Fe‑g‑C3N4/graphitized mesoporous carbon [14], graphene oxide–Fe2O3 [15], Cu‑
rGO [16], Fe3O4–CuO–graphene oxide [17], Fe–Fe3O4/ graphene oxide [18], graphene oxide‑amorphous FePO4 [19] and graphene oxide/Fe‑MOF [13] to degrade pollut‑
ants in aqueous solution. Among these, supporting materi‑
als like graphene and graphene oxide have great interest due to their unique structure, high specific surface area, chemical stability, conductivity and visible light adsorp‑
tion ability [20, 21]. So, graphene oxide was considered
as a support to synthesize nanocomposite material. In this article, Fe/graphene oxide and Cu–Fe/graphene oxide nanocomposite were synthesized to study the degrada‑
tion of DDT under light irradiation. The effect of cata‑
lyst concentration, pH and H2O2,, intermediate products formed during the degradation of DDT and recyclability were studied.
2 Experimental
2.1 ChemicalsAll analytical grade chemicals such as iron (II) chloride hexahydrate (FeCl3·6H2O), copper (II) chloride tetrahydrate (CuCl2·4H2O), graphite (C), dichlorodiphenyltrichloroeth‑
ane (C14H9Cl5), sulphuric acid (H2SO4), phosphoric acid (H3PO4), hydrochloric acid (HCl), hydrogen peroxide (30 wt% H2O2), and potassium permanganate (KMnO4) were purchased from M/s. Sigma Aldrich Chemicals Pvt. Ltd., Vietnam. Ultra‑high pure nitrogen gas cylinder was pur‑
chased from the local vendor, Vietnam.
2.2 Synthesis of Graphene Oxide
Graphene oxide was synthesized by the modified Hummer’s method [22]. About, 1 g of graphite flakes were transferred into a mixture of 150 mL concentrated H2SO4 and H3PO4 (4:1, v/v (%)), stirred at room temperature for 1 h then 6 g of KMnO4 was added slowly. The mixture was kept at room temperature for 3 days. It was turned dark brown from dark green. The oxidation reaction was quenched using 600 mL ice‑cold water and 3 mL H2O2. The color of the solution was changed into bright yellow then it was centrifuged and washed with 1 M HCl to remove excess manganese salt.
Finally, it was washed with distilled water until neutral pH obtained then dried at 100 °C overnight. The dried com‑
pound graphene oxide was labeled as GO.
2.3 Synthesis of Fe/GO and Cu–Fe/GO Nanocomposite
Fe/GO and Cu–Fe/GO nanocomposite were synthesized by the atomic implantation method using the equipment shown in Fig. 1. For the synthesis of Fe/GO, a desired quantity of iron (III) chloride hexahydrate and graphene oxide (Fe:GO = 20:80 wt%) were mixed and loaded at the center of the tubular furnace. It was heated at 500 °C for 30 min with a heating rate of 5 °C/min in a nitrogen atmos‑
phere then cooled to room temperature slowly. Similarly, Cu–Fe/GO was prepared using the procedure the same as that of Fe/GO synthesis with precursors composition ratio (Cu:Fe:GO = 2:18:80 wt%).
2.4 Characterization
X‑ray diffractions were recorded using a D8 Advance X‑ray diffractometer having Ni filtered Cu Kα radiation in the scan range from 2θ = 5° to 70°. Trista Plus II gas adsorp‑
tion analyzer was used to measure adsorption–desorption isotherms at 77 K. Before the study of N2 isotherms, 0.1 g of sample was degasified at 200 °C for 2 h under vacuum.
The BET method was used to calculate the specific surface area and the t‑plot method was used to calculate micropore volume. The total pore volume was calculated at a relative pressure of 0.99. FT‑IR spectra were recorded using JACOS 4700 FT‑IR spectrometer in the scan range from 4000 to 400 cm−1 with a resolution of 4 cm−1 using KBr. TEM image was obtained on a JEOL JEM 1400 transmission electron microscopy instrument operated at a voltage of 100 kV.
Thermo Fisher K‑alpha X‑ray photoelectron spectrometer (ESCALAB MKII) was used to record the spectrum. SEM with Energy Dispersive X‑ray spectroscopy (EDX) mapping was performed using a HITACHI S‑4800.
2.5 Photocatalytic Degradation Experiment
Photocatalytic degradation of dichlorodiphenyltrichloro‑
ethane (DDT) in aqueous solution was studied using syn‑
thesized composite materials by irradiation of simulated sunlight UV‑A 315–400 nm (4 lamps, power 15 W). The distance of the tested sample from the source of irradiated light was 20 cm and brightness was 2.03.104 lx (M6M PRO Lux Meter LX 1010 BS‑Taiwan). The experiment was per‑
formed in a Pyrex glass contacting 100 mL DDT solution at a concentration of 10 mg/L. The reaction parameters such as catalyst dosage 0.05–0.4 g/L, effect of pH 3–8 and con‑
centration of H2O2 10–100 mg/L were also studied. Firstly, the reaction mixture was stirred in a dark condition to meas‑
ure adsorption–desorption equilibrium on the surface of the catalyst. Secondly, it was exposed to sunlight with continu‑
ous stirring. The mixture was collected at regular intervals of time, centrifuged and analyzed using GC–MS Agilent
GC 7890A, MS 5975C spectrometer. The intermediate prod‑
ucts were analyzed using LC–MS HRAM (Thermo Fisher) instrument with a column of Ultra aqueous C18.5 μm. The DDT degradation efficiency (%) was calculated using the following equation.
where C0 is the initial concentration and Ct is the concentra‑
tion at time t.
3 Results and Discussion
3.1 Structure, Chemical Composition, and Morphology
3.1.1 XRD and FT‑IR Analysis
The crystalline structure and functional groups of synthe‑
sized composite materials were analyzed by XRD and FT‑IR techniques. The XRD patterns of GO, Fe/GO and Cu–Fe/
GO were shown in Fig. 2a. Pristine graphene oxide has shown a single diffraction peak at 2θ = 10.6° with a reflec‑
tion plane (001). The diffraction pattern of GO was matched with previously reported one [23]. In Fe/GO, the diffraction peaks of Fe2O3 were 24.1°, 33.1°, 36.5°, 40.8°, 49.4°, 54.1°, 57.5°, 62.3° and 64° having planes (012), (104), (110), (113), (024), (116), (018), (214) and (300) respectively (JCPDS card no. 39‑1346) [24]. Moreover, Cu–Fe/GO has also shown diffraction peaks similar to Fe/GO. The copper oxide peaks have not appeared due to low particle size and/
or undetectable by the XRD [25]. In both Fe/GO and Cu–Fe/
GO nanocomposite materials, the GO peak at 2θ = 10.6°
was absent which indicated that oxides of Fe and Cu were intercalated within graphene oxide layer [26]. Moreover, the crystalline GO was converted into amorphous GO during the synthesis of nanocomposite material.
Degradation efficiency% = C0−Ct
C0 ×100
Fig. 1 The schematic diagram for the synthesis of Fe/GO and Cu–Fe/GO nanocomposite
n n n
0040 ~A
n n n Thermal coupler collecting tank
Out gas N2
FeCl3 CuCl2
Heating furnace
Quart GO fiber fabric
Figure 2b shows the FT‑IR spectra of GO, Fe/GO and Cu–Fe/GO. The pristine graphene oxide has shown the vibrational bands at 3419 cm−1, 2905 cm−1, 2850 cm−1, 2360 cm−1, 1725 cm−1, and 1230 cm−1 which correspond to stretching of O–H, C–H, O–C–O, C=O, C–O groups respec‑
tively [27]. For Fe/GO and Cu–Fe/GO nanocomposite mate‑
rials, the major vibrational bands of graphene oxide were replicated. Along with this, a few new vibrational bands appeared at 630 cm−1, 570 cm−1 and 480 cm−1 for Fe/GO which were related to Fe–O group of Fe2O3. Similarly, the bands at 506 cm−1 and 430 cm−1 were related to the Cu–O group of Cu2O/CuO for Cu–Fe/GO nanocomposite [28–30].
3.1.2 XPS Analysis
The oxidation state of Fe and Cu in Cu–Fe/GO nanocom‑
posite can be known by XPS analysis. Figure 3 shows the XPS spectra of Cu–Fe/GO. The survey spectrum has shown binding energies at 285 eV, 530 eV, 711 eV, and 934 eV which correspond to C1s, O1s, Fe2p and Cu2p (Fig. 3a). It indicated that these elements were present in synthesized nanocomposite material Cu–Fe/GO. By deconvolution of Fe2p peak obtained binding energies at 710 eV (Fe2p3/2) and 724 eV (Fe2p1/2). It reported that the existence of Fe2O3 [31]. Low‑intensity peaks at 715 eV and 730 eV correspond to the presence of Fe(II)O in the synthesized material [32]. It is important to note that in the case of Fe/GO only the pres‑
ence of Fe3+ is could be observed. Copper peak on deconvo‑
lution obtained binding energies at 931 eV and 943 eV and 951 eV which described the formation of Cu(II)O material [29]. The peak obtained at 931 eV indicated the presence of Cu2O. The existence of both Cu+, Cu2+, and Fe2+ in Fe–Cu/
GO indicated that the part of Fe3+ was reduced to Fe2+ by Cu+. The deconvolution peaks of C1s were 284.4 eV, 285.6
eV, and 288.3 eV which described bonding of C–C, C–O, and O=C–O in graphene oxide sheets. The deconvolution peaks of O1s were 529.9 eV, 531.1 eV, and 533 eV which correspond to Fe–O, C=O and C–O respectively.
3.1.3 TEM and SEM with EDX Analysis
TEM and SEM with EDX mapping of Cu–Fe/GO were shown in Fig. 4. TEM image has reported that oxides of Cu and Fe were highly dispersed on graphene oxide and particle size was in the nano range (Fig. 4a). Porous net‑
work graphene oxide layers were appeared in the SEM image (Fig. 4b). EDX mapping of Cu and Fe has confirmed that CuO and Fe2O3 were uniformly dispersed by the atomic implantation method (Fig. 4c, d). The chemical composi‑
tion of Fe/GO and Cu–Fe/GO was presented in Fig. 4e. The wt% of copper and iron obtained experimentally was near to theoretically loaded amount.
3.1.4 N2 Adsorption–Desorption Isotherms
Figure 5 shows the N2 adsorption–desorption isotherms and pore size distribution of GO and Cu–Fe/GO. The textural properties were presented in Table 1. The pristine graphene oxide has shown a hysteresis loop between the relative pres‑
sure P/P0 = 0.45–1. According to the classification of porous materials, the isotherm pattern of GO is similar to type‑IV with the H3 hysteresis loop which indicated that the pres‑
ence of mesopores [33]. The BET surface area, total pore volume, and pore size of GO were 331 m2 g−1, 1.719 cm3 g−1 and 20.7 nm respectively. Cu–Fe/GO nanocomposite material has also shown an isotherm pattern similar to that of GO. But, the amount of N2 adsorption was decreased.
Hence, there was a change in the textural properties has been
Fig. 2 a XRD patterns and b FT‑IR spectra of GO, Fe/GO and Cu–Fe/GO
observed. The specific surface area, total pore volume and pore size of Cu–Fe/GO were decreased to 130 m2 g−1, 0.410 cm3 g−1 and 12.6 nm respectively. It was due to the blockage of pores by CuO and Fe2O3.
3.2 Photocatalytic Degradation
of Dichlorodiphenyltrichloroethane 3.2.1 Parameters Influence on DDT Degradation
Effect of catalyst dosage The effect of Cu–Fe/GO dosage for the photocatalytic degradation of DDT was studied using 10 mg/L DDT solution, 15 mg/L H2O2, and pH 5 for 3 h.
The DDT removal efficiency values were shown in Fig. 6.
At the low dosage of catalyst 0.05 g/L, DDT removal effi‑
ciency was 53%. With an increase in catalyst dosage from 0.05 g/L to 0.2 g/L, the removal efficiency was increased and reached to 99.7%. Beyond 0.2 g/L of catalyst dosage, there was no change in degradation efficiency. Hence, the optimum amount of the catalyst for the degradation of DDT was 0.2 g/L for 10 mg/L of DDT solution. It was due to that 0.2 g/L of the catalyst has enough active adsorption sites to degrade the DDT solution. For high concentrated DDT solu‑
tion, a high catalyst dosage might be needed [34].
Effect of pH The photocatalytic degradation of pollut‑
ant in the polluted water depends on the pH of the solu‑
tion because pollutant has different pH values in aqueous
solution [35]. Figure 7 shows the photocatalytic degra‑
dation of DDT at different pH of DDT solution using 0.2 g/L of Cu–Fe/GO, 15 mg/L H2O2 for 3 h. The DDT removal efficiency was 99.8% at pH 3 and 5. However, at higher pH > 5 the DDT removal efficiency was decreased and reached 91% (pH 8). The change in the photocata‑
lytic activity of Cu–Fe/GO nanocomposite was due to the decomposition of H2O2. At pH > 5, H2O2 was decomposed into H2O then active centers CuO and Fe2O3 were con‑
verted into the corresponding hydroxide [36, 37]. Hence, the photocatalytic activity of Cu–Fe/GO was decreased. At pH 3–5, hydroxy radicals were formed during the reaction which enhanced photocatalytic activity of Cu–Fe/GO to degrade DDT [38].
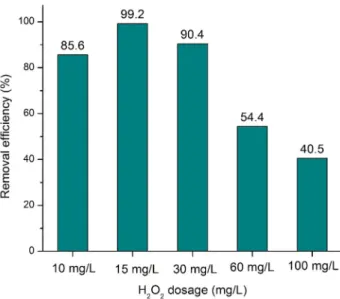
Effect of H2O2 dosage The effect of H2O2 concentration in photocatalytic degradation of DDT using Cu–Fe/GO was also studied. The conditions were 10 mg/L of DDT solution, 0.2 g/L of catalyst and pH 5, for 3 h (Fig. 8). With increase in concentration of H2O2 from 10 to 15 mg/L, DDT removal/degradation efficiency was increased from 85.6 to 99.2%. At a high dosage of H2O2 (30 mg/L, 60 mg/L, and 100 mg/L) removal efficiency was decreased.
The change in DDT degradation efficiency was due to the formation of an optimal amount of hydroxy radicals in low concentration of H2O2 whereas at high concentration excess amount of H2O2 reduced hydroxy radicals (Eqs. 1 and 2) [34].
Fig. 3 XPS spectra of Cu–Fe/GO a survey, b Fe2p, c Cu2p, d C1s and e O1s
Fig. 4 a TEM image, b SEM image, c, d elemental mapping, e EDX spectrum of Cu–Fe/GO
Fig. 5 a N2 adsorption–desorption isotherms and b pore size distribution of GO and Cu–Fe/GO
3.2.2 Degradation of DDT by Adsorption, Fenton Process and Photo‑Fenton Process
After tuning the parameters, the optimal condition was used to study the degradation of DDT by adsorption, Fen‑
ton process and Photo‑Fenton process using Cu–Fe/GO (Fig. 9a). The adsorption process has shown around 40%
DDT removal efficiency for 3 h. Moreover, the Fenton pro‑
cess and Photo‑Fenton process have shown DDT removal efficiency 85% and 99.2% respectively. High efficiency was obtained by the Photo‑Fenton process compared with the Fenton process and adsorption process. It was attributed to the presence of Cu+ ions (from XPS) which reduced Fe3+
to Fe2+ ion and provided more –OH radicals under visible (1) OH⋅+H2O2→OH2⋅+H2O
(2) OH2⋅+OH2⋅→H2O2+O2
light irradiation [36, 39]. Figure 9b shows DDT removal effi‑
ciency using Fe/GO and Cu–Fe/GO catalysts by the Photo‑
Fenton process. Cu–Fe/GO has shown high DDT removal efficiency compared with Fe/GO by the promotional effect of copper.
Persistent organic pollutants degradation by advanced oxidation process using Photo‑Fenton catalyst is one of the effective methods. Our results have shown that DDT was completely oxidized into CO2, H2O, and HCl. For better
Table 1 Textural properties of GO and Cu–Fe/GO nanocomposite
a Multipoint BET surface area
b total pore volume at P/P0 = 0.99
c micropore volume by the t‑plot method and
d average pore size by BET method (4 V/S.A) Sample SBETa (m2
g−1) Vtotalb (cm3
g−1) Vmicroc (cm3
g−1) Pore sized (nm)
GO 331 1.719 0.002 20.7
Cu–Fe/GO 130 0.410 0.003 12.6
Fig. 6 Effect of Cu–Fe/GO dosage for the photocatalytic degradation of DDT
Fig. 7 Photocatalytic degradation of DDT at different pH of DDT solution using Cu–Fe/GO
Fig. 8 Effect of H2O2 dosage for the photocatalytic degradation of DDT using Cu–Fe/GO
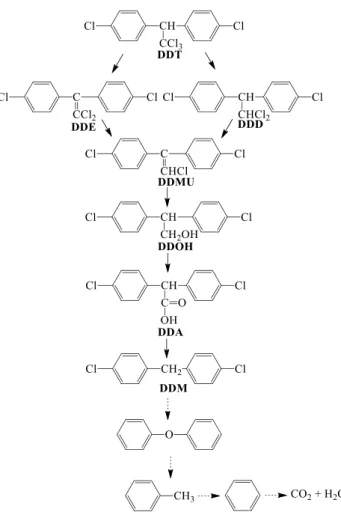
understanding, the reaction mechanism and intermediates produced during the reaction were analyzed by LC–MS.
From the formed intermediates, the possible reaction path‑
way was: (i) dechlorination of DDT step by step, (ii) break‑
ing of carbon chains and de‑cyclization to form hydrocarbon with shorter chain, (iii) complete oxidation of hydrocarbon to form CO2 and H2O (Fig. 10). The shorter chain hydrocar‑
bons (C14, C12, C7 and C6) identified in the DDT degradation process was good agreement with reported literature [40, 41].
3.3 Stability of Cu–Fe/GO Nanocomposite
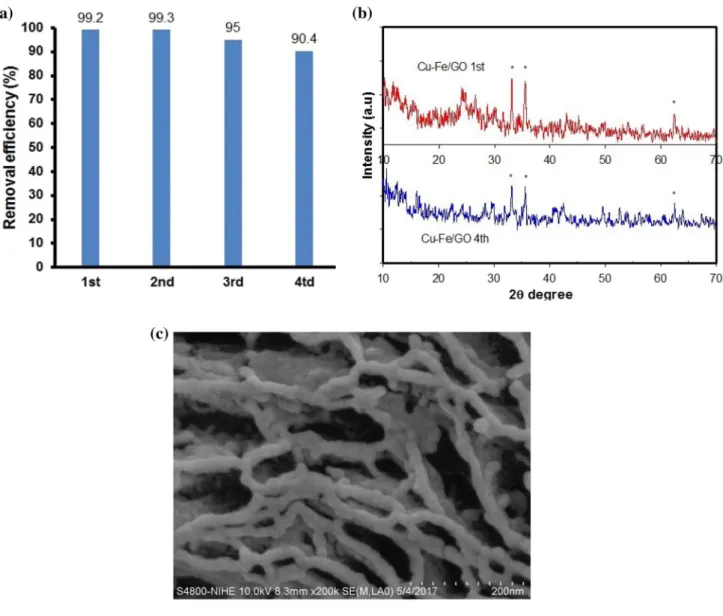
Recyclability of the photocatalyst Cu–Fe/GO was studied up to 4 cycles (Fig. 11a). In each cycle, the catalyst was sepa‑
rated from the equilibrium solution by filtration then washed with methanol and dried at 60 °C overnight. In the 1st cycle, DDT removal efficiency was 99.2%. After 4 cycles, it was reached to 90.4%. The used catalyst was characterized by XRD (Fig. 11b). There was a change in the intensity of the peak at 2θ = 24°. It was due to the leaching of iron. How‑
ever, no change in morphology has been observed (Fig. 11c).
From these results, the synthesized Cu–Fe/GO nanocom‑
posite catalyst has shown high photocatalytic degradation of DDT.
4 Conclusion
In this work, Fe/GO and Cu–Fe/GO nanocomposite were used for the photocatalytic degradation of dichlorodiphenyl‑
trichloroethane in aqueous solution. Characterization results have confirmed that oxides of Cu and Fe were presented as
Fig. 9 DDT removal efficiency: a by adsorption, Fenton process and Photo‑Fenton process using Cu–Fe/GO, b Photo‑Fenton process using Fe/
GO and Cu–Fe/GO
Fig. 10 Proposed DDT decomposition pathway using Cu–Fe/GO catalyst
CuO and Fe2O3 on the graphene oxide. Cu–Fe/GO nano‑
composite has obtained high DDT removal efficiency at pH of the DDT solution < 5 by the formation –OH radicals which enhanced DDT removal efficiency. Moreover, it has also shown high DDT removal efficiency compared with Fe/
GO by the promotional effect of copper. In the recycle study, Cu–Fe/GO has shown good photocatalytic stability. Hence, graphene oxide supported metal oxides could be considered as an efficient and promising photocatalyst for the degrada‑
tion of persistent organic pollutants.
Acknowledgements Open access funding provided by University of Szeged (SZTE). The authors thank the Vietnam Academy of Science and Technology for financial support of this work (QTHU 01.01/18).
This paper was supported by the Hungarian Research Development and Innovation Office through Grants NKFIH OTKA PD 120877 of AS. AK, and KZ is grateful for the fund of NKFIH (OTKA) K112531
& NN110676 and K120115, respectively. The financial support of the
Hungarian National Research, Development and Innovation Office through the GINOP‑2.3.2‑15‑2016‑00013 project "Intelligent materials based on functional surfaces—from syntheses to applications" and the Ministry of Human Capacities through the EFOP‑3.6.1‑16‑2016‑00014 project and the Grant 20391‑3/2018/FEKUSTRAT is acknowledged.
Open Access This article is licensed under a Creative Commons Attri‑
bution 4.0 International License, which permits use, sharing, adapta‑
tion, distribution and reproduction in any medium or format, as long as you give appropriate credit to the original author(s) and the source, provide a link to the Creative Commons licence, and indicate if changes were made. The images or other third party material in this article are included in the article’s Creative Commons licence, unless indicated otherwise in a credit line to the material. If material is not included in the article’s Creative Commons licence and your intended use is not permitted by statutory regulation or exceeds the permitted use, you will need to obtain permission directly from the copyright holder. To view a copy of this licence, visit http://creat iveco mmons .org/licen ses/by/4.0/.
Fig. 11 a Recyclability study, b XRD of fresh and used and c SEM image of Cu–Fe/GO
References
1. Zhao M, Wang C, Zhang C, Wen Y, Liu W (2012) Enantioselec‑
tive cytotoxicity profile of o, p′‑DDT in PC 12 cells. PLoS ONE 7(8):e43823. https ://doi.org/10.1371/journ al.pone.00438 23 2. Tian H, Li J, Zou L, Mu Z, Hao Z (2009) Removal of DDT from
aqueous solutions using mesoporous silica materials. J Chem Technol Biotechnol 84(4):490–496. https ://doi.org/10.1002/
jctb.2067
3. Konstantinou IK, Albanis TA (2003) Photocatalytic transforma‑
tion of pesticides in aqueous titanium dioxide suspensions using artificial and solar light: intermediates and degradation pathways.
Appl Catal B 42(4):319–335. https ://doi.org/10.1016/S0926
‑3373(02)00266 ‑7
4. Kang S, Liu S, Wang H, Cai W (2016) Enhanced degradation performances of plate‑like micro/nanostructured zero valent iron to DDT. J Hazard Mater 307:145–153. https ://doi.org/10.1016/j.
jhazm at.2015.12.063
5. El‑Temsah YS, Sevcu A, Bobcikova K, Cernik M, Joner EJ (2016) DDT degradation efficiency and ecotoxicological effects of two types of nano‑sized zero‑valent iron (nZVI) in water and soil.
Chemosphere 144:2221–2228. https ://doi.org/10.1016/j.chemo spher e.2015.10.122
6. Tian H, Li J, Mu Z, Li L, Hao Z (2009) Effect of pH on DDT deg‑
radation in aqueous solution using bimetallic Ni/Fe nanoparticles.
Sep Purif Technol 66(1):84–89. https ://doi.org/10.1016/j.seppu r.2008.11.018
7. Cheng M, Zeng G, Huang D, Lai C, Xu P, Zhang C, Liu Y (2016) Hydroxyl radicals based advanced oxidation processes (AOPs) for remediation of soils contaminated with organic compounds:
a review. Chem Eng J 284:582–598. https ://doi.org/10.1016/j.
cej.2015.09.001
8. Wang N, Zheng T, Zhang G, Wang P (2016) A review on Fenton‑
like processes for organic wastewater treatment. J Environ Chem Eng 4(1):762–787. https ://doi.org/10.1016/j.jece.2015.12.016 9. Wang M, Fang G, Liu P, Zhou D, Ma C, Zhang D, Zhan J (2016)
Fe3O4@β‑CD nanocomposite as heterogeneous Fenton‑like catalyst for enhanced degradation of 4‑chlorophenol (4‑CP). Appl Catal B 188:113–122. https ://doi.org/10.1016/j.apcat b.2016.01.071 10. Cheng R, Li G‑q, Cheng C, Shi L, Zheng X, Ma Z (2015) Catalytic
oxidation of 4‑chlorophenol with magnetic Fe3O4 nanoparticles:
mechanisms and particle transformation. RSC Adv 5(82):66927–
66933. https ://doi.org/10.1039/C5RA1 0433E
11. Xu LJ, Wang JL (2013) Degradation of chlorophenols using a novel Fe0/CeO2 composite. Appl Catal B 142–143:396–405. https ://doi.
org/10.1016/j.apcat b.2013.05.065
12. Xu L, Wang J (2015) Degradation of 2,4,6‑trichlorophenol using magnetic nanoscaled Fe3O4/CeO2 composite as a heterogeneous Fenton‑like catalyst. Sep Purif Technol 149:255–264. https ://doi.
org/10.1016/j.seppu r.2015.05.011
13. Vu TA, Le GH, Dao CD, Dang LQ, Nguyen KT, Dang PT, Tran HTK, Duong QT, Nguyen TV, Lee GD (2014) Isomorphous sub‑
stitution of Cr by Fe in MIL‑101 framework and its application as a novel heterogeneous photo‑Fenton catalyst for reactive dye degrada‑
tion. RSC Adv 4(78):41185–41194. https ://doi.org/10.1039/C4RA0 6522K
14. Ma J, Yang Q, Wen Y, Liu W (2017) Fe‑g‑C3N4/graphitized mesoporous carbon composite as an effective Fenton‑like cata‑
lyst in a wide pH range. Appl Catal B 201:232–240. https ://doi.
org/10.1016/j.apcat b.2016.08.048
15. Guo S, Zhang G, Guo Y, Yu JC (2013) Graphene oxide–Fe2O3 hybrid material as highly efficient heterogeneous catalyst for deg‑
radation of organic contaminants. Carbon 60:437–444. https ://doi.
org/10.1016/j.carbo n.2013.04.058
16. Hossain MN, Wen J, Chen A (2017) Unique copper and reduced graphene oxide nanocomposite toward the efficient electrochemi‑
cal reduction of carbon dioxide. Sci Rep 7(1):3184. https ://doi.
org/10.1038/s4159 8‑017‑03601 ‑3
17. Wu K, Jing C, Zhang J, Liu T, Yang S, Wang W (2019) Magnetic Fe3O4@CuO nanocomposite assembled on graphene oxide sheets for the enhanced removal of arsenic(III/V) from water. Appl Surf Sci 466:746–756. https ://doi.org/10.1016/j.apsus c.2018.10.091 18. Le GH, Ngo QT, Nguyen TT, Nguyen QK, Quan TTT, Vu LD, Lee
GD, Vu TA (2018) High catalytic activity of phenol photodegrada‑
tion from aqueous solution with novel Fe–Fe3O4–GO nanocompos‑
ite. J Mater Eng Perform 27(8):4225–4234. https ://doi.org/10.1007/
s1166 5‑018‑3496‑2
19. Guo S, Zhang G, Yu JC (2015) Enhanced photo‑Fenton degrada‑
tion of rhodamine B using graphene oxide–amorphous FePO4 as effective and stable heterogeneous catalyst. J Colloid Interface Sci 448:460–466. https ://doi.org/10.1016/j.jcis.2015.02.005
20. Khan M, Tahir MN, Adil SF, Khan HU, Siddiqui MRH, Al‑wart‑
han AA, Tremel W (2015) Graphene based metal and metal oxide nanocomposites: synthesis, properties and their applications. J Mater Chem A 3(37):18753–18808. https ://doi.org/10.1039/C5TA0 2240A 21. Bhunia P, Kim G, Baik C, Lee H (2012) A strategically designed porous iron–iron oxide matrix on graphene for heavy metal adsorp‑
tion. Chem Commun 48(79):9888–9890. https ://doi.org/10.1039/
C2CC3 5120J
22. Chen J, Yao B, Li C, Shi G (2013) An improved Hummers method for eco‑friendly synthesis of graphene oxide. Carbon 64:225–229.
https ://doi.org/10.1016/j.carbo n.2013.07.055
23. Hou H, Hu X, Liu X, Hu W, Meng R, Li L (2015) Sulfonated gra‑
phene oxide with improved ionic performances. Ionics 21(7):1919–
1923. https ://doi.org/10.1007/s1158 1‑014‑1355‑1
24. Ning W‑S, Wang T, Chen H, Yang X, Jin Y (2017) The effect of Fe2O3 crystal phases on CO2 hydrogenation. PLoS ONE 12:e0182955. https ://doi.org/10.1371/journ al.pone.01829 55 25. Melero JA, Calleja G, Martínez F, Molina R (2006) Nanocom‑
posite of crystalline Fe2O3 and CuO particles and mesostructured SBA‑15 silica as an active catalyst for wet peroxide oxidation pro‑
cesses. Catal Commun 7(7):478–483. https ://doi.org/10.1016/j.catco m.2006.01.008
26. Huang X, Zhou X, Qian K, Zhao D, Liu Z, Yu C (2012) A mag‑
netite nanocrystal/graphene composite as high performance anode for lithium‑ion batteries. J Alloys Compd 514:76–80. https ://doi.
org/10.1016/j.jallc om.2011.10.087
27. Pham VH, Cuong TV, Hur SH, Oh E, Kim EJ, Shin EW, Chung JS (2011) Chemical functionalization of graphene sheets by solvother‑
mal reduction of a graphene oxide suspension in N‑methyl‑2‑pyrro‑
lidone. J Mater Chem 21(10):3371–3377. https ://doi.org/10.1039/
C0JM0 2790A
28. Sarkar C, Dolui SK (2015) Synthesis of copper oxide/reduced graphene oxide nanocomposite and its enhanced catalytic activity towards reduction of 4‑nitrophenol. RSC Adv 5(75):60763–60769.
https ://doi.org/10.1039/C5RA1 0551J
29. Singh P, Nath P, Arun RK, Mandal S, Chanda N (2016) Novel syn‑
thesis of a mixed Cu/CuO‑reduced graphene oxide nanocomposite with enhanced peroxidase‑like catalytic activity for easy detec‑
tion of glutathione in solution and using a paper strip. RSC Adv 6(95):92729–92738. https ://doi.org/10.1039/C6RA2 0882G 30. Lu J, Jiao X, Chen D, Li W (2009) Solvothermal synthesis and
characterization of Fe3O4 and γ‑Fe2O3 nanoplates. J Phys Chem C 113(10):4012–4017. https ://doi.org/10.1021/jp810 583e
31. He Y, del Valle A, Qian Y, Huang Y‑F (2017) Near infrared light‑
mediated enhancement of reactive oxygen species generation through electron transfer from graphene oxide to iron hydroxide/
oxide. Nanoscale 9(4):1559–1566. https ://doi.org/10.1039/C6NR0 8784A
32. Di Castro V, Ciampi S (1995) XPS study of the growth and reactiv‑
ity of Fe/MnO thin films. Surf Sci 331–333:294–299. https ://doi.
org/10.1016/0039‑6028(95)00190 ‑5
33. Brunauer S, Emmett PH, Teller E (1938) Adsorption of gases in multimolecular layers. J Am Chem Soc 60(2):309–319. https ://doi.
org/10.1021/ja012 69a02 3
34. Chen Q, Wu P, Dang Z, Zhu N, Li P, Wu J, Wang X (2010) Iron pil‑
lared vermiculite as a heterogeneous photo‑Fenton catalyst for pho‑
tocatalytic degradation of azo dye reactive brilliant orange X‑GN.
Sep Purif Technol 71(3):315–323. https ://doi.org/10.1016/j.seppu r.2009.12.017
35. Gürkan R, Kartal‑Temel N, Ayan F (2015) Photocatalytic TiO2‑cat‑
alyzed degradation of bromophenol blue‑mediated Mo(IV)‑peroxo complexes in the presence of SDS. Desalin Water Treat. https ://doi.
org/10.13140 /RG.2.1.5186.1844
36. Hu X‑j, Liu Y‑g, Zeng G‑m, Wang H, You S‑h, Hu X, Tan X‑f, Chen A‑w, Guo F‑y (2015) Effects of inorganic electrolyte anions on enrichment of Cu(II) ions with aminated Fe3O4/graphene oxide:
Cu(II) speciation prediction and surface charge measurement.
Chemosphere 127:35–41. https ://doi.org/10.1016/j.chemo spher e.2015.01.013
37. Yazici E, Deveci H (2010). Factors affecting decomposition of hydrogen peroxide. https ://doi.org/10.13140 /RG.2.1.1530.0648 38. Sahel K, Elsellami L, Mirali I, Dappozze F, Bouhent M, Guillard
C (2016) Hydrogen peroxide and photocatalysis. Appl Catal B 188:106–112. https ://doi.org/10.1016/j.apcat b.2015.12.044 39. Zhang J, Zhang X, Wang Y (2016) Degradation of phenol by a
heterogeneous photo‑Fenton process using Fe/Cu/Al catalysts. RSC Adv 6(16):13168–13176. https ://doi.org/10.1039/C5RA2 0897A 40. Wang H, Tian H, Hao Z (2012) Study of DDT and its derivatives
DDD, DDE adsorption and degradation over Fe‑SBA‑15 at low temperature. J Environ Sci 24(3):536–540. https ://doi.org/10.1016/
S1001 ‑0742(11)60800 ‑0
41. Pan X, Lin D, Zheng Y, Zhang Q, Yin Y, Cai L, Fang H, Yu Y (2016) Biodegradation of DDT by Stenotrophomonas sp. DDT‑
1: aharacterization and genome functional analysis. Sci Rep 6(1):21332. https ://doi.org/10.1038/srep2 1332
Publisher’s Note Springer Nature remains neutral with regard to jurisdictional claims in published maps and institutional affiliations.