Contents lists available atScienceDirect
Journal of Hazardous Materials
journal homepage:www.elsevier.com/locate/jhazmat
Chronic responses of aerobic granules to the presence of graphene oxide in sequencing batch reactors
Alfonz Kedves
a, Levente Sánta
a, Margit Balázs
b, Péter Kesser ű
b, István Kiss
b, Andrea Rónavári
a, Zoltán Kónya
a,c,*
aDepartment of Applied and Environmental Chemistry, University of Szeged, Szeged, Hungary
bBay Zoltán Nonprofit Ltd. for Applied Research, BAY-BIO Division for Biotechnology, Szeged, Hungary
cMTA-SZTE Reaction Kinetics and Surface Chemistry Research Group, Szeged, Hungary
G R A P H I C A L A B S T R A C T
A R T I C L E I N F O
Editor: R. Debora Keywords:
Biological wastewater treatment Water chemistry
Extracellular polymeric substances Microbial community structure
A B S T R A C T
The chronic responses of aerobic granular sludge (AGS) to the presence of graphene oxide nanoparticles (GO NPs) (5, 15, 25, 35, 45, 55, 65, 75, 85, and 95 mg/L of GO NPs for 7 days) during biological wastewater treatment processes were investigated. Bioreactor performance, extracellular polymeric substance (EPS) secre- tion, and microbial community characteristics were assessed. The results showed that the effects of GO NPs on bioreactor performances were dependent on the dose applied and the duration for which it was applied. At concentrations of 55, 75, and 95 mg/L, GO NPs considerably inhibited the efficiency of organic matter and ammonia removal; however, nitrite and nitrate removal rates were unchanged. Biological phosphorus removal decreased even when only low concentrations of GO NPs were used. The secretion of EPS, which could alleviate the toxicity of GO NPs, also changed. The increased amount of nanoparticles also resulted in significant changes to the bacterial community structure. Based on the amplicon sequencing of 16S rRNA genes,Paracoccussp., Klebsiellasp., andAcidovoraxspecies were identified as the most tolerant strains.
1. Introduction
Carbon-based nanomaterials, such as fullerenes, carbon nanotubes,
and graphene derivatives, are extensively used (Lalwani et al., 2016;
Wang et al., 2019a), and thus, their global production is continuously increasing (Nguyen and Rodrigues, 2018). The global graphene
https://doi.org/10.1016/j.jhazmat.2019.121905
Received 5 August 2019; Received in revised form 13 December 2019; Accepted 14 December 2019
⁎Corresponding author at: Department of Applied and Environmental Chemistry, University of Szeged, H-6720 Szeged, Rerrich Béla tér 1, Hungary.
E-mail address:konya@chem.u-szeged.hu(Z. Kónya).
Available online 16 December 2019
0304-3894/ © 2019 The Authors. Published by Elsevier B.V. This is an open access article under the CC BY license (http://creativecommons.org/licenses/BY/4.0/).
T
productions market is expected to grow $195 million by 2022 (Lin et al., 2019) or even approximately $1.3 billion by 2023 (Zhou et al., 2019a). Graphene oxide nanoparticles (GO NPs) are typically synthe- sizedviachemical oxidation of graphite (Krishnamoorthy et al., 2012).
As a result of their excellent electrochemical properties, they are widely used in industry as sensors and semiconductors as well as in energy storage and water purification (Serrano-Luján et al., 2019; Ren and Cheng, 2014;Xiong et al., 2019); however, the biomedical applications of GO NPs is also increasing (Nanda et al., 2015). Due to their facile preparation and the variety of possible applications, GO is the most commonly produced carbon-based nanomaterial (Tiwari et al., 2018).
The GO NPs are biotoxic to rhizobacteria (Gurunathan, 2015),Pseu- domonas putida (Combarros et al., 2016), phytopathogenic bacterium (Chen et al., 2013), and marine organisms (Katsumiti et al., 2017) and are known to reduce soil enzyme activity (Chung et al., 2015); however, the changes in microbial community weaken with increase in time and the effect of GO NPs on microbial community can be reversed after a single dosage (Xiong et al., 2018). The worldwide production and ap- plication of GO will, however, gradually promote their release into the environment (Kiser et al., 2009) and greater concentrations can be expected into the effluent wastewater (Suárez-Iglesias et al., 2017).
Moreover, dispersion and long-term stability of GO NPs in water, these particles would inevitably reach in the wastewater, accumulate in wastewater treatment plants (Nguyen and Rodrigues, 2018;Zhou et al., 2019a; Ünşar et al., 2016; Ahmed and Rodrigues, 2013; Guo et al., 2018; Batley et al., 2013) and present potential risks to biological wastewater treatment processes (Chen et al., 2016); therefore, it is an urgent need to assess their potential negative effects. Keller and Lazareva (2013)reported that the engineered nanomaterial (ENM) can be detected in the effluent wastewater, although with high content of the biosolid ENM at approximately 150 mg/kg (Keller and Lazareva, 2013).
The conventional activated sludge (CAS) process is the most com- monly used technology in the biological treatment of sewage, wherein the microbial community degrades organic matter and removes excess nutrients (nitrogen and phosphorus) (Suárez-Iglesias et al., 2017). The concentration of pollutants in wastewater continuously increases, its composition changes, and the microorganisms used are sensitive to these environmental changes (Ren, 2004; Wang et al., 2019b; Zhou et al., 2019b). Therefore, during the biological wastewater treatment processes, the use of chemical additives is frequent, according to the European Urban Waste Water Treatment Directive 91/271/EC (Kelessidis and Stasinakis, 2012). GO NPs have a probable negative effect on the activity of microorganisms during the biological process.
According to recent research, GO NPs proved to be a hazardous com- ponent with a negative effect on CAS processes (Nguyen and Rodrigues, 2018;Ahmed and Rodrigues, 2013).
The aerobic granular sludge (AGS) processes is a relatively new procedure in wastewater treatment and is a current research focus among scientists and engineers (Szabó et al., 2017; Corsino et al., 2017). AGS processes have many advantages when compared with the activated sludge, for example, tolerance to toxic compounds, excellent settling ability, rich microbial composition, and simultaneous organic, nitrogen, and phosphorus removal (He et al., 2016;Szabó et al., 2016).
Furthermore, AGS can also be used to treat high-strength wastewater (Li et al., 2008; Angela et al., 2011). During granulation, numerous bacterial strains produce extracellular polymeric substances (EPS), mostly polysaccharides and proteins, in which are embedded different microbial strains (Zhang et al., 2016;Adav et al., 2008) capable of the adsorption of various nutrients (Yan et al., 2016). AGS is resilient to shocks and toxins, because of the specific microbial interactions (Quan et al., 2015); furthermore, owning to the high amount of EPS exerting a protective effect (Liu et al., 2009), it is applicable to the removal of various xenobiotics, including phenols (Jiang et al., 2004), anilines (Dai et al., 2015), dyes (Franca et al., 2015), and pharmaceuticals (Zhao et al., 2015).
The electronic waste is typically disposed via landfills. Although the landfills are insulated, the leachate is able to escape back into the soil.
Because the effects of GO particles have a high mobility in the soil and has been already studied (Chung et al., 2015;Xiong et al., 2018;Qi et al., 2014); we desired to investigate the effects of GO NPs in another final destination, in a wastewater treatment system. The long-term ef- fects of GO NPs on AGS have not been investigated thoroughly. In limited previous publications on this topic, the effect of GO NPs at 60 mg/L concentration on the AGS was evaluated. The change in ni- trogen and phosphorus removal efficiency during batch tests were measured for 4–5 h (Liu et al., 2017a). The effect of chronic exposure of GO NPs on AGS bioreactor performance, EPS production, and microbial community thus remains unstudied.
We have limited available information regarding its impact on conventional wastewater treatment (in the case of AGS, we have in- formation only from batch test results), we set up sequencing batch reactor (SBR) systems able to give a realistic approach, in order to gather more detailed information about the effect of nanoparticles on AGS processes.
The aim of this study was to assess the chronic response of several concentrations of GO NPs on the biological treatment processes, nu- trient removal, EPS production, and microbial community in the case of granulated SBR. For the most common CAS processes, GO NPs have a negative effect, even at low concentrations. Granulated bioreactors were fed with different concentrations of GO NPs for 7 days. The chronic exposure was investigated based on theNguyen and Rodrigues (2018), where the applied experimental time in their study was longer (10 days) than ours and the number of applied cycles was 20 (12 h cycle duration) (Nguyen and Rodrigues, 2018). In this study the experimental time was 7 day; however, 42 cycles for each experiment were applied;
accordingly, we have adopted the expression“chronic exposure”for our study.
During these experiments, we monitored reactor performance by measuring the chemical oxygen demand (COD) and the removal of ammonium nitrogen (NH4-N), nitrite nitrogen (NO2-N), nitrate nitrogen (NO3-N), and phosphorus (PO4-P). GO NP release in the effluent was also measured using Raman spectroscopy. After exposure, the amounts of biomass and EPS were also examined. Furthermore, changes in the microbial community were investigated using 16S rRNA gene sequence analysis.
2. Materials and methods
2.1. Preparation and characterization of GO NPs
A modified Hummer’s method was used to prepare GO NPs (Varga et al., 2018). All chemicals used were of reagent grade (Sigma-Aldrich).
Firstly, 9 g of graphite powder and 9 g of sodium nitrate (NaNO3) were mixed with 420 mL concentrated sulfuric acid (H2SO4) solution at 0 °C in an ice bath for 30 min. This solution was oxidized by slowly adding 54 g of potassium permanganate (KMnO4) and stirring at ambient temperature for 1 day. The mixture was then supplemented with 1000 mL deionized water and 20 mL 30 % (w/w) hydrogen peroxide (H2O2) and stirred at 0 °C for 1 h. Thereafter, the product was washed with an excess of distilled water, and the resulting brownish GO NPs were freeze-dried. For these measurements, 15 g/L GO stock solution (in distilled water) was prepared and stored in the dark for the duration of the experiment.
To assess particle size and morphology of the prepared GO NPs, transmission electron microscopy (TEM) at 200 kV and scanning elec- tron microscopy (SEM) at 10 kV accelerating voltage were used (FEI Tecnai G2 20 X-Twin microscope and Hitachi S-4700 Type II FE-SEM microscope). For TEM imaging, the GO suspension was drop-casted onto a carbon grid (0.05 mg/ml), whereas the GO samples were lyo- philized and analyzed in powder form on carbon tape for SEM mea- surements. The crystalline structure of the particles was characterized
viaX-ray diffraction (XRD) using a Rigaku MiniFlex II powder X-ray diffractometer with a Cu Kαirradiation source. The scanning rate was 2°min−1over a 2θ range of 5°–40°. The molecular structure of the particles obtained was investigated through Raman spectroscopy using a Senterra II Raman microscope at 532 nm excitation wavelength, 6.25 mW laser power, and 1 cm−1spectral resolution in the range of 1000–3000 cm−1. Samples were placed on a clean SiO2/Si substrate prior to measurement. Dynamic light scattering (DLS) analysis using a Zetasizer Nano Instrument was used to assess the average hydro- dynamic diameters (Z-average) and zeta potentials (ζ-potential) of the particles.
2.2. Configuration of AGS reactors
Activated sludge (AS) was obtained from an urban wastewater treatment plant (Szeged, Hungary). The AGS was cultivated in a SBR with a height to diameter ratio of 7 and an effective working volume of 1.4 L. Air bubbles (superficial air velocity of 2.2 cm/s), which provided oxygenation and guaranteed complete mixing, were supplied by diffu- sers located at the bottom of the reactor. The decant/feed volume was 50 % of the total volume for each cycle, and the hydraulic retention time was 8 h. The granulation process was accomplished using the biomass washout method (Wang et al., 2004).
The bioreactor was operated at 20 °C ± 3 °C in cycles of 4 h, in- cludingfilling (5 min), aeration (225 min), settling (5 min), and with- drawal (5 min) periods. pH was continuously measured and kept at 7.2 ± 0.2 using 1 M sodium hydroxide (NaOH) and 1 M hydrochloric acid (HCl) solutions. Peristaltic pumps were used for the filling and withdrawal of wastewater at controlled flow rates. The reactors were fed with synthetic wastewater (SWW), consisting of (per liter) 1300 mg COD added as glucose, 120 mg NH4-N added as NH4Cl, 20 mg PO4-P added as KH2PO4, 200 mg NaHCO3, 25 mg CaCl2, 45 mg MgSO4, and 1 mL trace element solution (Zheng et al., 2017).
During the experiments, six AGS bioreactors [each reactor con- taining 6.2 g/L mixed liquor suspended solids (MLSS)] were operated and fed with GO NP-contaminated SWW at different concentrations (5, 15, 25, 35, 45, 55, 65, 75, 85, and 95 mg/L GO NPs) and followed the cycle described above over 1 week (42 cycles for each experiment). The COD, NH4-N, NO2-N, NO3-N, and PO4-P concentrations were de- termined after every third cycle, and samples were taken at the end of each experiment to monitor the possible changes in EPS content, bio- mass, and microbial composition. During the experiments, samples from the effluents were analyzed using Raman spectroscopy to detect the presence of GO NPs, thereby evaluating the performance of was- tewater treatment of the granular sludge. The measurement setup for the Bruker Senterra II Raman Spectroscope was as described above.
2.3. Analytical methods
At every third cycle, the water chemistry of the effluent was ana- lyzed using HACH kits (Hach Lange, Düsseldorf, Germany) and an UV- VIS spectrophotometer (DR5000, Hach–Lange, Co., USA) to detect the following nutrients: COD (LCI400), NH4-N (LCK304), NO2-N (LCK341), NO3-N (LCK339), and PO4-P (LCK349). Furthermore, the MLSS, mixed liquor volatile suspended solids (MLVSS), and sludge volume index
were also measured at 30 and 5 min (SVI30and SVI5) using standard methods (Vashi et al., 2019).
During the extraction of EPS, 20 mL MLSS from the reactors was washed three times with deionized water. After centrifugation (5000g, 4 °C, 10 min), the supernatant was discarded and the pellet re- suspended. The sludge mixture was then heated at 80 °C for 30 min under continuous stirring (200 rpm), and the resulting mixture was centrifuged and its supernatantfiltered (0.45μm) (Li and Yang, 2007).
The polysaccharide (PS) and protein (PN) contents in the EPS were assessed using the Anthrone (glucose as the standard) and modified Lowry (bovine serum albumin as the standard) methods (Zhang et al., 2017). The EPS was considered to be the sum of PN and PS. All analyses were performed in triplicate.
SEM was used to investigate changes in the structure and mor- phology of granular sludge due to GO NP addition. SEM sludge samples were prepared by fixation with 2.5 wt% glutaraldehyde in 0.1 M phosphate buffer at 4 °C overnight. Thereafter, samples were washed with 0.1 M sodium cacodylate buffer, dehydrated with ethanol, and freeze-dried. Before SEM imaging, specimens were spray-coated with silver (Quorum Technologies, SC7620) to improve the electrical con- ductivity of the sample surface (Araujo et al., 2003).
2.4. DNA extraction, polymerase chain reaction (PCR) amplification, denaturing gradient gel electrophoresis (DGGE), and 16S rRNA gene amplicon sequencing
In order to reveal the shifts in microbial community structure during the granulation process and after GO NP exposure (15, 25, 35, and 95 mg/L), samples were obtained from the AS, initial granular sludge, and the GO NP-exposed AGS at the end of each experiment. From each sample, DNA was extracted, and PCR amplification and DGGE was performed.
A volume of 1.5 mL of each sample was centrifuged at 5000gand 4 °C for 2 min to remove the supernatant. The DNA was isolated from the pellets using DNeasy PowerSoil Kit (Qiagen) according to manu- facturer instructions, and the extracted DNA was used as a template for PCR. DNA concentration was measured via fluorimetry (Qubit, Invitrogen).
Bacteria-specific primers used in this study are shown inTable 1.
The eubacteria-specific primers EubA and EubB were used to amplify the 16S rRNA gene fragments. In thefirst PCR reaction, 30μL reaction mixture contained 0.6 U of KOD Hot Start DNA polymerase (Novagen), 3μL of 10× buffer for KOD Hot Start DNA polymerase, 1.8μL of MgSO4
(25 mM), 3μL of dNTPs (2 mM of each), 0.9μL of primers (10μM), and 1 ng of DNA template. Amplification used a PTC 200 Peltier Thermal Cycler (Bio-Rad Laboratories) system with a 5 min initial denaturing step at 95 °C, followed by 30 cycles of 20 s at 95 °C, 10 s at 55 °C, and 40 s at 70 °C, and thefinal extension was performed for 5 min at 70 °C (Balázs et al., 2013). The size and quality of PCR products were ana- lyzed by electrophoresis on a 1 % agarose gel.
In the second PCR, amplification of V3-V8 variable region of the 16S rRNA gene and the attachment of GC-clamp were conducted using the primers 341 F-GC and 907R. Every reaction mixture (in 30μL total volume) consisted of 0.6 U of KOD Hot Start DNA polymerase, 3μL of 10× buffer for KOD Hot Start DNA polymerase, 1.8μL of MgSO4
Table 1
Primers used in this study.
Primer Position Sequence (5’-3’) References
EubB (27 F) 8-27 AGAGTTTGATCMTGGCTCAG (Suzuki et al., 1996)
EubA (1522R) 1509-1522 AAGGAGGTGATCCANCCRCA (Suzuki et al., 1996)
341 F 341-357 CCTACGGGAGGCAGCAG (Watanabe et al., 2001)
341 F-GCa 341-357 GC-clamp-CCTACGGGAGGCAGCAG (Teske et al., 1996)
907R 907-928 CCCCGTCAATTCCTTTGAGTTT (Teske et al., 1996)
a GC-clamp connected to the 5 end of 341 F: CGCCCGCCGCGCGCGGCGGGCGGGGCGGGGGCACGGGGGG.
(25 mM), 3μL of dNTPs (2 mM), 0.9μL primers (10μM), and 1μL of 16S rRNA gene amplicon. The PCR program was performed with a 2 min initial denaturing step at 95 °C, followed by six cycles of dena- turation at 95 °C for 20 s, touchdown annealing at 63 °C for 10 s (with the temperature decreasing 0.5 °C at every cycle), and an extension at 70 °C for 15 s. Nine additional cycles were carried out at an annealing temperature of 55 °C, and thefinal extension lasted at 70 °C for 5 min.
The PCR products were analyzed by electrophoresis on a 1.5 % agarose gel. Each PCR reaction was carried out in triplicate.
DGGE was conducted using a DCode System (Bio-Rad Laboratories).
A volume of 6μL PCR products were separated onto a 7 % poly- acrylamide gel (acrylamide bisacrylamide ratio of 37:1 in 1 × TAE buffer) containing a linear denaturing gradient of between 50 % and 60
% urea and formamide (100 % denaturant composed of 40 % for- mamide and 7 M urea). Electrophoresis was performed at 100 V and 60 °C (constant) for 16 h, after which the gels were soaked for 30 min in 1 × TAE buffer containing ethidium bromide (0.5 mg/L).
Digitalized DGGE banding patterns were analyzed using PyElph 1.3 software and the unweighted pair group method with arithmetic mean (UPGMA) based on the similarity matrices obtained to create the den- drogram (Brânduşa Pavel and Ioan Vasile, 2012). Redundancy analyses (RDA) was performed to assess the relationship between the predefined environmental factors and microbial communities (Xiong et al., 2018).
Amplicon sequencing of 16S rRNA genes was used to reveal the impact of GO NP exposure on the bacterial strains which could play a vital role in AGS wastewater treatment processes. Individual bands were excised from gels and incubated in 50μL Milli-Q water at 4 °C for 12 h. A volume of 5μL of water from the supernatant was used as the template for re-amplification. Amplicons were subjected to DNA se- quence analysis at the automatic sequencing facility of Microsynth AG with 341 F and 907R forward and reverse sequencing primers. Finally, the sequences were analyzed by comparing with those available in the National Center for Biotechnology Information (NCBI) database using the standard nucleotide–nucleotide BLAST program (Benson, 2003), in order to ascertain their closest relatives.
3. Results and discussion 3.1. Characterization of GO NPs
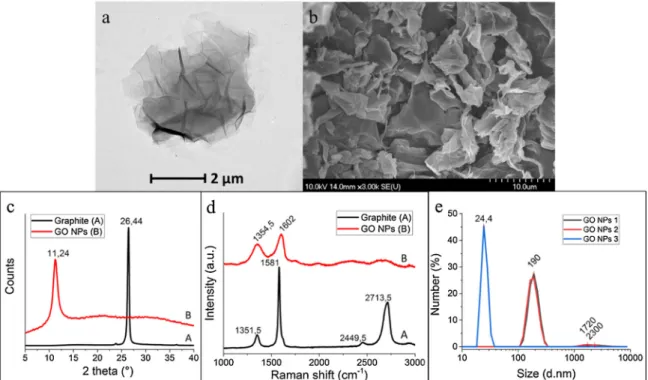
Samples were investigated by TEM and SEM to evaluate the mor- phology of their nanoparticles. TEM and SEM images (Fig. 1a–b) showed that the GO sheets were smooth and had a tendency to scroll and wrinkle (Stobinski et al., 2014;Stankovich et al., 2006). The XRD pattern of the graphite powder is illustrated inFig. 1c. A strong, sharp reflection peak at 26.44° referred to a higher-order structure and cor- responds to an interlayer spacing of approximately 3.36 Å (0.336 nm).
The XRD patterns of GO samples showed that, with oxidation, a new broad peak formed at 2θ= 11.24° with an interlayer spacing of ap- proximately 7.86 Å (0.786 nm) (Perez et al., 2017). Raman spectro- scopy was used for further structural analysis. In the case of graphite powder, the D peak located at∼1350 cm−1was absent, but this peak was present in GO NPs. Raman spectra of graphene oxide demonstrated the characteristic G (1602 cm−1) and D (1354.5 cm−1) bands of car- bonaceous materials (Fig. 1d) (Gurunathan, 2015; Zhu et al., 2010).
Based on DLS measurements, the zeta potential of sheets was around
−21 ± 0.5 mV, and particle sizes ranged from 24.4–190 nm (Fig. 1e).
3.2. Effects of GO NPs on reactor performance
In freshly collected AS, small granules formed (0.5–0.7 mm in size) after 18 days. After 4 weeks of operation, the bioreactor reached a steady state, and the granules attained a nearly spherical shape and an increased size of 2–10 mm. The granules had a compact and dense structure (Fig. 2a–b). At the surface, numerous microbes were found in the EPS matrix, especially cocci (Fig. 2a). The interior contained many
aggregated rods and cocci (Fig. 2b). During the granulation process, the MLSS increased to 6.2 from 2.3 g/L, whereas SVI5decreased to 32 from 219 mL/g. The AGS had an outstanding settling capacity, because its settling velocity increased from 0.2–53 m/h.
The effluent COD, NH4-N, NO2-N, NO3-N, and PO4-P contents were 83 ± 1.65, 0.05 ± 0.01, 0.03 ± 0.01, 0.312 ± 0.01, and 0.79 ± 0.12 mg/L. The removal efficiencies of COD, NH4-N, and PO4-P were 93.5 %, 99.95 %, and 96 %, respectively.
The performance of the built-up AGS reactors in the chronic re- sponse of GO NPs at different concentrations (5, 15, 25, 35, 45, 55, 65, 75, 85, and 95 mg/L) was monitored by measuring the major water chemistry parameters: COD, NH4-N, NO2-N, NO3-N, and PO4-P; fur- thermore, the properties of the sludge (MLSS, settling velocity and SVI5) were also determined. In order to avoid the interpretation of crowed figures, we solely demonstrated those results that led to changes in the systems. The results of the addition of GO NPs at 5, 45, 65, and 85 mg/L concentrations are provided in the supporting information (Figs. S1, S2, and S3).
Throughout the experiments, the presence of GO NPs in the effluent was monitored using Raman spectroscopy in order to avoid their entry into the environment. According to these measurements, GO NPs were not detected in the effluent, even when the inlet contained 95 mg/L GO NPs. This suggests that the nanoparticles accumulated in the granular sludge and did not reach the environment to cause further adverse ef- fects in aquifers.
3.2.1. COD removal
After the addition of GO NPs at 15 mg/L concentration, COD re- moval remained relatively stable compared with the control reactor, and only a slight increase of COD was observed in the effluent after 6.5 days (Fig. 3). When the SWW contained 25 or 35 mg/L GO NPs, the concentration of COD in the effluent increased moderately after 5.5 and 4 days. After 7 days, COD concentrations were 151 ± 3.9 and 173 ± 2.9 mg/L. The COD removal rate started to decrease after 2 days and dropped significantly after 4 days with the addition of GO NPs at 55 mg/L concentration. In the case of 75 mg/L GO NP, a rapid negative impact on the COD removal was observed. This suggests that micro- organisms in the granular sludge were able to adapt to the new en- vironmental conditions, when the amount of GO NPs was increased slowly. This phenomenon has also been observed in other materials during wastewater treatment processes (Amin et al., 2014;Chen and Gu, 2005). In the case of the addition of 95 mg/L GO NPs, COD con- centrations in the effluent continuously increased after thefirst day of experiment. After 7 days, the COD value was around 342 ± 2.5 mg/L, and the removal efficiency dropped to 73.7 %.
These observations correspond to the literature, where authors re- ported that short- and long-term exposure of GO NPs on AS had a ne- gative effect on COD removal. For example, chronic toxicity was ob- served after 5.5 and 3 days, when the amounts of accumulated GO nanoparticles were 3.6 and 12.8 mg. COD concentrations in the effluent exceeded the limit permitted by Directive 91/271/EEC during the fourth day of the experiment (Nguyen and Rodrigues, 2018).
Ahmed and Rodrigues (2013)also showed in a short-term exposure study (5 h, 20 mL activated sludge) that the addition of 10 mg/L GO NP negatively influenced organic carbon removal in AS (Ahmed and Rodrigues, 2013). In our study, we also observed an inhibitory effect on COD removal after 6 days of dosage at 25 mg/L GO NPs, when the calculated amount of nanoparticles was approximately 577 mg in the AGS. Our results suggest that the granules were more tolerant to GO NP exposure than the AS, because the negative effect occurred at much higher accumulated particle volume.
3.2.2. Nitrogen removal
In our experiments, the addition of GO NPs at different concentra- tions did not influence the removal of nitrite and nitrate. In all analyses, the concentrations of these components remained stable throughout the
whole operation period, even in the control bioreactor. These results are in accordance with previous AGS studies wherein nanoparticles (CuO NPs and Ag NPs), even in high concentration (50 mg/L), the ni- trite and nitrate removal remained unaffected; moreover, it could be enhanced (Quan et al., 2015;Zheng et al., 2017).Ahmed and Rodrigues (2013)andNguyen and Rodrigues (2018)also reported that in case of CAS the removal efficiency of nitrate was stable by addition of GO (Nguyen and Rodrigues, 2018;Ahmed and Rodrigues, 2013). This may
be caused by EPS protection of the microbial community (Fig. 2c);
furthermore, less nitrate was being produced due to the reduced am- monia oxidation (Nguyen and Rodrigues, 2018; Zeng et al., 2016).
Denitrifying bacteria, which can remove these components, are pre- dominantly anoxic or facultatively anaerobic and are predominantly located inside the granules; thus, they are protected against GO NPs (Quan et al., 2015). This indicates that the nanoparticles were not able to exert a negative impact on the interior of the granules and could not Fig. 1. a) Transmission electron microscopic image of GO NPs;b) scanning electron microscopic image of GO NPs;c) XRD spectra of graphite and GO NPs;d) Raman spectra of graphite and GO NPs;e) DLS characterization of GO NPs.
Fig. 2.SEM images of AGS.a) exterior of granules;b)interior of granules;c)a sheet of GO NP on the surface of AGS;d) the surface of AGS after exposure of 95 mg/L GO NPs.
penetrate into the granular structure.
NH4-N removal was also significantly affected by GO NPs (Fig. 4). In the control AGS system, the removal efficiency of NH4-N was 99.95 %.
When aerobic granules were fed with 15 mg/L GO, no change in am- monia removal efficiency was observed. At 25 and 35 mg/L GO NPs, NH4-N concentration in the effluent increased marginally after 5.5 and 4 days. After 7 days, the concentrations of ammonia were 2.36 ± 0.03 and 3.29 ± 0.03 mg/L, respectively. In the case of 55 mg/L GO NPs, the ammonia concentration slightly increased after 3 days, and itsfinal concentration was 7.21 ± 0.29 mg/L after 7 days. When nanoparticle concentrations were 75 and 95 mg/L, the effluent NH4-N content in- creased to 13.47 ± 1.06 and 21.69 ± 1.23 mg/L, whereas the final removal rate decreased considerably to 88.7 % ± 1.5 % and 81.9
% ± 1.1 %.
He et al. (2017) reported similar observations, i.e., that ammonia nitrogen removal rate also decreased to 75.25 %, in their case, after long-term exposure of ZnO nanoparticles, due to increased nanoparticle concentrations in the AGS (He et al., 2017a).Nguyen and Rodrigues (2018)reported that GO NPs at low concentration (5 mg/L) were al- ready able to negatively impact NH4-N removal rates in the case of AS.
After 4 days, the effluent quality was inadequate for discharges, since the removal efficiency had decreased to approximately 30 % (Nguyen and Rodrigues, 2018).
According to a previous study (short-term exposure, 60 mg/L GO NP
concentration), the nitrification and denitrification processes were not influenced after 4 h (Guo et al., 2018). In our study, after the addition of 55 mg/L GO NPs, the nitrification rate decreased after 2.5 days. In the case of 95 mg/L GO NP exposure, nitrification decreased within a day, when the amount of accumulated GO NPs was above 285 mg. This suggests that GO NPs also had a negative effect on the nitrification in the AGS, but only at higher concentration and after a certain time had passed.
3.2.3. Phosphorus removal
GO NPs also had a negative impact on phosphorus removal, even at low concentrations (Fig. 5). In the control AGS reactor, the effluent phosphate concentration remained below 1 mg/L. At 15 and 95 mg/L GO NPs, the PO4-P concentration was 3.39 ± 0.07 and 6.32 ± 0.11 mg/L, and the removal decreased to 83.05 % and 68.4 % on the seventh day.
These results are in accordance with previous studies wherein GO, even in low concentrations, also had a negative effect on CAS after 7 days, when the removal efficiency decreased to 40 % (Nguyen and Rodrigues, 2018). When the aerobic granules were exposed to other nanoparticles, for instance, Zn or Cu NPs, the phosphorus removal rate also decreased, but only at higher concentrations of nanoparticles (above 20 mg/L) (Zheng et al., 2017;He et al., 2017a,b).
A possible reason for the different effects between the nanoparticles and GO NPs is their material and structural differences. The examined ZnO and Cu NPs had a nearly spherical shape, whereas the GO consisted of layered sheets (Fig. 1a and b). During the wastewater treatment process, granules in the reactor are constantly moving. Therefore, due to the layered structure of GO NPs, these particles can cause a physical damage to the granules. It is possible that GO NPs inhibited the pro- duction of polyhydroxyalkanoates (PHA) and negatively influenced the metabolism of polyphosphate-accumulating microorganisms (PAOs).
Furthermore, increased ammonia concentrations could also inhibit phosphorus removal, because PAOs are sensitive to high concentrations of ammonium (Zheng et al., 2013).
3.2.4. Impact of GO NPs on MLSS
Experiments were initiated with 6.2 ± 0.1 g/L MLSS. In the control AGS system, this value remained stable. In the case of 15 mg/L GO NPs, the MLSS content increased to 7.9 ± 0.14 g/L, suggesting that the nanoparticles had a positive effect on the amount of biomass. At 25 and 35 mg/L GO NP exposure, the MLSS content increased (7.6 ± 0.07 and 7.02 ± 0.11 g/L MLSS) relative to the control but was lower than in the system containing 15 mg/L GO NPs. In the case of 75 and 95 mg/L Fig. 3.COD in the effluent of control AGS reactor and the AGS reactors exposed
to GO NPs at different concentrations: 15, 25, 35, 55, 75, and 95 mg/L. Error bars are the standard deviation of triplicate measurements.
Fig. 4.NH4-N concentrations in the effluent of the control AGS reactor and the AGS reactors exposed to GO NPs at different concentrations: 15, 25, 35, 55, 75, and 95 mg/L. Error bars are the standard deviation of triplicate measurements.
Fig. 5.PO4-P concentrations in the effluent of the control AGS reactor and the AGS reactors exposed to GO NPs at different concentrations: 15, 25, 35, 55, 75, and 95 mg/L. Error bars are the standard deviation of triplicate measurements.
GO NP exposure, MLSS decreased drastically to 3.4 ± 0.24 and 3.3 ± 0.31 g/L. After the addition of 95 mg/L GO NPs, the settling velocity decreased to 21 m/h, and the SVI5 increased to 182 ± 0.16 mL/g. In addition, some structural changes in the AGS could be recognized. For example, filamentous microorganisms ap- peared on the outer surface of the granulated sludge (Fig. 2e), and the granules lost their initial compact and dense structure.
These results corroborate previous studies describing that biomass concentration influenced the removal of COD, nitrogen, and phosphate.
The decreasing amount of biomass could adversely affect the removal of COD, nitrogen, and phosphate (De Kreuk et al., 2005). Our results confirmed that AGS establishes resilience to the presence of GO NPs at low concentrations, but GO exposure at high concentrations can ne- gatively affect the reactor performance (the nanomaterials accumulated in the AGS due to continuous feeding), and the nanoparticles may have a negative effect both on biomass production and on biological COD, nitrogen, and phosphorus removal. This inhibitory effect has also been observed in the case of other nanoparticles, such as silver, zinc oxide, and cooper oxide, and in most cases, the decreasing nutrient removal efficiency is related to the rate of EPS secretion (Quan et al., 2015;
Zheng et al., 2017;He et al., 2017a,b).
3.3. Effects of GO NPs on secretion of EPS in AGS
The EPS contents in AGS were measured at different concentrations (5, 15, 25, 35, 45, 55, 65, 75, 85, and 95 mg/L) of GO NP exposure on day 7. The effects of GO NPs on EPS production during the experiments are illustrated inFigs. 6and S4. In the control system, EPS, PS, and PN contents were 5.95, 3.27, and 2.67 mg/g MLVSS, and the ratio of PN to PS (PN/PS) was 0.81.
GO NPs at 15, 25, and 35 mg/L concentrations had a positive effect on EPS secretion, which increased to 11.66, 8.44, and 8.17 mg/g MLVSS, respectively. PS concentrations slightly decreased, whereas the secretion of PN increased considerably to 8.28, 5.87, and 5.21 mg/g MLVSS. Therefore, EPS concentration and PN/PS ratio also significantly increased probably due to the induction of heat shock-like proteins against environmentally foreign matter (Zheng et al., 2017).
Nevertheless, when increasing the concentration of GO NPs to 55, 75, and 95 mg/L, EPS production decreased. At 95 mg/L GO NP con- centration, the EPS, PS, and PN contents decreased to 3.07, 1.48, and 1.59 mg/g MLVSS, respectively, i.e., twofold lower than in the control granular sludge.
These observations suggest that a high amount of protein protects microorganisms against the negative effects of GO nanoparticles. When the secretion of EPS was stimulated by GO NPs, their values were higher
than in the control system, and in the removal of organic matter and nitrogen, no obvious negative effects were observed. In contrast, high concentrations of GO NPs (55, 75, and 95 mg/L) reduced the amount of EPS in the AGS; thereby, both the reactor performance and biomass concentration also decreased. Furthermore, we also observed that changes in EPS affected the NH4-N removal rate, whereas a decrease in the amount of PN resulted in an increased ammonia concentration in the effluent wastewater.
A previous study showed that EPS probably has a significant role in biological phosphorus removal, because phosphorus can accumulate in the EPS matrix (Wang et al., 2014). Furthermore, the anaerobic con- dition decreases inside the granules as well as the amount of EPS, which might contribute to decreased PAO function (Angela et al., 2011). In our study, when granular sludge was exposed to low concentrations of GO NPs, phosphorus removal immediately decreased despite the high EPS content, contrary to previousfindings. This difference may have originated from microbial communities in different systems (Zhao et al., 2013).
Previous literature reports that the secretion of EPS and preferential production of PN over PS show a considerable dependence on the concentration of nanoparticles used. Our results are similar to those observed with long-term exposure of CuO particles. PN secretion was stimulated by the addition of nanoparticles at low concentrations (5 and 20 mg/L), whereas a decrease in the concentration of PN along with the diversity and richness of the microbial community at higher nanoparticle concentrations (50 mg/L) were observed (Zheng et al., 2017). ZnO NPs under shock-loading also stimulated the secretion of PN, whereas the concentration of PS remained relatively stable (He et al., 2017b). In the case of long-term exposure of ZnO NPs over 10 mg/L, EPS production and nitrogen removal were negatively influ- enced, and bacterial diversity was also decreased (He et al., 2017a). In contrast, in case of Ag NPs at 50 mg/L,Quan et al. (2015)experienced a significant reduction in the ammonia oxidation and denitrification rates, whereas the microbial community remained stable owing to the high amount of EPS (Quan et al., 2015).
The physical, chemical, and biological interaction mechanisms of the EPS with NPs are not yet fully understood. In the literature, the most important described physicochemical interactions between the EPS and NPs were the electrostatic, hydrophobic, and steric interac- tions. After the NPs attached to the EPS surface, they were able to migrate within the EPS matrix and cause cell death by interrupting the electron transport chain, or causing cell membrane breakage, pepti- doglycan damage, protein denaturation, and enzyme disruption (Qayyum and Khan, 2016;Fulaz et al., 2019). The decreased secretion of EPS in our systems was probably caused by the mentioned phe- nomena.
EPS certainly plays a vital role in the AGS wastewater treatment processes. Our results indicate that microbial populations were able to endure toxic chemicals up to certain concentrations (35 mg/L) probably due to the high amounts of EPS in the granular sludge. Decreasing the EPS concentration can be explained by the accumulation of GO NPs in the AGS and might result in microbial cell death; moreover, it is pos- sible that the granular sludge loses its ability to produce polymeric substances. To clarify this phenomenon, we performed microbial community analysis.
3.4. Microbial community analysis
To determine the influence of GO NPs on the diversity of the biome existing in AGS, microbial community analyses were performed.
Extracted DNA was amplified by PCR followed by DGGE separation, and the dominant bands were sequenced. Microbial analyses were performed on the initial activated and granular sludge samples and also on AGS systems fed with synthetic wastewater contaminated with GO NPs at different concentrations. We carried out analyses on AGS sys- tems, in which GO NPs began to negatively influence reactor Fig. 6.Composition and content of EPS in the control reactor (0 mg/L GO NPs)
and in the AGS reactors after the addition of GO NPs at different concentrations:
15, 25, 35, 55, 75, and 95 mg/L. Error bars are the standard deviation of tri- plicate measurements.
performance, according to preliminary experiments. Therefore, we ex- amined systems containing 15, 25, 35, or 95 mg/L GO NPs. In the latter case, the AGS bioreactor performance considerably collapsed and was compared with the initial granular sludge after nanoparticle exposure on the seventh day.
The extracted DNA concentration in the initial AS was 41.19 mg/g MLVSS, whereas the granular sludge contained 81.46 mg/g MLVSS (approximately a twofold increase), possibly due to increased biomass density (Dahalan et al., 2015). At 15 mg/L GO NP concentration, the DNA content was 84.2 mg/g MLVSS. In the case of 25, 35, and 95 mg/L GO NPs, the DNA concentration decreased rapidly to 47.98, 39.52, and 23.08 mg/g MLVSS, respectively. Due to the membrane disruptive ef- fect of GO NPs (Liu et al., 2011), when it reaches a critical concentra- tion, bacteria were unable to maintain their EPS and MLSS synthesizing activities. In the long term, it may cause cell destruction that can be detected via decreased DNA concentration. The remaining viable cells, which are less in number, were unable to remove the same amount of nutrients.
DGGE analysis was used to investigate the variations in microbial community composition with or without GO NPs. During sludge gran- ulation, some strains disappeared; however, some intensified fragments were also observed. Hence, the composition of the community sig- nificantly shifted (Fig. 7a). Moreover, this observation was indicated by the result of the UPGMA cluster analysis, because the similarity be- tween the CAS and AGS was low (75.8 %) (Fig. 7b), which is in agreement with previous studies (Song et al., 2010).
From the DGGE banding patterns, it is obvious that the addition of GO NPs resulted in a change in the community composition. Due to the
increased amounts of nanoparticles, bacterial populations extremely changed in the reactors. According to the results of cluster analyses, in the case of 15 mg/L GO NP addition, the lane similarity compared with AGS was 96 %, and the GO NPs had a moderate impact on the microbial population. This result is similar with the previously described ob- servation that the GO NPs at 15 mg/L concentration had a slightly ne- gative effect on the reactor performance. By further increasing GO NP concentration to 25 and 35 mg/L, a relevant decrease in the similarity values (80.2 % and 79.9 %) of DGGE lanes could be observed. In the case of 95 mg/L GO NP addition, the band profile (the intensity and the number of bands) dramatically changed in the case of lower con- centrations. The detectable number of bands was the lowest in this case, indicating the low degree of similarity between this lane and the granular sludge (71.5 %).
DGGE analyses highlighted that the presence of GO NPs influenced the initial microbial community structure, resulting in the decrease of the similarities in the community composition. Hence, the community composition shifted significantly. Previous studies have also reported that an increase in nanomaterial concentration results in a reduction of the microbial community (Nguyen and Rodrigues, 2018;Zheng et al., 2017;He et al., 2017a).
In order to gain further comprehensive insights into the impacts of GO NPs on the microbial community, the dominant individual bands from the DGGEfingerprint were cut, re-amplified, and sequenced (16S rRNA gene amplicon sequencing), and samples were subjected to phylogenetic analyses. The results and the phylogenetic classification of bacterial sequences at phylum and class levels are shown inFig. 7c.
According to these results, two major known bacterial phyla, the
Fig. 7.Variation of the microbial community during experiments.a)DGGE study of the microbial communities in the activated (initial) sludge, in the granular sludge, and in the AGS system after 7 days exposure of GO NPs at different concentrations (15, 25, 35, and 95 mg/L). The designated arrows represent the excised bands;b) cluster analysis of DGGE profiles. Scale bar illustrates the percentage (%) of similarity;c) results of the 16S rRNA sequences excised from DGGE bands.
Proteobacteria and Actinobacteria, were detected in the AGS. The presence of these two phyla is essential, because they take part in the formation of aerobic granules (Song et al., 2009).
The most sensitive strains for the GO NP exposure wereAquincola sp. and Nakamurella sp., because at above 15 mg/L of GO NP con- centration, they disappeared from the granular sludge. These bacteria were isolated from wastewater, AS, granular sludge, and membrane bioreactors. They are capable of accumulating large amount of EPS utilizing glucose as the carbon source (Nancharaiah and Reddy, 2018;
yun Ma et al., 2012;Lechner et al., 2007;Liu et al., 2017b;YOSHIMI et al., 1996). As shown inFigs. 3, 6, and 7, in the case of 15 mg/L GO NPs, COD slightly increased in the effluent, and the EPS concentrations were highest. In the case of higher GO NP concentrations, COD further increased and EPS production decreased. This indicates that the two microorganisms measurably influenced EPS concentrations in the AGS and were able to degrade glucose. The Hydrogenophaga sp. is more tolerable against GO NPs and is absent only when the SWW contained 95 mg/L graphene oxide. These strains, previously isolated from AGS, play a role during wastewater treatment processes (Wang et al., 2017).
Furthermore, they are capable of producing biopolymer from glucose (Venkateswar Reddy et al., 2016) and reducing nitrate in wastewater (Mantri et al., 2016). This can explain the low EPS concentration in the case of 95 mg/L (Fig. 6), because of the disappearance of the bands (Fig. 7). NO3-N concentration was very low in the effluent during the experiments, so their role in the nitrate reduction is probably negligible.
Despite the high amount of GO NPs introduced, Paracoccus sp., Acidovorax sp., and Klebsiella sp. remained detectable in all experi- ments. This was maintained for 7 days, when the NP concentration was highest (95 mg/L).Paracoccussp. andKlebsiellasp. are able to remove the nitrate (Jiang et al., 2015; Feng et al., 2018); thus, they play a probably important role in the effective NO3-N removal rate in our system, because the bands remained (Fig. 7). Furthermore,Paracoccus sp. were able to biodegrade theN,N-dimethylformamide (DMF) when the cells were immobilized onto a polymer graphene oxide (PGO) mi- crocomposite material (Zheng et al., 2016).Acidovorax sp. plays an essential role in organic matter degradation during wastewater treat- ment processes (Schulze et al., 1999). The presence of GO NPs caused a decrease in their band intensity value (Fig. 7); thus, their cell numbers probably decreased and were unable to remove all organic matters. The strainRhodovariussp., to the best of our knowledge, is not involved in wastewater treatment processes. Rhodovarius lipocyclicuswas isolated during an industrial hygiene control (Kämpfer et al., 2004).
In order to assess the relationship between the predefined en- vironmental factors and microbial communities, RDA was performed.
The RDA plot shows the changes in the chemical parameters and mi- crobial community of AGS, which are influenced by different GO NP concentrations (Fig. 8). The addition of GO NPs in the bioreactor in- fluenced the structure of microbial community as well as resulted in changes in the effluent chemical properties. In case of the highest concentration (95 mg/L) dosage of GO NPs, Klebsiella sp. was pre- dominant, followed by theParacoccussp., Acidovorax sp.,and Rhodo- varius sp. However, the effluent COD and NH4-N contents increased, whereas that of the EPS decreased. The RDA also indicates that the most sensitive strains in the granular sludge were theAquincolasp. andNa- kamurellasp. When the GO NP concentration was 15 mg/L, these strains were the closest to the control. The phosphate concentration in the effluent began increasing when GO NP concentrations were already loaded at low concentration, whereas the EPS production was positively influenced by the lower GO NPs concentrations. But in the case of 95 mg/mL dosage, this process was also restrained.
4. Conclusions
The effects of chronic exposure of GO nanoparticles (5, 15, 25, 35, 45, 55, 65, 75, 85, and 95 mg/L) on nutrient removal, EPS secretion, and microbial community of AGS SBRs were assessed. The introduction
of GO NPs at 5, 15, 25, and 35 mg/L concentrations stimulated protein production; therefore, the removal efficiency of NH4-N and COD was not significantly reduced after 7 days. However, in cases of higher graphene oxide concentrations (55, 75, and 95 mg/L), the removal of nutrients and the production of EPS decreased considerably. The re- moval of nitrite and nitrate was not negatively influenced, although PO4-P removal decreased in the case of GO NP addition, even at low concentrations. When the influencing solution contained 15 and 95 mg/
L GO NPs, the phosphorus removal rate dropped to 83 % and 68.4 % after 7 days. Furthermore, GO NPs also resulted in a change in the microbial community composition. The detectable number of DGGE bands decreased with increasing graphene oxide concentration.
Paracoccussp.,Klebsiellasp., andAcidovoraxsp., which play a vital role in wastewater treatment processes, proved to be the most tolerant strains against GO exposure. Based on our results, the AGS was able to degrade the nutrients from the wastewater with high efficiency (up to 35 mg/L GO NP concentration) due to the compact structure of the granules, providing considerable protection against accumulated GO NPs. During the experiments, the presence of GO NPs in the effluent was not detected; they accumulated instead in the granular sludge.
Author contributions
Alfonz Kedves: Conceptualization, validation, investigation, writing - original draft;Levente Sánta:Visualization, characterization of GONPs; Margit Balázs: Conceived and designed the microbial community analysis;Péter Kesserű:Evaluation of results;István Kiss:
Resources and formal analysis;Andrea Rónavári:Conceptualization, formal analysis, writing - review & editing, supervision, and project administration;Zoltán Kónya:Conceptualization, formal analysis, re- sources, writing - review & editing, supervision, project administration, and funding acquisition.
Declaration of Competing Interest
The authors declare that they have no known competingfinancial interests or personal relationships that could have appeared to influ- ence the work reported in this paper.
Acknowledgments
Financial support from the Hungarian GINOP-2.3.2-15-2016-00013
“Intelligent materials based on functional surfaces-from syntheses to applications”project, the NKFIH (OTKA) K112531 (Á.K.) and K120115 (Z.K.) grants are acknowledged.
Fig. 8.RDA plot showing the relationship between bacterial community structure and environmental factors (GO NP concentrations (0, 15, 25, 35, and 95 mg/L), COD, NH4-N, PO4-P, and EPS) after 7 days.
Appendix A. Supplementary data
Supplementary material related to this article can be found, in the online version, at doi:https://doi.org/10.1016/j.jhazmat.2019.121905.
References
Adav, S.S., Lee, D.J., Tay, J.H., 2008. Extracellular polymeric substances and structural stability of aerobic granule. Water Res. 42, 1644–1650.https://doi.org/10.1016/j.
watres.2007.10.013.
Ahmed, F., Rodrigues, D.F., 2013. Investigation of acute effects of graphene oxide on wastewater microbial community: a case study. J. Hazard. Mater. 256–257, 33–39.
https://doi.org/10.1016/j.jhazmat.2013.03.064.
Amin, M.M., Khiadani (Hajian), M.H., Fatehizadeh, A., Taheri, E., 2014. Validation of linear and non-linear kinetic modeling of saline wastewater treatment by sequencing batch reactor with adapted and non-adapted consortiums. Desalination 344, 228–235.https://doi.org/10.1016/j.desal.2014.03.032.
Angela, M., Béatrice, B., Mathieu, S., 2011. Biologically induced phosphorus precipitation in aerobic granular sludge process. Water Res. 45, 3776–3786.https://doi.org/10.
1016/j.watres.2011.04.031.
Araujo, J.C., Téran, F.C., Oliveira, R.A., Nour, E.A.A., Montenegro, M.A.P., Campos, J.R., Vazoller, R.F., 2003. Comparison of hexamethyldisilazane and critical point drying treatments for SEM analysis of anaerobic biofilms and granular sludge. J. Electron.
Microsc. (Tokyo) 52, 429–433.https://doi.org/10.1093/jmicro/52.4.429.
Balázs, M., Rónavári, A., Németh, A., Bihari, Z., Rutkai, E., Bartos, P., Kiss, I., Szvetnik, A., 2013. Effect of DNA polymerases on PCR-DGGE patterns. Int. Biodeterior. Biodegrad.
84, 244–249.https://doi.org/10.1016/j.ibiod.2012.05.011.
Batley, G.E., Kirby, J.K., McLaughlin, M.J., 2013. Fate and risks of nanomaterials in aquatic and terrestrial environments. Acc. Chem. Res. 46, 854–862.https://doi.org/
10.1021/ar2003368.
Benson, D.A., 2003. GenBank: update. Nucleic Acids Res. 32, 23D–26.https://doi.org/10.
1093/nar/gkh045.
Brânduşa Pavel, A., Ioan Vasile, C., 2012. PyElph–a software tool for gel images analysis and phylogenetics. BMC Bioinformatics 13, 9.https://doi.org/10.1186/1471-2105- 13-9.
Chen, Y., Gu, G., 2005. Preliminary studies on continuous chromium(VI) biological re- moval from wastewater by anaerobic-aerobic activated sludge process. Bioresour.
Technol. 96, 1713–1721.https://doi.org/10.1016/j.biortech.2004.12.024.
Chen, J., Wang, X., Han, H., 2013. A new function of graphene oxide emerges: in- activating phytopathogenic bacterium Xanthomonas oryzae pv. oryzae. J. Nanopart.
Res. 15, 1658.https://doi.org/10.1007/s11051-013-1658-6.
Chen, D., Wang, X., Yang, K., Wang, H., 2016. Response of a three dimensional bioe- lectrochemical denitrification system to the long-term presence of graphene oxide.
Bioresour. Technol. 214, 24–29.https://doi.org/10.1016/j.biortech.2016.04.082.
Chung, H., Kim, M.J., Ko, K., Kim, J.H., Kwon, H., Hong, I., Park, N., Lee, S.-W., Kim, W., 2015. Effects of graphene oxides on soil enzyme activity and microbial biomass. Sci.
Total Environ. 514, 307–313.https://doi.org/10.1016/j.scitotenv.2015.01.077.
Combarros, R.G., Collado, S., Díaz, M., 2016. Toxicity of graphene oxide on growth and metabolism of Pseudomonas putida. J. Hazard. Mater. 310, 246–252.https://doi.
org/10.1016/j.jhazmat.2016.02.038.
Corsino, S.F., di Biase, A., Devlin, T.R., Munz, G., Torregrossa, M., Oleszkiewicz, J.A., 2017. Effect of extended famine conditions on aerobic granular sludge stability in the treatment of brewery wastewater. Bioresour. Technol. 226, 150–157.https://doi.
org/10.1016/j.biortech.2016.12.026.
Dahalan, F.A., Abdullah, N., Yuzir, A., Olsson, G., Salmiati, Hamdzah, M., Din, M.F.M., Ahmad, S.A., Khalil, K.A., Anuar, A.N., Noor, Z.Z., Ujang, Z., 2015. A proposed aerobic granules size development scheme for aerobic granulation process. Bioresour.
Technol. 181, 291–296.https://doi.org/10.1016/j.biortech.2015.01.062.
Dai, Y., Jiang, Y., Su, H., 2015. Influence of an aniline supplement on the stability of aerobic granularsludge. J. Environ. Manage. 162, 115–122.https://doi.org/10.1016/
j.jenvman.2015.05.017.
De Kreuk, M.K., Heijnen, J.J., Van Loosdrecht, M.C.M., 2005. Simultaneous COD, ni- trogen, and phosphate removal by aerobic granular sludge. Biotechnol. Bioeng. 90, 761–769.https://doi.org/10.1002/bit.20470.
Feng, Y., Feng, J., Shu, Q.L., 2018. Isolation and characterization of heterotrophic ni- trifying and aerobic denitrifying Klebsiella pneumoniae and Klebsiella variicola strains from various environments. J. Appl. Microbiol. 124, 1195–1211.https://doi.
org/10.1111/jam.13703.
Franca, R.D.G., Vieira, A., Mata, A.M.T., Carvalho, G.S., Pinheiro, H.M., Lourenço, N.D., 2015. Effect of an azo dye on the performance of an aerobic granular sludge se- quencing batch reactor treating a simulated textile wastewater. Water Res. 85, 327–336.https://doi.org/10.1016/j.watres.2015.08.043.
Fulaz, S., Vitale, S., Quinn, L., Casey, E., 2019. Nanoparticle–biofilm interactions: the role of the EPS matrix. Trends Microbiol. 27, 915–926.https://doi.org/10.1016/j.tim.
2019.07.004.
Guo, C., Wang, Y., Luo, Y., Chen, X., Lin, Y., Liu, X., 2018. Effect of graphene oxide on the bioactivities of nitrifying and denitrifying bacteria in aerobic granular sludge.
Ecotoxicol. Environ. Saf. 156, 287–293.https://doi.org/10.1016/j.ecoenv.2018.03.
036.
Gurunathan, S., 2015. Cytotoxicity of graphene oxide nanoparticles on plant growth promoting rhizobacteria. J. Ind. Eng. Chem. 32, 282–291.https://doi.org/10.1016/j.
jiec.2015.08.027.
He, Q., Zhou, J., Wang, H., Zhang, J., Wei, L., 2016. Microbial population dynamics during sludge granulation in an A/O/A sequencing batch reactor. Bioresour. Technol.
214, 1–8.https://doi.org/10.1016/j.biortech.2016.04.088.
He, Q., Gao, S., Zhang, S., Zhang, W., Wang, H., 2017a. Chronic responses of aerobic granules to zinc oxide nanoparticles in a sequencing batch reactor performing si- multaneous nitrification, denitrification and phosphorus removal. Bioresour.
Technol. 238, 95–101.https://doi.org/10.1016/j.biortech.2017.04.010.
He, Q., Yuan, Z., Zhang, J., Zhang, S., Zhang, W., Zou, Z., Wang, H., 2017b. Chemosphere insight into the impact of ZnO nanoparticles on aerobic granular sludge under shock loading. Chemosphere 173, 411–416.https://doi.org/10.1016/j.chemosphere.2017.
01.085.
Jiang, H.L., Tay, J.H., Maszenan, A.M., Tay, S.T.L., 2004. Bacterial diversity and function of aerobic granules engineered in a sequencing batch reactor for phenol degradation.
Appl. Environ. Microbiol. 70, 6767–6775.https://doi.org/10.1128/AEM.70.11.
6767-6775.2004.
Jiang, C., Xu, X., Megharaj, M., Naidu, R., Chen, Z., 2015. Inhibition or promotion of biodegradation of nitrate by Paracoccus sp. in the presence of nanoscale zero-valent iron. Sci. Total Environ. 530–531, 241–246.https://doi.org/10.1016/j.scitotenv.
2015.05.044.
Kämpfer, P., Busse, H.-J., Rosséllo-Mora, R., Kjellin, E., Falsen, E., 2004. Rhodovarius lipocyclicus gen. nov. sp. nov., a new genus of theα-1 subclass of the proteobacteria.
Syst. Appl. Microbiol. 27, 511–516.https://doi.org/10.1078/0723202041748235.
Katsumiti, A., Tomovska, R., Cajaraville, M.P., 2017. Intracellular localization and toxi- city of graphene oxide and reduced graphene oxide nanoplatelets to mussel hemo- cytes in vitro. Aquat. Toxicol. 188, 138–147.https://doi.org/10.1016/j.aquatox.
2017.04.016.
Kelessidis, A., Stasinakis, A.S., 2012. Comparative study of the methods used for treat- ment andfinal disposal of sewage sludge in European countries. Waste Manag. 32, 1186–1195.https://doi.org/10.1016/j.wasman.2012.01.012.
Keller, A.A., Lazareva, A., 2013. Predicted releases of engineered nanomaterials: from global to regional to local. Environ. Sci. Technol. Lett. 1, 65–70.https://doi.org/10.
1021/ez400106t.
Kiser, M.A., Westerhoff, P., Benn, T., Wang, Y., Pérez-Rivera, J., Hristovski, K., 2009.
Titanium nanomaterial removal and release from wastewater treatment plants.
Environ. Sci. Technol. 43, 6757–6763.https://doi.org/10.1021/es901102n.
Krishnamoorthy, K., Veerapandian, M., Yun, K., Kim, S., 2012. The chemical and struc- tural analysis of graphene oxide with different degrees of oxidation. Carbon N. Y. 53, 38–49.https://doi.org/10.1016/j.carbon.2012.10.013.
Lalwani, G., D’Agati, M., Khan, A.M., Sitharaman, B., 2016. Toxicology of graphene-based nanomaterials. Adv. Drug Deliv. Rev. 105, 109–144.https://doi.org/10.1016/j.addr.
2016.04.028.
Lechner, U., Brodkorb, D., Geyer, R., Hause, G., Härtig, C., Auling, G., Fayolle-Guichard, F., Piveteau, P., Müller, R.H., Rohwerder, T., 2007. Aquincola tertiaricarbonis gen.
nov., sp. nov., a tertiary butyl moiety-degrading bacterium. Int. J. Syst. Evol.
Microbiol. 57, 1295–1303.https://doi.org/10.1099/ijs.0.64663-0.
Li, X.Y., Yang, S.F., 2007. Influence of loosely bound extracellular polymeric substances (EPS) on theflocculation, sedimentation and dewaterability of activated sludge.
Water Res. 41, 1022–1030.https://doi.org/10.1016/j.watres.2006.06.037.
Li, A.J., Yang, S.F., Li, X.Y., Gu, J.D., 2008. Microbial population dynamics during aerobic sludge granulation at different organic loading rates. Water Res. 42, 3552–3560.
https://doi.org/10.1016/j.watres.2008.05.005.
Lin, L., Peng, H., Liu, Z., 2019. Synthesis challenges for graphene industry. Nat. Mater. 18, 520–524.https://doi.org/10.1038/s41563-019-0341-4.
Liu, X.-W., Yu, H.-Q., Ni, B.-J., Sheng, G.-P., 2009. Characterization, modeling and ap- plication of aerobic granular sludge for wastewater treatment. In: Zhong, J.-J., Bai, F.-W., Zhang, W. (Eds.), Biotechnol. China I From Bioreact. to Biosep.
Bioremediation. Springer, Berlin Heidelberg, Berlin, Heidelberg, pp. 275–303.
https://doi.org/10.1007/10_2008_29.
Liu, S., Zeng, T.H., Hofmann, M., Burcombe, E., Wei, J., Jiang, R., Kong, J., Chen, Y., 2011. Antibacterial activity of graphite, graphite oxide, graphene oxide, and reduced graphene oxide: membrane and oxidative stress. ACS Nano 5, 6971–6980.https://
doi.org/10.1021/nn202451x.
Liu, X., Zhao, Y., Luo, Y., Wang, Y., Wang, X., 2017a. Effect of graphene oxide on the characteristics and mechanisms of phosphorus removal in aerobic granular sludge:
case report. Water Air Soil Pollut. 229, 8.https://doi.org/10.1007/s11270-017- 3657-1.
Liu, J., Zuo, W., Zhang, J., Li, H., Li, L., Tian, Y., 2017b. Shifts in microbial community structure and diversity in a MBR combined with worm reactors treating synthetic wastewater. J. Environ. Sci. (China) 54, 246–255.https://doi.org/10.1016/j.jes.
2016.03.009.
Mantri, S., Rao, M., Sathyanarayana, C., Gundlapally, R., 2016. Description of Hydrogenophaga laconesensis sp. nov. isolated from tube well water. Arch.
Microbiol. 198, 637–644.https://doi.org/10.1007/s00203-016-1224-6.
Nancharaiah, Y.V., Reddy, G.K.K., 2018. Aerobic granular sludge technology: mechan- isms of granulation and biotechnological applications. Bioresour. Technol. 247, 1128–1143.https://doi.org/10.1016/j.biortech.2017.09.131.
Nanda, S.S., Papaefthymiou, G.C., Yi, D.K., 2015. Functionalization of graphene oxide and its biomedical applications. Crit. Rev. Solid State Mater. Sci. 40, 291–315.
https://doi.org/10.1080/10408436.2014.1002604.
Nguyen, H.N., Rodrigues, D.F., 2018. Chronic toxicity of graphene and graphene oxide in sequencing batch bioreactors: a comparative investigation. J. Hazard. Mater. 343, 200–207.https://doi.org/10.1016/j.jhazmat.2017.09.032.
Perez, J.V.D., Nadres, E.T., Nguyen, H.N., Dalida, M.L.P., Rodrigues, D.F., 2017. Response surface methodology as a powerful tool to optimize the synthesis of polymer-based graphene oxide nanocomposites for simultaneous removal of cationic and anionic heavy metal contaminants. RSC Adv. 7, 18480–18490.https://doi.org/10.1039/
c7ra00750g.
Qayyum, S., Khan, A.U., 2016. Nanoparticles: vs. biofilms: a battle against another


![– ].Recentstudiesrevealedtheevidencethatinsulinplaysacriticalroleinmaintainingthemitochondrial inthenormalbrainfunctionhasbeenconfirmedbyevidencethatinsulindysregulationplaysaroleinthepathophysiologyofAlzheimer’sdisease(AD)[ therapiesareconcernedwithdelive](data:image/gif;base64,R0lGODlhAQABAIAAAP///wAAACH5BAEAAAAALAAAAAABAAEAAAICRAEAOw==)