https://doi.org/10.1007/s10934-020-00978-x
Size controlled Pt over mesoporous NiO nanocomposite catalysts:
thermal catalysis vs. photocatalysis
András Sápi1 · Suresh Mutyala1 · Seema Garg2 · Mohit Yadav2 · Juan F. Gómez‑Pérez1 · Fanni Czirok1 · Zita Sándor1 · Klara Hernadi1 · Ferenc Farkas3 · Sebastijan Kovačič4 · Ákos Kukovecz1 · Zoltán Kónya1,5
Accepted: 3 September 2020
© Springer Science+Business Media, LLC, part of Springer Nature 2021
Abstract
Mesoporous nickel oxide and Pt@NiO nanocomposites were synthesized for the study of CO2 methanation in the fixed bed reactor, atmospheric pressure, and photocatalytic degradation of methyl orange. All synthesized catalysts were characterized by XRD, N2 isotherms, TEM, UV–Vis DRS, and ICP-MS analysis. NiO with 8 nm Pt nanoparticles was the most active catalyst in photocatalysis, however, the 2 nm Pt nanoparticles were most active in the thermal CO2 activation reaction. High CO2 consumption and CH4 formation rates were obtained for Pt@NiO nanocomposites below 673 K compared with bare NiO by the formation of Pt/PtOx/Ni/NiOx interface in reaction condition. Pt2@NiO nanocomposite has shown a high CO2 consumption rate because of high dispersion of 2 nm Pt nanoparticles within mesoporous NiO and high Pt to Ni surface area during the reaction. The photocatalytic degradation efficiency of Pt8@NiO nanocomposite was higher compared to that of bare NiO by a decrease in the recombination of electron–hole pair under UV–Vis irradiation.
Keywords Size controlled pt nanoparticles · Mesoporous NiO · CO2 methanation · Methyl orange
1 Introduction
Carbon dioxide is one of the environmental pollutant gases which causes global warming. It is released by the consump- tion of fossil fuel, high growth of automobile and petro- chemical industries [1]. CO2 is the most abundant C1 source, inexpensive, and non-toxic gas [2]. It can be reduced by car- bon capture and separation [3, 4], conversion into chemicals and fuels [5]. Among these, catalytic hydrogenation of CO2 into methane is the easiest method. In 1902, Paul Sabatier has used methanation technology for the CO2 hydrogena- tion in atmospheric pressure. The Gibbs free energy for CO2 methanation is − 114 kJ mol−1 [6].
Few research groups have studied active metals like Ni [7, 8], Co [9–11], Pt [12], Pd [13], Ru [14–16] and Rh [17] supported on Al2O3, CeO2, MgO, TiO2, ZrO2, and SiO2 for the catalytic hydrogenation of CO2. Moreover, supported noble metal (Pt, Ru, and Rh) catalysts were highly active for the dissociation of H2 and effective for catalytic hydrogenation of CO2 [18]. Generally, catalyst activity depends on the active metal and nature of the sup- port [19]. Kattel et al. have studied Pt loaded SiO2 and CO2+ 4H2CH4+ 2H2O, ΔG = −114 kJ mol−1
András Sápi and Suresh Mutyala contributed equally to this study.
Electronic supplementary material The online version of this article (https ://doi.org/10.1007/s1093 4-020-00978 -x) contains supplementary material, which is available to authorized users.
* András Sápi
sapia@chem.u-szeged.hu
1 Department of Applied and Environmental Chemistry, Interdisciplinary Excellence Centre, University of Szeged, Rerrich Béla tér 1, Szeged 6720, Hungary
2 Department of Chemistry, Amity Institute of Applied Sciences, Amity University, Sector-125, Noida, Uttar Pradesh 201313, India
3 Department of Technology, Faculty of Engineering, University of Szeged, Mars tér 7, 6724 Szeged, Hungary
4 Department of Polymer Chemistry and Technology, National Institute of Chemistry, Hajdrihova ulica 19, 1001 Ljubljana, Slovenia
5 MTA-SZTE Reaction Kinetics and Surface Chemistry Research Group, Rerrich Béla tér 1, Szeged 6720, Hungary
TiO2 for CO2 hydrogenation. High CO2 conversion was obtained for Pt/TiO2 compared to Pt/SiO2 due to more binding of CO2 with defective oxygen vacancies in TiO2 support [20]. Liu et al. have also studied CO2 hydrogena- tion using NiO supported on mesoporous silica (SBA- 15) prepared by the one-pot hydrothermal method. CO2 hydrogenation was higher due to the high dispersion of Ni on SBA-15 and more number of nickel particles within mesoporous channels [21]. Similarly, An et al. have syn- thesized mesoporous metal oxides such as NiO, MnO2, Co3O4, and CeO2 supported Pt nanoparticles for CO oxidation. The rate of reaction was higher for Pt/Co3O4 compared to bare Pt nanoparticles and mesoporous metal oxide [22]. Hence, support plays a major role in heteroge- neous catalytic reactions which influences high dispersion of active metal and metal-support interaction resulting in high conversion, selectivity, and long durability.
Nickel oxide is a p-type semiconductor having a band- gap of 3.6–4.0 eV [23]. Semiconductor materials like ZnO, TiO2, ZnS, CdS, and Ag3PO4 were used for the photo- catalytic degradation of aqueous organic pollutants [24].
By coupling of two semiconductors, the bandgap can be decreased which leads to separation of electron–hole pair under irradiation consequently high photocatalytic activ- ity. Saravanan et al. have synthesized ZnO-CuO composite material for photocatalytic textile dyes degradation. The synthesized composite material showed high photocata- lytic degradation compared to ZnO [25]. Islam et al. have reported high photocatalytic degradation of methyl orange using Au nanoparticles supported on TiO2 compared to bare TiO2 [26]. Based on the above concepts, in this arti- cle, we have studied catalytic hydrogenation of CO2 in the fixed bed reactor and photocatalytic methyl orange degra- dation using mesoporous NiO and Pt@NiO nanocomposite materials.
2 Experimental
2.1 MaterialsAll analytical grade chemicals such as Pluronic-123 (Mn = 5800), tetraethyl orthosilicate (SiC8H20O4), poly- vinylpyrrolidone (PVP, MW = 40,000), dihydrogen tet- rachloroplatinate (H2PtCl4), nickel nitrate hexahydrate (Ni(NO3)2.6H2O), ethylene glycol (C2H6O2), ethanol (C2H6O), n-butanol (C4H10O), toluene (C7H8), sodium hydroxide (NaOH), hydrochloric acid (HCl) and methyl orange (C14H14N3NaO3S) were purchased from the Sigma Aldrich and used without further purification. Ultra-high pure gases were purchased from the local vendor to study the catalytic hydrogenation of CO2.
2.2 Synthesis of Pt nanoparticles 2.2.1 Synthesis of 2 nm Pt nanoparticles
Pt nanoparticles (Pt-NPs) were synthesized by the polyol method [27]. About, 29 mg H2PtCl4 and 50 mg NaOH were dissolved in 2.5 mL ethylene glycol separately. The indi- vidual solutions were mixed together and heated at 433 K for 3 h in an inert atmosphere then cooled to room temperature.
To the black suspension, 2.5 mL HCl (1 M) was added fol- lowed by centrifugation. The obtained Pt nanoparticles were dispersed in 10 mL ethanolic solution of PVP (0.002 g/mL, MW = 40,000) followed by ultra-sonication and centrifuga- tion. Finally, it was washed with hexane for 3 cycles and stored in ethanol.
2.2.2 Synthesis of 5 nm Pt nanoparticles
40 mg H2PtCl4 and 35 mg polyvinylpyrrolidone (MW = 40,000) were dissolved in 5 mL ethylene glycol in a round bottom flask until a homogenous solution was obtained. It was evacuated and purged with inert gas to remove oxygen or water content. The mixture was heated in an oil bath under vigorous stirring at 473 K for 3 h then cooled to room temperature. The obtained mixture was pre- cipitated with acetone followed by ultra-sonication and cen- trifugation. Finally, it was washed hexane at least 3 cycles and stored in ethanol.
2.2.3 Synthesis of 8 nm Pt nanoparticles
40 mg H2PtCl4 and 50 mg polyvinylpyrrolidone (MW = 40,000) were dissolved in 2.5 mL ethylene glycol.
It was mixed with the solution of 2.5 mL NaOH (0.075 M) in ethylene glycol in a round bottom flask. The solution was ultrasonicated for 30 min followed by evacuation and purged in inert gas. The mixture was heated in an oil bath under vigorous stirring at 433 K for 3 h then cooled to room tem- perature. The pH of the solution was neutralized with 2 M HCl. The obtained mixture was precipitated with acetone followed by ultra-sonication and centrifugation. Finally, it was washed with hexane at least three cycles and stored in ethanol.
2.3 Synthesis of mesoporous NiO
Mesoporous nickel oxide was synthesized using KIT-6 as a hard template. For the synthesis of KIT-6, 27 g of Plu- ronic-123 polymer (Mn = 5800) was dissolved in 980 mL distilled water then 43.5 mL of concentrated HCL was added to get a clear solution. To this solution, 33.3 mL of
n-butanol was added and stirred for 1 h at 303 K followed by 58 g of tetraethyl orthosilicate was added and stirred further 24 h at the same temperature. The precipitate was transferred into an autoclave and kept at 313 K for 24 h.
The solid product was obtained by filtration and dried at 363 K overnight. Finally, it was calcined at 823 K for 6 h under static air [22]. To synthesize mesoporous NiO from KIT-6, 3 g of Ni(NO3)2 × 6H2O was dissolved in 18 mL of distilled water then 4 g of KIT-6 in 50 mL of toluene was added. The solution was stirred vigorously at 338 K until the complete removal of toluene. The product was dried at 333 K overnight followed by calcination at 573 K for 3 h in static air. The silica was removed by dissolving it in 2 M NaOH solution. The product was obtained by filtration and dried at 323 K for 12 h [28].
2.4 Synthesis of Pt@NiO nanocomposites
The Pt nanoparticles of various sizes (2, 5, and 8 nm) were diluted in ethanol separately then mesoporous NiO was added. The mixture was ultrasonicated at room temperature for 3 h followed by centrifugation and washed with ethanol.
The product was dried at 353 K overnight, resulting in the formation of Pt@NiO nanocomposite containing 0.5 wt% of Pt nanoparticles (Pt-NPs) and labeled as Pt2@NiO, Pt5@
NiO, and Pt8NiO. The Pt@NiO nanocomposite with various sizes of Pt-NPs was characterized and tested in more detail.
2.5 Characterizations
X-ray diffraction patterns were recorded using the Rigaku Miniflex-II X-ray diffractometer having Ni-filtered Cu kα radiation (λ = 1.54 Å) operated at 30 kV and 15 mA. The N2 adsorption–desorption isotherms were measured on the Quantachrome NOVA 3000e gas sorption instrument at 77 K. Prior to adsorption measurement, the sample was activated at 473 K for 2 h under vacuum. The morphological image of each sample was obtained from FEI TECNAI G2 20 X-Twin high-resolution transmission electron microscopy equipped with electron diffraction operated at a high volt- age of 200 kV. The sample was sonicated in ethanol and suspended on a carbon film-coated copper grid. The opti- cal band gap was determined by a UV–Vis–NIR spectrom- eter (Ocean Optics USB4000 spectrometer) using a DH- 2000-BAL UV–Vis-NIR light source equipped with diffuse reflectance probe. Agilent 7700×ICP-MS spectrometer was used to measure the Pt content.
2.6 Catalytic hydrogenation of CO2
Catalytic hydrogenation of CO2 was carried out in a fixed bed reactor having 8 mm i.d. and 200 mm length. The dead volume of the reactor was filled with quartz beads.
The reaction temperature and gas flow were controlled by PID and mass flow controllers respectively. The gas line before and after the reactor was heated externally to avoid condensation of gas. About, 150 mg of catalyst was loaded at the center of the reactor, feed gas (H2/CO2 = 4:1) flow rate of 50 mL/min, and reaction temperature from 473 to 773 K in atmospheric pressure was maintained. Influent and effluent gases of the reactor were analyzed by on-line gas chromatography Agilent 6890N having thermal con- ductivity detector (TCD) and flame ionization detector (FID). CO2 and H2 were analyzed by TCD having HP- PLOTQ packed column whereas CH4 and CO were ana- lyzed by FID having Equity-1 capillary column. Before the study of catalytic reaction, catalyst in the fixed bed reactor was oxidized with O2 at 673 K for 30 min to remove sur- face contaminants and PVP capping agent then reduced in H2 at 673 K for 1 h. Conversion of CO2 and selectivity of the products (CH4 and CO) were calculated using the following equations [29].
2.7 Photocatalytic degradation of methyl orange Photocatalytic degradation of methyl orange was carried out using mesoporous NiO and Pt@NiO nanocomposite.
About, 50 mg of catalyst was added to 100 mL of methyl orange solution (20 mg L−1, 40 mg L−1, and 60 mg L−1) at various pH (2, 7, and 11) then irradiated to 300 W xenon lamp. Before the irradiation of UV light, the mixture was kept in dark to know the adsorption–desorption equilib- rium of methyl orange on the surface of the catalyst. At regular intervals of time, 3 mL of suspension was col- lected, centrifuged then the supernatant liquid was ana- lyzed by UV–Visible spectrometer at λ = 465 nm. The methyl orange degradation was calculated using the fol- lowing equation.
where C0 and Ct are the concentration of MO at initial and time (t) respectively.
Conversion of CO2: XCO2(%) = [CO2]
in−[ CO2]
out
[CO2
]
in
×100
Selectivity of product: Sprod.(%) = [Product]out [CO2]
in −[ CO2]
out
×100
Methyl orange degradation(%) =C0−Ct C0 ×100,
3 Results and discussion
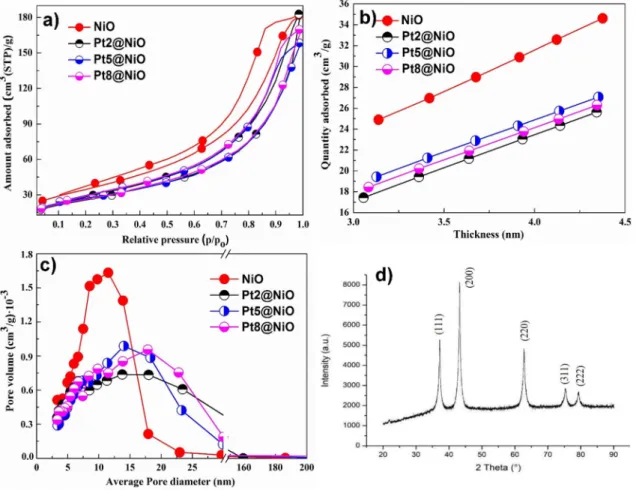
3.1 Structural characterizationsIn order to confirm the formation of mesoporous NiO, the sample was characterized by the XRD. The XRD patterns of mesoporous NiO as depicted in Fig. 1d shows the typi- cal diffraction peaks of NiO at 2θ = 37.2°, 43.2°, 62.8°, 75.2°, and 79.3° that correspond to the (111), (200), (220), (311) and (222) planes respectively (JCPDS No. 47–1049) [30].
The porosity properties of the bare NiO and the Pt@
NiO nanocomposite were further thoroughly analyzed by means of nitrogen sorption and demonstrated that all materials were indeed mesoporous. The SBET of bare NiO was 126 m2 g−1 while that of the Pt@NiO nanocomposites was somewhat lower and reached to 95 m2 g−1 (Fig. 1a).
A t-plot analysis of the isotherm according to Broekhoff and DeBoer method proved that no significant micropo- rosity was present in this material. Instead, well-defined H3-hysteresis loops (IUPAC notation) in the isotherms
translate into different volumes of the pores with average diameters in the mesoporous dimensions centered at ca.
10, 14, 15 and 18 nm for bar NiO, Pt2@NiO, Pt5@NiO, and Pt8@NiO nanocomposite respectively (Fig. 1c) [31].
Moreover, the t-plot analysis further revealed an increase of the sorbate amount from ~ 17 cm3 g−1 for the Pt@NiO nanocomposite to ~ 23 cm3 g−1 for bar NiO (Fig. 1b). For this reason, the total pore volumes were defined and found to decrease from 0.27 cm3 g−1 for NiO to ~ 0.22 cm3 g−1 for Pt@NiO nanocomposite.
Figure 2 shows TEM images of Pt-NPs, NiO, and Pt@
NiO nanocomposite. Pt nanoparticles have spherical shapes and an average particle size of 1.6 ± 0.3 nm (Fig. 2a), 4.6
± 0.8 nm (Fig. 2b), and 7.9 ± 1.1 nm (Fig. 2c) within the Pt2@NiO, Pt5@NiO, and Pt8@NiO nanocomposite respec- tively. The Pt-NPs have been found on the surface of the NiO (Fig. 2d–f). Moreover, the 2 nm sized Pt-NPs were found homogeneously distributed within the mesoporous NiO.
The optical behavior of prepared Pt@NiO nanocomposite with different Pt-NPs was presented in Fig. 3a, while the Tauc plots obtained from the DR UV/Vis data and related optical band gap energies were presented in Fig. 3b. In the
Fig. 1 a N2 isotherms measured at 77 K; b amount of adsorbed nitrogen (t-plots); c mesopore size distribution determined by the BJH method and d XRD of NiO
Fig. 2 TEM images and particle size distribution of Pt nanoparticles: a 2 nm, b 5 nm, c 8 nm, d NiO, e Pt2@NiO, f Pt5@NiO, and g Pt8@NiO
Fig. 3 a Absorbance spectra from the DRS measurements and b optical band gaps from Tauc plots of size-controlled Pt nanoparticles
case of mesoporous NiO, the bandgap energy found was
~ 3.55 eV with an absorption edge below 345 nm, which was consistent with the reported values for NiO (Fig. S1) [32]. However, for Pt@NiO nanocomposite absorption edge increases to 360 nm, which corresponds to the optical band gap energies (Eg) of 3.44 ± 0.01 eV (Fig. 3a and b). As a result, it can be claimed that a broader range of wavelengths that can be absorbed and decreased Eg within the nanocom- posite series can be well utilized in the catalysis (vide infra).
3.2 Methanation reaction over different Pt@NiO based catalysts
Figure 4 shows the plots of CO2 consumption rate at differ- ent temperatures and time on stream study at 773 K using synthesized catalysts. The highest CO2 consumption rate of
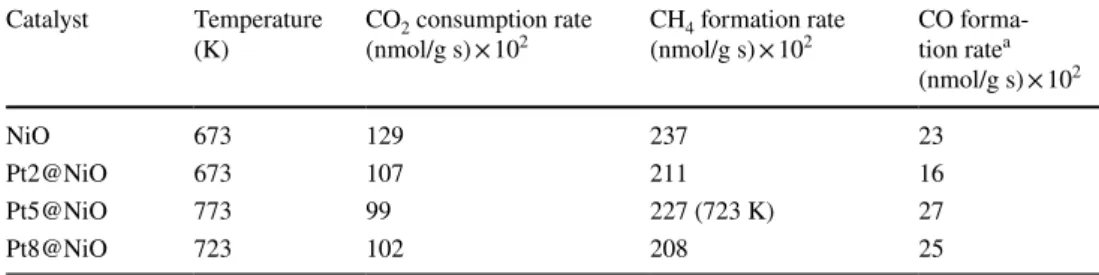
each catalyst was presented in Table 1 which were 129 × 102 nmol/g s for NiO at 673 K, 107 × 102 nmol/g s for Pt2@
NiO at 673 K, 99 × 102 nmol/g s for Pt5@NiO at 773 K and 102 × 102 nmol/g s for Pt8@NiO at 723 K. We found that CO2 consumption rate steadily increased up to 673 K, where mesoporous NiO has shown highest catalytic activity compared to other catalysts. It was due to the formation of Ni/NiOx species under this reaction condition as well as a higher specific surface area. Further increase in temperature, decreased the activity of mesoporous NiO which was most likely by coke deposition on the surface of the catalyst, and hence it was over reduction (Fig. 4a).
At temperatures below 673 K, Pt@NiO nanocompos- ites have shown a high CO2 consumption rate compared to mesoporous NiO which we believed because of Pt/NiO hetero-structures. Recently, our group has studied the
Fig. 4 a CO2 consumption rate at different temperatures and b Time on stream study at 773 K for all catalysts in atmospheric pressure
Table 1 The highest CO2 consumption rate, CH4 and CO formation rates of all catalysts
a Highest CO formation rate at 773 K Catalyst Temperature
(K) CO2 consumption rate
(nmol/g s) × 102 CH4 formation rate
(nmol/g s) × 102 CO forma- tion ratea (nmol/g s) × 102
NiO 673 129 237 23
Pt2@NiO 673 107 211 16
Pt5@NiO 773 99 227 (723 K) 27
Pt8@NiO 723 102 208 25
interaction of Pt nanoparticles supported on mesoporous nickel oxide, SBA-15 and reported that Pt initiated NiO reduction by dissociation of adsorbed H2 and transferred atomic H to the NiO surface. Thus, Pt promoted the reduc- tion of NiO to metallic Ni and formed a complex interface Pt/PtOx/Ni/NiOx during the reaction which was confirmed by XPS analysis. This interface was responsible for high catalytic activity [33–35]. Kim et al. have studied CO oxi- dation using Pt3Ni alloy. High catalytic CO oxidation was reported because of the formation of interfacial Pt-Ni1−x nanostructure during the reaction [36]. Similarly, See et al. have studied H2 oxidation using Pt–Co bimetallic nanoparticles. The interface CoO/Pt formed in the reac- tion condition was responsible for a high catalytic reaction [37]. Among the Pt@NiO nanocomposites, the one with Pt average particle size 2 nm and uniform distribution of Pt-NPs on NiOx surface thus high Pt to Ni metal surface area has shown the highest consumption of CO2.
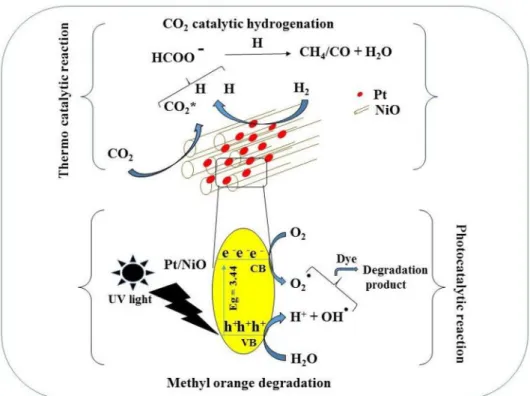
In reducible metal oxide supported noble metal cata- lysts, metal oxide actives CO2 due to the presence of oxy- gen vacancies and noble metal dissociates H2 molecule.
The activated CO2 and dissociated hydrogen atom are combined to form intermediate formate which further reacts or decomposes to form CH4 or CO (Scheme 1).
Shyam et al. have reported formate reaction pathways for the synthesis of CH4 by catalytic hydrogenation of CO2 using Pt/TiO2 [20]. In the time on stream study at 773 K, the rate of CO2 consumption rate was nearly constant up to 10 h for all catalysts (Fig. 4b).
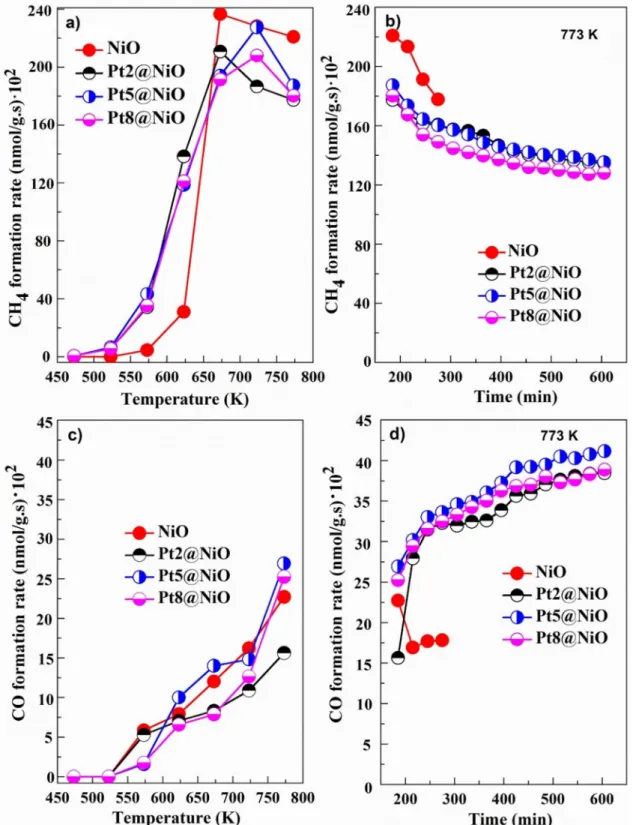
Figure 5 shows the formation rates of CH4 and CO at dif- ferent temperatures and time on stream study at 773 K for all catalysts. Similar to the CO2 consumption rate, CH4 and CO formation rates were also increased with the increase of temperature. For Pt@NiO nanocomposite, the methane for- mation rate was higher at < 673 K compared to mesoporous NiO (Fig. 5a). Pt2@NiO has obtained a high CO2 con- sumption rate and CH4 formation rate at 623 K. In the time on stream study at 773 K, the rate of CH4 formation was decreased and CO formation was increased (Fig. 5b and d).
The catalytic hydrogenation of CO2 in a fixed bed reactor of the synthesized catalyst was compared with reported cata- lysts (Table 2). Pt2@NiO nanocomposite has shown high catalytic activity compared to some of the reported catalysts such as Ru/TiO2 [38] and Pd-Mg/SiO2 [39].
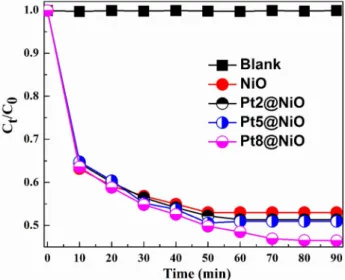
3.3 Photocatalytic degradation of methyl orange The photocatalytic activity of Pt@NiO nanocomposites was evaluated by means of degradation of water dissolved methyl orange (MO). The experiments were first conducted under dark conditions for 90 min in order to determine adsorp- tion equilibrium. The decrease of MO concentration due to adsorption of MO on the surface of prepared Pt@NiO nano- composites was negligible and was not influenced by the amount and size of Pt-NPs present in the nanocomposites.
MO has a photo-resistant character since the results of deg- radation under UV irradiation show that the concentration of MO in the solution was only slightly decreasing as a function
Scheme 1 Schematic diagram of CO2 thermal catalytic hydro- genation and methyl-orange photocatalytic degradation using Pt@NiO nanocomposite
of time. MO degradation curves were presented in Fig. 6. It demonstrated that the presence and size of Pt-NPs increase the photocatalytic activity of nanocomposites compared to bare NiO. The observed increase of the photocatalytic
activity with increase the size of Pt-NPs embedded in the NiO support from 47% for NiO to 48%, 49%, and 54% for Pt2@NiO, Pt5@NiO, and Pt8@NiO nanocomposite respec- tively after 90 min. The results of MO degradation showed
Fig. 5 CH4 and CO formation rates: At different temperatures (a and c), and time on stream study at 773 K (b and d) for all catalysts
that Pt@NiO nanocomposites exhibited high photocatalytic activity in comparison to bare mesoporous NiO. This can be explained through improved optical behavior of nano- composites due to formed heterojunction between Pt and
NiO, which hindered the electron–hole recombination rate by trapping the excited electrons [44].
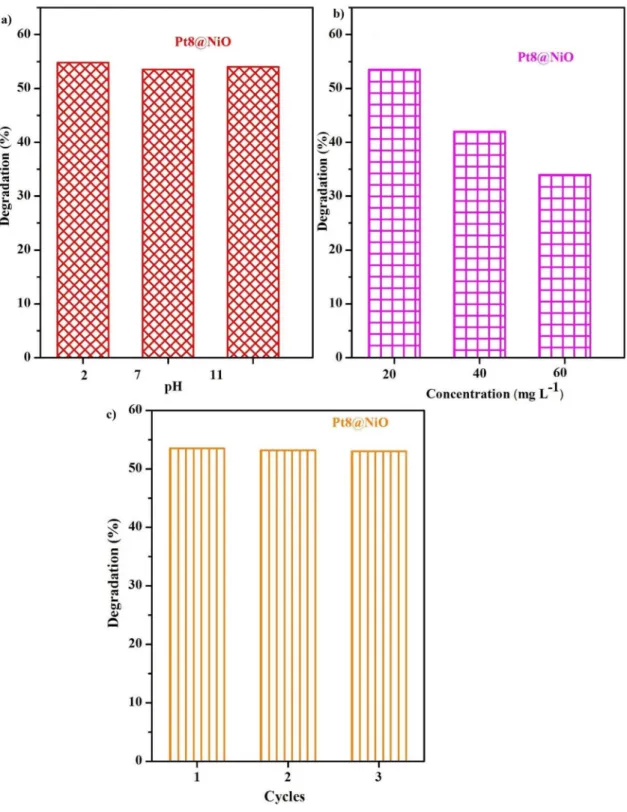
The photocatalytic activity of Pt8@NiO nanocompos- ite was further tested as a function of different pH (2, 7, and 11) of the solution as well as a function of the MO concentration. Pt8@NiO nanocomposite revealed as a very robust photo-catalyst with almost pH-independent degra- dation activity after irradiation with UV light for 90 min.
(Fig. 7a). On the other hand, the concentration of MO was found to impact the photocatalytic performance of nano- composite. Photocatalytic degradation of MO was decreased with the increase in the initial concentration of MO from 20 to 60 ppm; 54% of the initial 20 ppm MO was degraded whereas the degradation for 40 and 60 ppm was 42% and 34% respectively (Fig. 7b). Though adsorption is the pre- requisite of photocatalysis and more adsorption should lead to more photocatalysis, the difficulty of penetration of light through higher concentration of dye solution should also be considered problematic. Recyclability was also studied to know the stability of the catalyst under the optimized condi- tion such as 20 mg L−1 of MO, pH = 2, and 50 mg of catalyst (Fig. 7c). The MO photocatalytic degradation efficiency in the 2nd and 3rd cycle was 53.85% and 53.8% respectively.
These values were nearly the same of 1st cycle. It repre- sented that Pt8@NiO has good photocatalytic reusability.
4 Conclusion
In this study, mesoporous NiO supported size-controlled Pt nanoparticles were synthesized and used for CO2 catalytic hydrogenation and photocatalytic degradation of methyl orange. Pore size analysis has confirmed that the formation of mesoporous NiO and TEM results indicated that size-con- trolled Pt nanoparticles were formed. Catalytic CO2 hydro- genation was higher for Pt@NiO nanocomposite by the formation of mixed oxide Pt/PtOx/Ni/NiOx at the interface under reaction condition. The methyl orange photocatalytic degradation was also higher for Pt@NiO nanocomposite due to a decrease in the recombination of electron–hole pair under UV–Vis irradiation compared to mesoporous NiO.
Table 2 Comparison of catalytic CO2 hydrogenation to CH4 in a fixed bed reactor at atmospheric pressure with reported catalysts
XCO
2 : conversion of carbon dioxide (%); SCH
4 : selectivity of methane (%)
Catalyst Conditions T (K), (CO2/H2) molar ratio
XCO
2
(%) SCH
4
(%) References
Co/KIT-6 533, 1:4 46 99 [40]
Ru/P25 473, 1:4 27.4 100 [38]
Ni/CeO2-ZrO2 623, 1:4 80 100 [41]
Ru/γ-Al2O3 673, 1:5 85 85 [42]
NiO/ZnAl2O4 873, 1:4 65 47 [43]
Pd-Mg/SiO2 723, 1:4 59 95 [39]
Pt2@NiO 673, 1:4 50 76 Present work
Fig. 6 Photocatalytic degradation of methyl orange using NiO and Pt@NiO nanocomposites
Acknowledgements This paper was supported by the Hungarian Research Development and Innovation Office through grants NKFIH OTKA PD 120877 of AS. ÁK, and KZ is grateful for the fund of NKFIH (OTKA) K112531 and NN110676 and K120115, respectively.
The financial support of the Hungarian National Research, Develop- ment and Innovation Office through the GINOP-2.3.2-15-2016-00013 project “Intelligent materials based on functional surfaces—from
syntheses to applications” and the Ministry of Human Capacities through the EFOP-3.6.1-16-2016-00014 project and the 20391-3/2018/
FEKUSTRAT are acknowledged.
Fig. 7 MO photocatalytic degradation using Pt8@NiO nanocomposite: a effect of pH, b concentration of MO and c recyclability
References
1. M. Fang, N. Yi, W. Di, T. Wang, Q. Wang, Int. J. Greeen H. Gas.
Con. 93, 102904 (2020)
2. I. Omae, Catal. Today 115, 33–52 (2006)
3. S. Mutyala, M. Jonnalagadda, H. Mitta, R. Gundeboyina, Chem.
Eng. Res. Des. 143, 241–248 (2019)
4. A. Sayari, Y. Belmabkhout, R. Serna-Guerrero, Chem. Eng. J.
171, 760–774 (2011)
5. G. Centi, S. Perathoner, Catal. Today 148, 191–205 (2009) 6. X. Wang, L. Zhu, Y. Liu, S. Wang, Sci Total Environ. 625, 686–
695 (2018)
7. G. Zhou, H. Liu, K. Cui, H. Xie, Z. Jiao, G. Zhang, K. Xiong, X.
Zheng, Int. J. Hydrog. Energy 42, 16108–16117 (2017) 8. C. Italiano, J. Llorca, L. Pino, M. Ferraro, V. Antonucci, A. Vita,
Appl. Catal. B Environ. 264, 118494 (2020)
9. G. Zhou, H. Liu, Y. Xing, S. Xu, H. Xie, K. Xiong, J. CO2 Util.
26, 221–229 (2018)
10. Z. Qin, X. Wang, L. Dong, T. Su, B. Li, Y. Zhou, Y. Jiang, X. Luo, H. Ji, Chem. Eng. Sci. 210, 115245 (2019)
11. J. Díez-Ramírez, P. Sánchez, V. Kyriakou, S. Zafeiratos, G.E.
Marnellos, M. Konsolakis, F. Dorado, J. CO2 Util. 21, 562–571 (2017)
12. M. Tasbihi, F. Fresno, U. Simon, I.J. Villar-García, V. Pérez- Dieste, C. Escudero, V.A. de la Peña O’Shea, Appl. Catal. B Environ. 239, 68–76 (2018)
13. H. Jiang, Q. Gao, S. Wang, Y. Chen, M. Zhang, J. CO2 Util. 31, 167–172 (2019)
14. H.T.T. Nguyen, Y. Kumabe, S. Ueda, K. Kan, M. Ohtani, K.
Kobiro, Appl. Catal. A Gen. 577, 35–43 (2019)
15. A. Kim, D.P. Debecker, F. Devred, V. Dubois, C. Sanchez, C.
Sassoye, Appl. Catal. B Environ. 220, 615–625 (2018)
16. S. Navarro-Jaén, J.C. Navarro, L.F. Bobadilla, M.A. Centeno, O.H. Laguna, J.A. Odriozola, Appl. Sur. Sci. 483, 750–761 (2019) 17. A. Karelovic, P. Ruiz, Appl. Catal. B Environ. 113, 237–249
(2012)
18. P. Panagiotopoulou, Appl. Catal. A Gen. 542, 63–70 (2017) 19. M. Li, H. Amari, A.C. van Veen, Appl. Catal. B Environ. 239,
27–35 (2018)
20. S. Kattel, B. Yan, J.G. Chen, P. Liu, J. Catal. 343, 115–126 (2016) 21. Q. Liu, Y. Tian, Int. J. Hydrog. Energy 42, 12295–12300 (2017) 22. K. An, S. Alayoglu, N. Musselwhite, S. Plamthottam, G. Melaet,
A.E. Lindeman, G.A. Somorjai, J. Am. Chem. Soc. 135, 16689–
16696 (2013)
23. N.M. Hosny, Polyhedron 30, 470–476 (2011)
24. M. Nasirian, M. Mehrvar, J. Environ. Sci. 66, 81–93 (2018) 25. R. Saravanan, S. Karthikeyan, V.K. Gupta, G. Sekaran, V. Naray-
anan, A. Stephen, Mater. Sci. Eng. C 33, 91–98 (2013)
26. M.T. Islam, H. Jing, T. Yang, E. Zubia, A.G. Goos, R.A. Bernal, C.E. Botez, M. Narayan, C.K. Chan, J.C. Noveron, J. Environ.
Chem. Eng. 6, 3827–3836 (2018)
27. J. Gómez-Pérez, D.G. Dobó, K.L. Juhász, A. Sápi, H. Haspel, Á.
Kukovecz, Z. Kónya, Catal. Today 284, 37–43 (2017)
28. A. Sápi, T. Rajkumar, M. Ábel, A. Efremova, A. Grósz, A. Gyuris, K.B. Ábrahámné, I. Szenti, J. Kiss, T. Varga, Á. Kukovecz, Z.
Kónya, J. CO2 Util. 32, 106–118 (2019)
29. Q. Liu, S. Wang, G. Zhao, H. Yang, M. Yuan, X. An, H. Zhou, Y.
Qiao, Y. Tian, Int. J. Hydrog. Energy 43, 239–250 (2018) 30. H. Gao, Q. Yu, S. Zhang, T. Wang, P. Sun, H. Lu, F. Liu, X. Yan,
F. Liu, X. Liang, Y. Gao, G. Lu, Sensors Actuators B Chem. 269, 210–222 (2018)
31. K.S.W. Sing, Pure Appl. Chem. 57, 603–619 (1985)
32. C. de Julián Fernández, G. Mattei, C. Sada, C. Battaglin, P. Maz- zoldi, Mater. Sci. Eng. C 26, 987–991 (2006)
33. A. Sápi, G. Halasi, J. Kiss, D.G. Dobó, K.L. Juhász, V.J. Kolcsár, Z. Ferencz, G. Vári, V. Matolin, A. Erdőhelyi, Á. Kukovecz, Z.
Kónya, J. Phys. Chem. C 122, 5553–5565 (2018)
34. G.M. Schwab, K. Koller, J. Am. Chem. Soc. 90, 3078–3080 (1968)
35. J.Y. Park, L.R. Baker, G.A. Somorjai, Chem. Rev. 115, 2781–2817 (2015)
36. J. Kim, W.H. Park, W.H. Doh, S.W. Lee, M.C. Noh, J.-J. Gallet, F. Bournel, H. Kondoh, K. Mase, Y. Jung, B.S. Mun, J.Y. Park, Sci. Adv. 4, 3151–3158 (2018)
37. H. Lee, J. Lim, C. Lee, S. Back, K. An, J.W. Shin, R. Ryoo, Y.
Jung, J.Y. Park, Nat. Commun. 9, 2235–2242 (2018)
38. A. Kim, C. Sanchez, G. Patriarche, O. Ersen, S. Moldovan, A.
Wisnet, C. Sassoye, D.P. Debecker, Catal. Sci. Technol. 6, 8117–
8128 (2016)
39. J.-N. Park, E.W. McFarland, J. Catal. 266, 92–97 (2009) 40. G. Zhou, T. Wu, H. Xie, X. Zheng, Int. J Hydrog. Energy 38,
10012–10018 (2013)
41. P.A.U. Aldana, F. Ocampo, K. Kobl, B. Louis, F. Thibault-Star- zyk, M. Daturi, P. Bazin, S. Thomas, A.C. Roger, Catal. Today 215, 201–207 (2013)
42. G. Garbarino, D. Bellotti, E. Finocchio, L. Magistri, G. Busca, Catal. Today 277, 21–28 (2016)
43. T. Rajkumar, A. Sápi, M. Ábel, F. Farkas, J.F. Gómez-Pérez, Á.
Kukovecz, Z. Kónya, Catal. Lett. 150, 1527–1536 (2020) 44. F. Soofivand, M. Salavati-Niasari, J. Photochem. Photobiol. A
Chem. 337, 44–53 (2017)
Publisher’s Note Springer Nature remains neutral with regard to jurisdictional claims in published maps and institutional affiliations.