The Journal of Physical Chemistry C is published by the American Chemical Society.
Complexity of CO2 Hydrogenation over Size Controlled Pt Nanoparticles Supported on Mesoporous NiO
András Sápi, Gyula Halasi, Janos Kiss, Dorina G. Dobó, Koppány L. Juhász, Vanessza J Kolcsár, Zsuzsa Ferencz, Gabor Vari, Vladimír Matolín, András Erd#helyi, Akos Kukovecz, and Zoltán Kónya
J. Phys. Chem. C, Just Accepted Manuscript • DOI: 10.1021/acs.jpcc.8b00061 • Publication Date (Web): 21 Feb 2018 Downloaded from http://pubs.acs.org on February 24, 2018
Just Accepted
“Just Accepted” manuscripts have been peer-reviewed and accepted for publication. They are posted online prior to technical editing, formatting for publication and author proofing. The American Chemical Society provides “Just Accepted” as a service to the research community to expedite the dissemination of scientific material as soon as possible after acceptance. “Just Accepted” manuscripts appear in full in PDF format accompanied by an HTML abstract. “Just Accepted” manuscripts have been fully peer reviewed, but should not be considered the official version of record. They are citable by the Digital Object Identifier (DOI®). “Just Accepted” is an optional service offered to authors. Therefore, the “Just Accepted” Web site may not include all articles that will be published in the journal. After a manuscript is technically edited and formatted, it will be removed from the “Just Accepted” Web site and published as an ASAP article. Note that technical editing may introduce minor changes to the manuscript text and/or graphics which could affect content, and all legal disclaimers and ethical guidelines that apply to the journal pertain. ACS cannot be held responsible for errors or consequences arising from the use of information contained in these “Just Accepted” manuscripts.
In-situ DRIFTS and NAP-XPS Exploration of the Complexity of CO 2 Hydrogenation over Size
Controlled Pt Nanoparticles Supported on Mesoporous NiO
András Sápi*,†,‡, Gyula Halasi†,‡,János Kiss Ψ, ‡, Dorina G. Dobó† , Koppány L. Juhász†, Vanessza J. Kolcsár†, Zsuzsa Ferenczφ, Gábor Vári†, Vladimír Matolinϕ, András Erdőhelyiφ, Ákos Kukovecz†, Zoltán Kónya†,Ψ
†Department of Applied and Environmental Chemistry, University of Szeged, H-6720 Szeged, Hungary
φDepartment of Physical Chemistry and Material Science, University of Szeged, H-6720 Szeged, Hungary
ϕSurface Physics Group, Charles University in Prague, CZ-180 00 Praha 8 – Libeň, Czech Republic
ΨMTA-SZTE Reaction Kinetics and Surface Chemistry Research Group, University of Szeged, H-6720 Szeged, Hungary
ABSTRACT: 4.8 nm Pt nanoparticles were anchored onto the surface of mesoporous nickel- oxide supports (NiO). Pt/NiO samples were compared to pristine NiO and Pt/SBA-15 silica catalysts in CO2 hydrogenation to form carbon-monoxide, methane and ethane at 473-673 K.
1 % Pt/NiO were ~20 times and ~1.5 times more active at 493 K compared to Pt/SBA-15 and NiO catalysts, respectively. However, the Pt-free NiO support has an activity of 120%
compared to Pt/NiO catalysts at 673 K. In the case of 1% Pt/SBA-15 catalyst, selectivity towards methane was 13 %, while it was 90% and 98% for NiO and 1% Pt/NiO at 673 K, respectively. Exploration of the results of the reactions was performed by Near Ambient Pressure X-ray Photoelectron Spectroscopy (NAP-XPS) as well as in-situ Diffuse Reflectance 2
3 4 5 6 7 8 9 10 11 12 13 14 15 16 17 18 19 20 21 22 23 24 25 26 27 28 29 30 31 32 33 34 35 36 37 38 39 40 41 42 43 44 45 46 47 48 49 50 51 52 53 54 55 56 57
Infrared Fourier Transform Spectroscopy (DRIFTS). In the case of pure NiO, we found that the surface of the support was mainly covered by elemental Ni under reaction condition, where the Ni/NiOx system is responsible for the high activity of Pt-free catalyst. In the case of Pt/NiO, Pt improves the reduction of NiOx towards metallic Ni. In the case of the 1 % Pt/NiO catalysts, the presence of limited amount of Pt resulted in an optimal quantity of oxidized Pt fraction at 673 K showing the presence of a Pt/PtOx/Ni/NiOx mixed phase where the different interfaces may be responsible for the high activity and selectivity towards methane. In the case of pure NiO under reaction condition, small amounts of formaldehyde as well as hydrogen perturbed CO [HnCO (n=1,2)] were detected. However, in the case of 1 % Pt/NiO catalysts, besides the absence of formaldehyde a significant amount of HnCO (n=2-3) was present on the surface responsible for the high activity and methane selectivity.
INTRODUCTION
Carbon-dioxide conversion into fuels is highly relevant today both from the process improvement and from the environmental points of view1,2,3. Heterogeneous catalysis4, electrochemistry5, photochemistry6 or photoelectrochemistry7,8 etc. are used to find the perfect solution for carbon dioxide reduction towards sufficient energy forming methods.
Noble metal (Rh, Ru, Pt, Pd) or Ni, Fe, Co based catalysts are productive materials for methanation reactions9,10 and CuO/ZnO/Al2O3 systems are used for methanol synthesis11. MnOx/CoOx hybrid catalysts are promising candidates for low pressure high energy fuel synthesis4. Pt supported on Nb2O5 or ZrO2 is also active in low temperature CO2
hydrogenation12. Nickel based catalysts are cost efficient and have high efficiency in CO2
methanation reactions9. Pt/NiO systems are active in C=O bond activation13, where the Pt/NiO interface as well as the oxidation state of the support play a role in the reaction pathways. Size controlled Pt nanoparticles anchored onto the surface of designed mesoporous NiO films resulted in a high efficiency photoelectrochemical catalyst7.
Recent developments in engineering the metal–support interaction in Co3O4, MnO2, and CeO2 supported Pt nanoparticle systems have resulted in catalysts with enhanced activity in the CO oxidation reaction13. Another major achievement was the 50% reduction of the CO2
methanation activation energy by deliberately exploiting the hydrogen spillover
phenomenon14. In-situ investigation methods were used successfully to facilitate the in-depth understanding of the reactions, reactants, intermediates, and the surface chemistry of the 3
4 5 6 7 8 9 10 11 12 13 14 15 16 17 18 19 20 21 22 23 24 25 26 27 28 29 30 31 32 33 34 35 36 37 38 39 40 41 42 43 44 45 46 47 48 49 50 51 52 53 54 55 56
catalysts under reaction conditions15,16,17. Based on the knowledge accumulated about the activity, mechanism, and selectivity of the CO2 hydrogenation reaction, such advances correspond to major steps beyond trial-and-error catalyst exploration.
Despite the potential advantages of Pt/NiO systems, studies on the rational design of Pt/NiO catalysts are scarce and somewhat contradictory. The structure of the active catalysts as well as the mechanism of the reaction and the nature of the surface intermediates are hardly investigated under reaction conditions in CO2 hydrogenation. From earlier reports one could infer that the CO2 hydrogenation reaction over Pt/NiO catalysts may include nickel-oxide reduction towards elemental nickel with or without Pt enhancement18, carbonate and formate formation on the surface of the metal or the oxide19,20, formation of CO and hydrogen
perturbed CO on the metal surface which can turn into CO as well as low weight hydrocarbon (e.g. CH4) products21. The debate on these questions is a hot issue today in the field.
We report here on anchoring size controlled Pt nanoparticles with 4.8 nm diameter onto the surface of a designed 3D mesoporous nickel-oxide support. Pt/NiO, pristine NiO as well as Pt supported SBA-15 catalysts were tested in CO2 hydrogenation in the gas phase in a flow reactor between 493-673 K. The catalysts were monitored with Temperature Programmed Reduction (TPR) and Near Ambient Pressure X-ray Photoelectron Spectroscopy (NAP-XPS) as well as in-situ Diffuse Reflectance Infrared Fourier Transform Spectroscopy (DRIFTS) under reaction conditions. 1% Pt/NiO sample had the highest activity in CO2 hydrogenation at 693 K, where the main product was CH4. Pure mesoporous nickel-oxide support showed significant activity due to the Ni/NiO interface on the surface.
The reducibility of oxide supports in the presence of metal catalysts is crucial for deep understanding of hydrogenation reactions. The lack of knowledge on nickel-oxide supported Pt systems also conducted our attention to investigate mesoporous nickel oxide supported Pt nanoparticles with in-situ techniques under parameters of hydrogenation of CO2.
We found that under reaction conditions, in the case of Pt/NiO catalyst, there is a complex interface of Ni/NiOx/PtO/Pt where Pt boosts the reduction of NiO to metallic Ni on the top layers via the assistance of oxygen migration to the surface from the bulk. Furthermore, in the case of the most active 1 % Pt/NiO catalyst, the surface was highly covered by hydrogen perturbated CO under reaction condition showing the important role of such intermediates towards the high CH4 activity and selectivity. Interestingly, in the case of the pristine NiO and 2
3 4 5 6 7 8 9 10 11 12 13 14 15 16 17 18 19 20 21 22 23 24 25 26 27 28 29 30 31 32 33 34 35 36 37 38 39 40 41 42 43 44 45 46 47 48 49 50 51 52 53 54 55 56 57
the high Pt content Pt/NiO catalyst, formaldehyde was found on the surface, which was stable and may decompose towards CO and carbonate.
EXPERIMENTAL SECTION Synthesis of 4.8 nm Pt nanoparticles
Synthesis of 4.8 nm particles is based on a modified version of the polyol-method22,7. Briefly, 0.04 g Pt(C5H7O2)2 and 0.035 g polyvinylpyrrolidone (PVP, MW = 40,000) are solved in 5 ml ethylene-glycol and ultrasonicated for 30 minutes to obtain a homogenous solution. The reactor is a three-necked round bottom flask, which is evacuated and purged with atmospheric pressure argon gas for several cycles to get rid of additional oxygen and water. After three purging cycles, the flask was immersed in an oil bath heated to 200 °C under vigorous stirring of the reaction mixture as well as the oil bath. After 10 minutes of reaction, the flask was cooled down to room temperature. The suspension is precipitated by adding acetone and centrifuging. The nanoparticles are washed by centrifuging with hexane and redispersing in ethanol for at least 2-3 cycles, and finally redispersed in ethanol.
Synthesis of Mesoporous Nickel Oxide support
For the preparation of mesoporous nickel-oxide support (NiO), hard template replica method was applied13. For the synthesis, KIT-6 silica was used as a hard template. For the synthesis of KIT-6, 27 g of Pluronic-123 block copolymer and 43.5 ml HCl was dissolved in 980 ml water. After 30 min, 33.3 ml n-butanol was added to the solution at 35 °C under vigorous stirring. After 1 h of stirring, 58 g of Tetraethyl orthosilicate (TEOS) was added dropwise to the solution followed by stirring for 24 h at 35 °C. The solution is stored in a capped plastic autoclave at 40 °C for another 24 h. Then the solid product was filtered, dried at 90 °C overnight and calcined at 550 °C for 6 h.
NiO was prepared through the hard template method using the as-prepared KIT-6. In a typical synthesis, 4,65 g Ni(NO3)2·6 H2O was dissolved in 8 ml water at 65 °C and in another flask 4 g KIT-6 was dissolved in 40 ml toluene at 65 °C. They were stirring separetly for 30 min, then the second suspension was transferred into the first with 10 ml of toluene. Vigorous stirring was applied to the mixture at 65 °C until the total evaporation of toluene. After the evaporation, the precipitated product was collected and dried at 60 °C overnight, followed by calcination at 300 °C for 6 h. The silica template was completely removed by several washing 3
4 5 6 7 8 9 10 11 12 13 14 15 16 17 18 19 20 21 22 23 24 25 26 27 28 29 30 31 32 33 34 35 36 37 38 39 40 41 42 43 44 45 46 47 48 49 50 51 52 53 54 55 56
steps using 200 ml, 2 M aqueous NaOH solution and destilled H2O. The sample was washed to neutral pH. The filtered product was dried at 50 °C overnight.
Synthesis of SBA-15 mesoporous silica support
SBA-15 mesoporous silica support was synthesized from tetraethyl orthosilicate (TEOS) by a soft template method. Here, 8 g of pre-melted Pluronic-123, 60 ml distilled water and 240 ml of 2 M HCl solution were mixed at 40 °C for 2 hours. After the dissolution of P-123, 17 g of TEOS was added dropwise to the mixture at 40 °C and continuous stirring was applied for 20 hours. Stirring was continued for 36 hours at 60 °C. After the synthesis, the product was filtered and washed with distilled water. Then, the product was heated to 100 °C with a heating rate of 2 °C·min-1 and aged for 5 hours; then the temperature was elevated to 550 °C with a heating rate of 1 °C·min-1. After 4 hours of calcination, the product was ready for further use.
Synthesis of Mesoporous NiO and SBA-15 supported Pt catalysts
To fabricate supported catalysts, the ethanol suspension of Pt nanoparticles and the different supports (NiO, SBA-15) were mixed in ethanol and sonicated in an ultrasonic bath (40 kHz, 80 W) for 3 hrs. The supported nanoparticles were collected by centrifugation. The products were washed with ethanol three times before they were dried at 80 ⁰C overnight.
Hydrogenation of carbon-dioxide in a continuous flow reactor
Before the catalytic experiments either in a continuous-flow reactor or in the ambient pressure XPS chamber the as received catalysts were oxidized in O2 atmosphere at 573 K for 30 min to remove the surface contaminants as well as the PVP capping agent23,24 and thereafter were reduced in H2 at 573 K for 60 min.
Catalytic reactions were carried out in a fixed-bed continuous-flow reactor (200 mm long with 8 mm i.d.), which was heated externally. The dead volume of the reactor was filled with quartz beads. The operating temperature was controlled by a thermocouple placed inside the oven close to the reactor wall, to assure precise temperature measurement. For catalytic studies small fragments (about 1 mm) of slightly compressed pellets were used. Typically, the reactor filling contained 20-150 mg of catalyst. In the reacting gas mixture, the CO2:H2 molar 2
3 4 5 6 7 8 9 10 11 12 13 14 15 16 17 18 19 20 21 22 23 24 25 26 27 28 29 30 31 32 33 34 35 36 37 38 39 40 41 42 43 44 45 46 47 48 49 50 51 52 53 54 55 56 57
ratio was 1:4, if not denoted otherwise. The CO2:H2 mixture was fed with the help of mass flow controllers (Aalborg), the total flow rate was 50 ml/min. The reacting gas mixture flow entered and left the reactor through an externally heated tube to avoid condensation. The analysis of the products and reactants was performed with an Agilent 6890 N gas chromatograph using HP-PLOTQ column. The gases were detected simultaneously by thermal conductivity (TCD) and flame ionization (FID) detectors. The CO2 was transformed by a methanizer to methane, and it was also analyzed by FID.
In a typical measurement, after the pretreatment process, the samples were cooled in flowing H2 to 473 K and the catalysts were introduced to CO2:H2 mixture with a molar ratio of 1:4 with a total flow rate of 50 ml/min at 473 K and the reactor was heated linearly at a rate of 5 K/min up to 673 K and equilibrated for 120 min. After this method, we started measurements in the case of 1% Pt/SBA-15 and 5 % Pt/SBA-15 at 673 K, 643 K, 623 K, 593 K and then were heated back to 613 K, 653 K, 673 K after waiting for constant activity at each temperature (~1 hr). In the case of NiO, 1% Pt/NiO and 5% Pt/NiO catalysts, we used temperatures of 673 K, 583 K, 568 K, 553 K, 538 K and 523 K. We plotted corresponding Arrhenius-plots in the conversion regime of 0.5-10 %.
Temperature Programmed Reduction (TPR)
The temperature-programmed reduction (TPR) was carried out in a BELCAT-A apparatus using a reactor (quartz tube with 9 mm outer diameter) that was externally heated. Before the measurements, the catalyst samples were treated in oxygen at 573 K for 30 min. Thereafter, the sample was cooled in flowing Ar to room temperature and equilibrated for 15 min. The oxidized sample was flushed with Ar containing 10% H2, the reactor was heated linearly at a rate of 20 K·min-1 up to 1373 K and the H2 consumption was detected by a thermal
conductivity detector (TCD).
Furthermore, after the catalytic experiments, TPR measurements were performed on the spent catalysts to gain information on the quality and quantity of deposited carbon. After running the reactions of CO2:H2 mixtures at 673 K for 120 min, the reactor was flushed with He at the reaction temperature. The sample was subsequently cooled to ambient temperature, the helium flow was changed to H2, and the sample was heated up to 1173 K with a 20 K·min-1 heating rate. The in situ formed products were analyzed and quantified by gas
chromatography.
3 4 5 6 7 8 9 10 11 12 13 14 15 16 17 18 19 20 21 22 23 24 25 26 27 28 29 30 31 32 33 34 35 36 37 38 39 40 41 42 43 44 45 46 47 48 49 50 51 52 53 54 55 56
Near Ambient Pressure X-ray Photoelectron Spectoscropy (NAP-XPS)
An ultra-high vacuum system equipped with a hemispherical analyzer (PHOIBOS series with 1 DLD detector) and a monochromatic AlKα (hν=1486.6 eV) X-ray radiation source was employed to perform the X-ray photoelectron spectroscopy25. The binding energy scale of all XPS spectra was calibrated according to the C 1s reference (284.3 eV, which corresponds to the adventitious carbon). However, only the relative energy position of XPS photoelectron lines in each sample is needed to determine the valence band offset (VBO) and the absolute energy calibration for a sample does not affect the ultimate result. The XPS spectra were analysed by fitting the Shirley-type function, which is commonly used in XP spectra
deconvolution26 and a sum of Voigt functions to the experimental results, using the KolXPD software24. The catalysts were pre-treated (oxidized and reduced) before the experiments the same way as before the catalytic measurements. The partial pressure of the oxygen under the oxidation was 20 mbar and in the case of reduction the hydrogen was set to 5 mbar. Under reaction conditions, the ratio of the CO2:H2 was set to 1:4 with a total pressure of 5 mbar.
In-situ Diffuse Reflectance Infrared Fourier Transform Spectroscopy (DRIFTS)
Infrared spectroscopy measurements were carried out with an ‘Agilent Cary-670’ FTIR spectrometer equipped with ‘Harrick Praying Mantis’ diffuse reflectance attachment. The sample holder had two BaF2 windows in the infrared path.The spectrometer was purged with dry nitrogen. The spectrum of the pretreated catalyst was used as background.At room temperature, a CO2-to-H2 molar ratio of 1:4 was introduced into the DRIFTS cell. The tubes were externally heated to avoid condensation. The catalyst was heated under the reaction feed linearly from room temperature to 773 K, with a heating rate of 20 K·min-1 and IR spectra were measured at 50 K intervals. All spectra were recorded between 4000 and 900 cm-1 at a resolution of 2 cm-1. Typically, 32 scans were registered. Due to the short optical path within the DRIFTS cell, the contribution of the reactant gases was negligibly small, and from gas phase products only the most intense features were observable.
High Resolution Transmission Electron Microscopy (HR-TEM)
Imaging of the different silica supports, Pt nanoparticles and derived catalysts, as well as the size distribution of the nanoparticles before and after the catalytic reaction, was performed by an FEI TECNAI G2 20 X-Twin high-resolution transmission electron microscope (equipped 2
3 4 5 6 7 8 9 10 11 12 13 14 15 16 17 18 19 20 21 22 23 24 25 26 27 28 29 30 31 32 33 34 35 36 37 38 39 40 41 42 43 44 45 46 47 48 49 50 51 52 53 54 55 56 57
with electron diffraction) operating at an accelerating voltage of 200 kV. The samples were drop-cast onto carbon film coated copper grids from ethanol suspension.
Powder X-ray Diffraction (XRD)
XRD studies of the silica supports were performed on a Rigaku MiniFlex II instrument with a Ni-filtered CuKα source in the range of 2θ = 10-80°.
Gas Sorption Measurements
The specific surface area (BET method), the pore size distribution and the total pore volume were determined by the BJH method using a Quantachrome NOVA 2200 gas sorption analyzer by N2 gas adsorption/desorption at - 196 °C. Before the measurements, the samples were pre-treated in vacuum (<~ 0.1 mbar) at 473 K for 2 hours.
3. RESULTS AND DISCUSSION 3.1 Characterization of the catalysts
Platinum nanoparticles were synthesized by a polyol method from platinum-chloride precursor using ethylene glycol as a media and PVP as a capping agent7. The as-prepared Pt nanoparticles have a narrow size distribution with an average diameter of 4.8 ± 1.5 nm (Fig.
1/A.). Electron Diffraction patterns confirm the presence of Pt (111), Pt (200), Pt (220) and Pt (311) crystallite planes characteristic for metallic face-centered cubic (fcc) platinum.
Mesoporous nickel oxide was prepared by the replica method using KIT-6 mesoporous silica as a hard template and SBA-15 silica for reference state support were synthetized by the soft method using tetraethyl orthosilicate (TEOS) as a template13. TEM investigations confirm the mesoporous structure of the as-prepared mesoporous NiO and SBA-15 supports with a pore diameter of 3-6 nm (Fig. 1/B., Fig. 1/C.).
4.8 nm Pt nanoparticles were successfully loaded onto the surface of the catalyst supports in both 1 wt% (Fig. 1/C., Fig. 1/D.) as well as in 5 wt% (Fig. 1/E., Fig. 1/F.) concentration. In case of 1% loading, there is a smooth distribution of the Pt nanoparticles. In the case of 5 % loading, clusters of 3-7 pieces of Pt nanoparticles were also observed.
3 4 5 6 7 8 9 10 11 12 13 14 15 16 17 18 19 20 21 22 23 24 25 26 27 28 29 30 31 32 33 34 35 36 37 38 39 40 41 42 43 44 45 46 47 48 49 50 51 52 53 54 55 56
Figure 1. Typical TEM images of 4.8 ± 1.5 nm metallic Pt nanoparticles with narrow size distribution (ED pattern shows the presence of metallic Pt) (A), mesoporous nickel-oxide support (B), and 4.8 nm PtNPs supported on SBA-15 and NiO with a loading of 1 wt% (C, D) as well as of 5 wt% (E, F)
The N2 adsorption/desorption isotherms for pure NiO as well as for SBA-15 silica supports show a type V isotherm characteristic for mesoporous materials (Fig. S1/A., Fig. S1/B.). The type H1 hysteresis loop further strengthening the presence of an ordered structure. The specific surface area was found to be as high as 127 m2/g and 820 m2/g for pure NiO and SBA-15, respectively. The XRD patterns of the as-prepared NiO confirms the presence of Ni(II)O (100), (200), (220), (311) and (222) crystal planes, characteristic to the face centered cubic (fcc) nickel(II)- oxide structure (Fig. S1/C.). The broadened diffractions with lower intensity show the amorphous nature of the NiO, which further correlates with the TEM images. In the case of the SBA-15 support, only the weak, broadened diffraction of SiO2
(101) was observed indicating the low crystallinity of the silica material (Fig. S1/D.) 2
3 4 5 6 7 8 9 10 11 12 13 14 15 16 17 18 19 20 21 22 23 24 25 26 27 28 29 30 31 32 33 34 35 36 37 38 39 40 41 42 43 44 45 46 47 48 49 50 51 52 53 54 55 56 57
3.2 Hydrogenation of CO2 over mesoporous NiO and 4.8 nm Pt nanoparticles supported on SBA-15 and NiO
1% and 5 % 4.8 nm Pt nanoparticles supported on mesoporous nickel oxide as well as pure NiO and 4.8 nm Pt nanoparticle/SBA-15 samples for reference state were tested in CO2
hydrogenation to form carbon-monoxide, methane, and ethane at 593-673 K in a fix bed flow catalytic reactor. The summarized catalytic results are collected on Fig. 2.
1 % Pt/NiO was ~45 times and ~1.5 times more active at 593 K compared to Pt/SBA-15 and 5
% Pt/NiO catalysts, respectively (Fig. 2/A.). However, the Pt-free NiO support has an activity of ~120% compared to 1 % Pt/NiO catalysts at both 593 K and 673 K (Fig. 2/B.). In the case of 1% Pt/SBA-15 catalyst, selectivity towards methane was 13 %, while it was 90% and 98%
for NiO and 1% Pt/NiO at 673 K, respectively (Fig. 2/C., Fig. 2/D.).
In the case of Pt/SiO2 catalysts, the main product was CO via the water-gas-shift reaction from CO2 which was formed at the interface of the Pt and SiO227. In the case of pure NiO, the high selectivity towards CH4 indicates the formation of metallic nickel on the NiO surface under reaction condition as metallic nickel is a well-known catalyst in CO2 methanation9,28. Pt has no significant conversion enhancing effect on the reactivity of mesoporous nickel-oxide.
In the case of the most active 1% Pt/NiO catalyst, 78% conversion was reached at 673K. Size controlled Pt nanoparticles have an activity increasing effect in 1 % loading. However, the activity of 5% Pt/NiO is lower than that of pure NiO catalysts. Also, the excess amount of Pt resulted in enhanced CO production showing the presence of individually working Pt surfaces blocking some of the active NiO sites and Pt/Ni/NiOx interphases.
A small amount of ethane was detected in the case of nickel-oxide support. 5% Pt/NiO catalysts produced 3 times more ethane (0.12 %) compared to pure NiO (0.04 %) and 1%
Pt/NiO catalyst (0.03 %) (Fig. S2/A.). The catalysts remained stable at 673 K under the reaction condition for at least 2.5 hours (Fig. S2/B.).
3 4 5 6 7 8 9 10 11 12 13 14 15 16 17 18 19 20 21 22 23 24 25 26 27 28 29 30 31 32 33 34 35 36 37 38 39 40 41 42 43 44 45 46 47 48 49 50 51 52 53 54 55 56
Figure 2. CO2 hydrogenation over 1% and 5% Pt/NiO, Pt/SBA-15 and pure NiO catalysts at 593 K and 673K
Activation energy calculation was determined for all catalysts in the kinetical regime (0.5- 10% conversion) at 523-623 K (Fig. S3.). For 1% Pt/SBA-15 and 5 % Pt/SBA-15, the activation energies were 16.7 kcal/mol and 19.4 kcal/mol, respectively. This results are correlated with other studies10.
In the case of Pt free mesoporous nickel oxide support, the higher activation energy (25.2 kcal/mol) show the presence of different mechanism. This phenomenon shows different pathway of the reaction as it is clearly seen from the fact that the selectivity towards CH4 is higher compared to the Pt/SBA-15 systems. These activation energy values for CO as well as for CH4 formation is comparable for the results from literature29.
In the case of mesoporous nickel oxide supported catalyst, the presence of the Pt nanoparticles resulted in a slight decrease of the activation energies. For 1% Pt/NiO and 5 % Pt/NiO, the 2
3 4 5 6 7 8 9 10 11 12 13 14 15 16 17 18 19 20 21 22 23 24 25 26 27 28 29 30 31 32 33 34 35 36 37 38 39 40 41 42 43 44 45 46 47 48 49 50 51 52 53 54 55 56 57
activation energies were 22.8 kcal/mol and 20.7 kcal/mol, respectively. Pt plays an important role in the reduction of nickel oxide as well as preferring other reaction routes. For deeper understanding of Pt/NiO system in this reaction, H2 TPR, NAP-XPS as well as DRIFTS studies were performed.
3.3 Temperature programmed reduction
The reduction profile of supported metal catalysts depends on the interaction of the metal with its support30. In present cases the catalysts were oxidized at 573 K for 30 min. In the case of Pt/SBA-15, there is no significant interaction between Pt and support. The platinum oxide formed during oxidation treatment can be reduced at 500-850 K. The lower TPR peak is at 580 K, the higher is at 697 K (Fig. S4.). Pt0 can be obtained in this temperature range on SBA-15 and SiO2 according to the literature31,32. Where the interaction of Pt with oxide support is strong as in Pt/NiO case33, the positively charged platinum (Pt2+ or Pt4+) is relatively unstable and is easily reduced to Pt0.
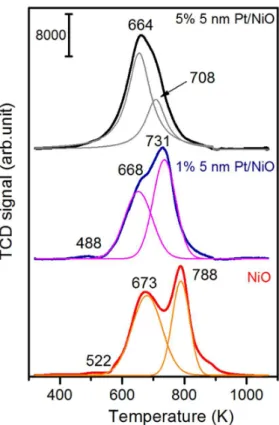
In the case of the Pt anchored onto mesoporous nickel oxide support, part of the platinum is reduced at 488 K. However, the reduction of the other part of the platinum take places at higher temperatures (at the low temperature tailing of the feature of NiO) (Fig. 3.).
The reducibility of NiO as catalyst and as catalyst support depends on the morphology, porosity and the preparation methods. In harmony with the literature34, the NiO can be reduced in two steps (Fig. 3.); the peak at 673 K could be attributed to reduction from Ni2+ to Niδ+ and the peak at 788 K is the characteristic temperature of the Niδ+ to Ni0 reduction. A very small TPR peak at 522 K is probably due to the reduction of a trace amount of Ni3+. The reducibility of NiO dramatically changes in the presence of Pt. Both characteristic TPR peaks moved to lower temperature. These changes are increasing with Pt metal content even at same sizes (4.8nm). In the case of the 1 % Pt/NiO, the TPR peaks are at 668 and 731 K. At 5 % metal content, the peak temperatures moved further to 664 and 713 K (Fig. 3.). In the case of 5 % Pt content, the H2 consumption of second peak is less than that of first step, suggesting that NiO can be reduced to a great degree during the first step. It should be emphasized that TPR is a dynamic method therefore, if the reduction was carried out under isothermic condition, the same reduction trend would be achieved at lower temperatures.
3 4 5 6 7 8 9 10 11 12 13 14 15 16 17 18 19 20 21 22 23 24 25 26 27 28 29 30 31 32 33 34 35 36 37 38 39 40 41 42 43 44 45 46 47 48 49 50 51 52 53 54 55 56
Figure 3. TPR profile for NiO and NiO supported 4.8 nm Pt nanoparticles with a loading of 1
% as well as 5 % showing the enhancing effect of Pt on NiO reduction towards metallic nickel.
3.4 NAP-X-ray photoelectron spectroscopy during the catalytic reaction
Pure nickel oxide, 5 % Pt/NiO catalyst was tested in NAP-XPS measurements under reaction conditions (573 K – 673 K, p = 5 mbar, CO2:H2 ratio was 1:4). Before catalytic reactions the catalysts were oxidized in O2 at 573 K, and then reduced at 573 K in H2 for 30 min. (The XPS spectra recorded during different treatments are presented in the Supporting Information).
In the case of the as-prepared and oxidized NiO, the Ni 2p shows two different Ni states: one corresponds to NiO (853.4 eV) the other is very close to Ni(OH)2 form (855.6 eV) (Fig.
S5/A.). A strong satellite appeared at 860.6 eV, which is characteristic for NiO. After oxidation a typical Ni 2p3/2 structure appeared at 853.1 and 855.1 eV and an intense satellite was detected at 860.4.0 eV. Very similar spectrum was reported previously for polycrystalline and macro-mesoporous NiO35,36,33. After reduction at 573 K, the main peak moved to 852.4 2
3 4 5 6 7 8 9 10 11 12 13 14 15 16 17 18 19 20 21 22 23 24 25 26 27 28 29 30 31 32 33 34 35 36 37 38 39 40 41 42 43 44 45 46 47 48 49 50 51 52 53 54 55 56 57
eV, and a peak developed at 858.1 eV as a satellite indicated that metallic Ni is dominant37, a small but remarkable oxidized fraction remained at 853.2 eV.
The C 1s signals are shown in Fig. S5/B. The as prepared sample contains C 1s features (284.3 and around 288.2 eV) due to the adventitious carbon and precursor molecules. After oxidation-reduction, only a small intensity carbon feature was left at 284.3 eV.
Similar spectra were obtained on Pt/NiO for Ni 2p with only differences that after reduction Ni2+ contribution was not detected. The C 1s due to the template and PVP were removed in oxidation-reduction cycle. The Pt 4f shows mainly Pt0 chemical state; only a small fraction remained in the partially oxidized state.
Figure 4. Ni 2p XP spectra of NiO (A) and 5 % Pt/NiO (B) under CO2 hydrogenation conditions and subsequent evacuation at 673 K
Under reaction conditions at 573 K – 673 K, on the surface of NiO the Ni 2p3/2 appeared at 852.4 eV which corresponds to zero valent Ni0 (Fig. 4/A.). A shoulder can be detected at 853.1 eV due to Ni2+ with its satellites at 855.1 and 860.4 eV, which are characteristic for NiO33,35,36 the latter one appeared only with very small intensity. Two obvious satellites are fitted by peaks with BE near 856.3 eV (hardly detectable) and at 858.1 eV (major) above the 3
4 5 6 7 8 9 10 11 12 13 14 15 16 17 18 19 20 21 22 23 24 25 26 27 28 29 30 31 32 33 34 35 36 37 38 39 40 41 42 43 44 45 46 47 48 49 50 51 52 53 54 55 56
main emission of Ni0 at 852.4 eV which is characteristic for metallic Ni37. The satellite for NiO at 860.4 eV is in well-detectable in the deconvoluted spectrum obtained after vacuum treatment at 673 K (Fig. 4/A.). In the determination of the ratio of metallic and oxidized fraction we considered all the six emissions in deconvolution in the Ni 2p3/2 range.
At 5 mbar total pressure and at 573 K, in the case of pure nickel-oxide, the nickel is mainly in reduced state (74% Ni0/ΣNi). The metallic nature of the surface became less significant in CO2 hydrogenation at 673 K (~69% Ni0/ΣNi) and the following UHV conditions (~ 56 %).
These phenomena may be attributed to the fast migration of the oxygen atoms to the surface as well as the slow reoxidation of the elemental nickel on the surface by the adsorbed CO238
or water39.
Beside Ni 2p, C1s and O1s XP signals were also monitored during reaction conditions at 573 and 673 K (Fig. S6. and Fig.S7.). Intense photoemission peaks developed at 292.7 and 291.3 eV in the case of C1s spectra. These peaks can be attributed to gas phase CO2 and gas phase CO formed in the reaction40, respectively. These XPS signals disappeared when the surface was evacuated at 573 or 673 K (Fig. S6.). It is an important observation that a carbon species remained at 283.2 eV (except adventitious carbon) on the surface after reaction at 573 K.
Very likely this peak corresponds to carbidic carbon41,42. The origin of this species is the result of decomposition of CHx. This form markedly decreased on the surface after reaction at 673 K. We suppose in harmony with the literature the carbon on Ni dissolves to the bulk.
This was confirmed by TPR spectroscopy when the used catalyst was heated in hydrogen at a heating rate of 10 K·min-1. The amount of the carbon was below the detection (not shown).
Corresponding O 1s signals for gas phase CO and CO2 were detected at 536.4 and 537.6 eV, respectively43 (Fig. S7.). Besides surface (531.0 eV) and lattice (530.0 eV) oxygen XPS peaks, a relatively broad peak centered at 533 eV was also present. Detailed analysis did not attempt because the DRIFTS give much precise identification of intermediates and adsorbed species. This complex peak may contain formate and different carbonates and adsorbed CO contributions27,44,8 which were identified by DRIFTS (see below). After evacuation at 673 K, the intensity of the O 1s region decreased due to desorption (not shown), but it became more complex as a significant fraction of formate (and formaldehyde) might be transformed to carbonate as independently detected by DRIFTS (see below). Note that the possibility of readsorption from background during evacuation cannot be completely excluded.
2 3 4 5 6 7 8 9 10 11 12 13 14 15 16 17 18 19 20 21 22 23 24 25 26 27 28 29 30 31 32 33 34 35 36 37 38 39 40 41 42 43 44 45 46 47 48 49 50 51 52 53 54 55 56 57
Figure 5. Pt 4f XPS spectrum of 5 % Pt/NiO under pretreatment (in O2 and H2) as well as reaction conditions at 5 mbar total pressure of CO2:H2 with a ratio of 1:4 at 573 K and 673 K.
In the case of the 5 % Pt/NiO catalyst, the Ni 2p3/2 was also followed during reactions at 573 and 673 K and after evacuation at 673 K, respectively (Fig. 4B.). The obtained results are relevant compared to the NAP-XPS studies of the pure NiO catalyst. (In the determination of the ratio of metallic and oxidized fraction we considered all the six emissions of Ni and NiO in deconvolution.) During CO2 hydrogenation at 573 K, the surface concentration of metallic nickel is 69 % (Fig. 4B.). In the case of the pure nickel-oxide catalyst, at 673 K and after reaction at 673 K, the concentration of the Ni0 decreased from ~69% to ~56 %. However, in the case of Pt containing catalyst this trend was opposite. This shows a metallic nickel
enrichment on the surface after CO2 hydrogenation at 673 K (~69 %). After reaction at 673 K under UHV condition, the concentration was ~71.5 %. Probably, oxygen diffusion from the 3
4 5 6 7 8 9 10 11 12 13 14 15 16 17 18 19 20 21 22 23 24 25 26 27 28 29 30 31 32 33 34 35 36 37 38 39 40 41 42 43 44 45 46 47 48 49 50 51 52 53 54 55 56
bulk also takes place, where the oxygen atoms from the bulk as well as from the surface of the nickel-oxide support migrate to the Pt nanoparticles helping in the reduction of nickel-oxide.
During reaction at 573 K, a small amount of oxidized Pt was observed (Fig. 5.). Under reaction conditions at 673 K, the amount of the oxidized fraction decreased. However, when the catalyst was evacuated at 673 K, the oxidized fraction was regained showing the presence of the oxygen transferring properties of the Pt nanoparticles from the nickel-oxide to the Pt catalyst. In addition, we may suppose that the enhanced electron transfer from Pt
nanoparticles to NiO or Ni/NiO interface40 and oxidation of Pt nanoparticles by CO2 or CO2
derivatives (carbonate-like surface species) also contribute to the increased oxidized Pt fraction.
The other important observation is that the intensity of Ni 2p3/2 is increasing with the
temperature in the presence of Pt. Besides the reduction of the surface from NiO to elemental nickel, the bulk 5 % Pt/NiO catalyst showed the presence of a high amount of metallic Ni observed by separate XRD studies (Fig. S8.). Furthermore, a slight sharpening of the Pt (111) diffraction peak was observed showing the aggregation of the Pt nanoparticles during the catalytic reaction resulting in the increase of the Ni 2p3/2 intensity after reaction. These phenomena show that Pt assist nickel (Ni + NiO) enrichment on the surface which is crucial in the activity and selectivity of the catalyst in the hydrogenation of CO2.
On Pt/NiO catalysts the oxidation states of platinum, Pt 4f7/2 and Pt 4f5/2 were also monitored (Fig. 5.). The as received sample contains Pt0 and Pt2+ states in 3:1 ratio. After reduction of the catalyst at 573 K, the 4f5/2 appeared at 71.1 eV indicating that the platinum is in metallic state45. After careful analyzing of the spectrum, a small shoulder could be detected at 71.9 eV.
This weak shoulder may indicate that a small fraction is in a partially oxidized state probably due to the electronic interaction of Pt with Ni/NiO interface46. The final state effect arising from the small particles size47 probably can be ruled out because the particle sizes of Pt did not change during the reaction and after vacuum treatment according to our HRTEM experiments. Carbon XPS signal was hardly detectable after high temperature evacuation.
TPR spectroscopy was able to detect a small amount of methane formation (Tp = 600 K) when the used catalyst was heated in hydrogen (not shown).
The carbon and oxygen signals during the reaction were identical with that obtained with pure nickel oxide catalyst. Typical O 1s obtained on Pt/NiO in the reaction is shown in Fig. S7/B.
The freshly reduced Pt surface is very active, so CO adsorption always occurs from the background in a certain amount. Therefore, we focus to the spectra obtained under reaction 2
3 4 5 6 7 8 9 10 11 12 13 14 15 16 17 18 19 20 21 22 23 24 25 26 27 28 29 30 31 32 33 34 35 36 37 38 39 40 41 42 43 44 45 46 47 48 49 50 51 52 53 54 55 56 57
conditions (573 and 673 K). It is remarkable that when increasing the reaction temperature, the intensities of lattice oxygen (530.1 eV) and surface oxygen (531.1 eV) slightly decreased due to the further reduction of NiO. Peaks at 537.6 and 536.4 eV corresponds to gas phase CO2 and CO, respectively43. A broad peak between 531 and 535 eV may compose C=O bonded species (probably formaldehyde), adsorbed CO and adsorbed formate and carbonate intermediates (which were identified by DRITS; see below). After evacuation at 673 K, the intensities of gas phase components (CO and CO2) drastically decreased. The intensities of other components decreased only slightly (not shown).
3.5 Infrared spectra during CO2 hydrogenation at elevated temperatures
For catalytic reactions, the exploration of surface species formed during the catalytic
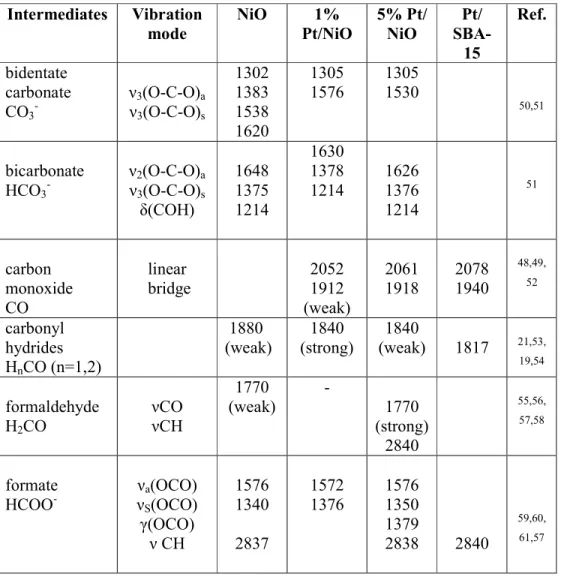
processes plays a decisive role in the understanding of the reaction mechanism. Towards this goal, DRIFT spectra were monitored at increasing reaction temperatures, in the presence of the reactant mixture/products. In all cases the different catalysts were pretreated in oxygen at 573 K followed by reduction in H2 at 573 K. The assignment of IR bands and the detailed description is based on the vibrational fingerprints of relevant surface species, which were reported in previous publications. The IR bands observed during the present work and their origins are collected in Table 1. Note that the denoted wave numbers may vary by ± 5 cm-1 within one data set as a function of temperature.
When the reaction mixture was introduced to the Pt-free SBA-15, no adsorption forms were detected at any temperatures. The DRIFT spectra for 5% 5nm Pt/SBA-15in the CO2:H2
mixture are shown in Fig. S9.The band at 2072 cm-1 started to develop already at 300 K.
From 373 K, the intensity increased and it was present even at high temperature (723 K). This peak is attributed to the formation of adsorbed CO which forms during the catalytic reaction.
This kind of CO bonds to the Pt particles in linear form 48,49. This peak was also detected when the Pt content was 1% in the case of the Pt/SBA-15 catalysts (not shown). In that case the peak corresponding to the linear CO appeared first at 423 K with lower intensity. No other absorption band for adsorbed CO was detected. The linearly adsorbed CO form appeared when CO was introduced to this surface at 300 K, too.
3 4 5 6 7 8 9 10 11 12 13 14 15 16 17 18 19 20 21 22 23 24 25 26 27 28 29 30 31 32 33 34 35 36 37 38 39 40 41 42 43 44 45 46 47 48 49 50 51 52 53 54 55 56
Table 1. Characteristic frequencies (±5 cm-1) forsurface intermediates formed in the CO2 + H2 reaction on pure NiO, Pt/NiO and Pt/SBA-15 catalysts
The evaluation of the low wavenumber region of Pt/SBA-15 is particularly difficult, since the silica-like sample itself has very strong absorptions at ~1940, ~1820-1570 and ~1200-1000 cm-1 52. Although these features should be accounted for by the background spectrum, they might also change as a function of temperature and thus disturb our spectra. We tentatively assign the features observed to this effect. We cannot exclude that a small absorption bands at 1942 and 1825 cm-1 reflect the appearance of bridge bonded CO62. The latter could be
influenced by adsorbed hydrogen. This feature was also detected on Rh/SiO221
. The low- frequency shift in the presence of hydrogen has been attributed to the formation of Rh
carbonyl hydrides53,63,54. It is assumed that the CO in this complex could easily dissociate. It is important to mention that C-H stretching was not observed (Fig. S9.). These phenomena correlate with the catalytic tests, where the SBA-15 supported Pt nanoparticles produced
Intermediates Vibration mode
NiO 1%
Pt/NiO
5% Pt/
NiO
Pt/
SBA- 15
Ref.
bidentate carbonate
CO3- ν3(O-C-O)a
ν3(O-C-O)s
1302 1383 1538 1620
1305 1576
1305 1530
50,51
bicarbonate HCO3-
ν2(O-C-O)a
ν3(O-C-O)s
δ(COH)
1648 1375 1214
1630 1378 1214
1626 1376 1214
51
carbon monoxide CO
linear bridge
2052 1912 (weak)
2061 1918
2078 1940
48,49, 52
carbonyl hydrides HnCO (n=1,2)
1880 (weak)
1840 (strong)
1840
(weak) 1817 21,53,
19,54
formaldehyde H2CO
νCO νCH
1770 (weak)
-
1770 (strong)
2840
55,56, 57,58
formate HCOO-
νa(OCO) νS(OCO) γ(OCO)
ν CH
1576 1340 2837
1572 1376
1576 1350 1379
2838 2840
59,60, 61,57
2 3 4 5 6 7 8 9 10 11 12 13 14 15 16 17 18 19 20 21 22 23 24 25 26 27 28 29 30 31 32 33 34 35 36 37 38 39 40 41 42 43 44 45 46 47 48 49 50 51 52 53 54 55 56 57
mainly CO and almost no other products. At the Pt/SiO2 interfaces, the reverse-water-shift gas (RWSG) reaction resulted in the formation of CO from CO227
.
H2(g) → 2H(a) (1)
CO2(g) → CO2(a)*
(2) CO2(a)*
+ H(a) → HOCO(a)*
(3) HOCO(a)*
+ H(a) → CO(a) + H2O(a) → CO(g) + H2O(g) (4)
Figure 6. DRIFT spectra obtained during linear heating (20 K·min-1) in CO2:H2 mixture (1:4) on NiO (A), 1% Pt/NiO (B) and 5% Pt/NiO (C) catalysts (average Pt particle size is 4.8 nm).
When CO2:H2 mixture was introduced to the pretreated NiO catalyst, a broad band appeared at 1648 cm-1 and two narrow ones at 1375 and 1209 cm-1 at 300 K, as represented in Fig. 6/A.
These bands correspond to the bicarbonate (HCO3-
) species and can be assigned to ν2(OCO)a, ν3(OCO)s and δ4(COH), respectively51. The adsorption of CO2 on NiO gives two adsorption bands in the IR spectrum at 1620 and 1383 cm-1 (not shown), which are assigned to carbonate ion on the oxide50. Carbonate structures may be formed via coordination of a bent CO2δ-
towards an oxygen atom64.
When the sample was heated to 473 K, two peaks developed at 1576 and 1340 cm-1. These bands can be assigned to the formation of formate species. These species were observed on 3
4 5 6 7 8 9 10 11 12 13 14 15 16 17 18 19 20 21 22 23 24 25 26 27 28 29 30 31 32 33 34 35 36 37 38 39 40 41 42 43 44 45 46 47 48 49 50 51 52 53 54 55 56
Rh/MgO catalyst during CO2:H2 adsorption19, and after adsorption of HCOOH on TiO2
powder59,60 and TiO2 (110)61 due to asymmetric and symmetric stretch of (OCO). The
corresponding ν(CH) vibration is detected at 2837 cm-1 from 473 K (Fig. S9/A.). Around 473 K a weak band appeared at 1875-1900 cm-1 probably due hydrogen perturbed CO.
When the sample was further heated (573-673 K), the intensity of C-H stretching vibrational features decreased. Two peaks remained or developed at 1576 and 1302 cm-1, very probably due to asymmetric and symmetric bidentate carbonates (ν3(OCO)a and ν3(OCO)s). A broad, weak peak at around 1770 cm-1 is detectable as C=O containing species (H2CO). Also a weak absorption band is detectable at 1918 cm-1 due to hydrogen perturbed CO, which is located on metallic Ni. From 573 K a sharp peak for gas phase CH4 was detected indicating that the reaction between CO2 and H2 is occurring (Fig. S10/A.).
When 4.8 nm Pt nanoparticles were anchored onto NiO at different content, new spectral features were observed. The bicarbonate-formate-bidentate carbonate surface reaction
sequence remained in the 300-623 K temperature range. In the case of the 1% Pt/NiO catalyst, peaks at 1576, 1378 cm-1 may represent the formate in νassym (OCO) and νs(OCO) modes, respectively65 (Fig. 6/B.). As new feature, linearly adsorbed CO at 2046-2061 cm-1 appeared already at room temperature. Small intensity bridge bonded CO showed up at 1915-1918 and 1840 cm-1. The latter species is presumably CO perturbed by adsorbed hydrogen.
It is clear that the Pt adatom catalyzes the transformation of bicarbonate to formate; peak at
~1630 cm-1 (bicarbonate) is hardly detectable at 373 K in the case of 5% Pt/NiO sample (Fig. 6/C.). The corresponding ν(CH) vibration at 2837-40 cm-1 is detectable already at 323- 373 K (Fig. S/10.). The detection of a strong CO signal indicates that the Pt is an active center for the dissociation of CO2 in the presence of hydrogen. Without hydrogen the formation of adsorbed CO was not observed. The appearance of gas phase CH4 in FTIR spectra above 473 K demonstrates that a catalytic reaction occurs between CO2 and hydrogen. The bands for adsorbed CO and CH and for gas phase methane (Fig. S10/B., S10/C.) appeared at higher temperature at low (1%) Pt content. Independently from the Pt content, an IR band was observed at 1840 cm-1, which was probably due to CO perturbed by hydrogen: so-called carbonyl hydrides21,54. BOC-MP calculations have also shown that the dissociation of HnCO, where n=1,2 or 3 is energetically more favorable than the direct dissociation of CO on Pd and Pt66. Although there is significant evidence to support the idea that C-O bond cleavage is hydrogen assisted, no direct evidence for the existence of HnCO surface species during the hydrogenation of CO or CO2 has been reported. Williams et al.67 have proposed a mechanism 2
3 4 5 6 7 8 9 10 11 12 13 14 15 16 17 18 19 20 21 22 23 24 25 26 27 28 29 30 31 32 33 34 35 36 37 38 39 40 41 42 43 44 45 46 47 48 49 50 51 52 53 54 55 56 57
for CO2 hydrogenation to methane over Rh based on the observations reported above in which H2CO(a) –like species is involved. Its decomposition leads to CH2(a) which either forms carbon or is hydrogenated to CH4.
A significantly strong absorption feature at 1770 cm-1 is detected at 5% Pt content (Fig. 6/C.).
This band corresponds to the C=O double bond, thus it can be assigned to formaldehyde (νCO). This peak was observed in gas phase formaldehyde68, after adsorption of
formaldehyde on NiO55, on TiO2-supported Rh56 and Pt and Au catalysts57. It is evident that the formation of formyl/formaldehyde species is catalyzed by Pt particles in CO2:H2 reaction, because it was difficult to detect on clean NiO. As this intermediate is still present even at high temperature (673 K), we may suppose that its formation rate is higher than its
decomposition rate. Very probably the formyl (H2CO) species could decompose to the final products. Mainly at 5% Pt content, we have two important IR peaks, that can both be assigned to hydrogen. It is perturbated CO: one is H2CO(a) – like species or carbonyl hydrides at 1840 cm-1, the other is of formyl/formaldehyde, at 1770 cm-1 which contains C=O double bond.
Both of them could be important in the CO2:H2 reaction. It is clear that the carbonyl hydrides are more reactive. νCH2 was detected even at 323-373 K indicating that in this case (compare to the Pt-free case) some hydrocarbon fragment, very probably formate is formed (Fig.
S10/B., S10/C.). Gas phase methane appeared already from 523 K. The H2CO(a) is rather stable, its contribution to the gas phase products is less than the hydrogen perturbed CO.
The question arises: what is the source of the formation of formyl/formaldehyde detected on Pt/NiO? Recently it was found that formaldehyde forms in the interaction of HCOOH with Pt supported TiO258
. In this interaction it was supposed that both vacancies and Pt sites catalyze formaldehyde formation. It is important that the formate is produced on pure NiO, and the hydrogen is dissociating on Pt nanoparticles. We may assume that hydrogen atoms migrate to the metal-support interface and react with formate there to form formyl/formaldehyde. As adsorbed formyl was not detectable at low Pt content, we suppose that large amount of atomic hydrogen is necessary for this reaction. Though the dissociation of hydrogen takes place at 300 K, formyl forms from 423 K at 5% Pt content, indicating that the hydrogen spillover from the metal to NiO or its reaction with formate is an activated process. This type of formyl could then decompose to CO at higher temperatures57.
Taking into account the product distribution in the CO2:H2 reaction and the observed intermediates on NiO and Pt/NiO catalysts we may assume that the reversed water gas shift mechanism (RWGS) to form CO is also valid in a certain extent (steps 1-4). The methane 3
4 5 6 7 8 9 10 11 12 13 14 15 16 17 18 19 20 21 22 23 24 25 26 27 28 29 30 31 32 33 34 35 36 37 38 39 40 41 42 43 44 45 46 47 48 49 50 51 52 53 54 55 56
formation can be deduced through formation of surface HnCO (n= 1,2,3) which was offered on supported Pt21 and Rh18 catalysts:
CO(a) + nH(a) → Hn(CO)(a) (5)
Hn(CO)(a) → CHn (a) + O(a) (6) O(a) + 2H(a) → OH(a) + H(a) → H2O(g) (7)
CHn (a) + H(a) → CH4(g) (8)
The reaction steps 5-8 could be dominant at 1% Pt content. The CHn species may recombine a small extent to form ethane.
On Pt-free NiO, the formate pathways come to the front as formate is the main surface intermediate observed in DRIFTS:
CO2(a)*
+ H(a) → HCOO(a) (9)
HCOO(a) → CO(a) + OH(a) → CO(g) + H2O(g) (10) The formate intermediate may produce methane, too19:
HCOO(a) → H2COH(a) → H2C(a) + OH(a) (11)
H2C(a) + 2H(a) → CH4(g) (12) When the Pt content is high, the formate may convert to formaldehyde as was observed in our DRIFTS experiments and published on Pt/SiO2 and Pt/TiO221,44
:
HCOO(a) + Pt → H2CO(a) + Pt-O (13)
The formaldehyde may decompose to CO44 at high temperature but may forms CH421
, too69: H2CO(a) → CO(g) + H2(g) (14) H2CO(a) + 2H(a) → CH3(a) + OH(a) (15)
CH3(a) + H(a) → CH4 (16)
In summary, from the XPS measurements we may conclude that the CO2 hydrogenation at 573 K and 673 K takes place on the surface and interface of a complex NiOx/Ni/PtOx/Pt 2
3 4 5 6 7 8 9 10 11 12 13 14 15 16 17 18 19 20 21 22 23 24 25 26 27 28 29 30 31 32 33 34 35 36 37 38 39 40 41 42 43 44 45 46 47 48 49 50 51 52 53 54 55 56 57
catalyst. Pt boosts oxygen migration to the surface as well as changes the reaction mechanism and activity, resulting in a high performance CH4 producing catalyst with 1% 4.8 nm Pt nanoparticles on the surface of the mesoporous nickel oxide support (Fig. 7A).
In the case of pure nickel-oxide during CO2 hydrogenation over 673 K, small amounts of formaldehyde and hydrogen perturbated CO are present at the surface to form mostly methane observed by DRIFTS studies. In the case of the most active and methane selective 1% Pt/NiO sample, formaldehyde species are absent but a significant amount of hydrogen perturbated CO is present. The number of perturbing hydrogen atoms are even higher (2-3) compared to pure NiO catalyst (1-2). These results show, that the presence of Pt helps to produce the high numbered hydrogen perturbated CO complex, which in turn is producing methane in the CO2
hydrogenation reaction. The formation of formaldehyde does not help methane formation process (Fig. 7/B.).
Figure 7. (A) Schematic view of a presence of complex NiOx/Ni/PtOx/Pt catalyst, where Pt boosts oxygen migration to the surface; (B) Schematic view of the proposed mechanism of CO2 hydrogenation over hydrogen perturbated CO, where Pt flood the surface with hydrogen to enhance the CH4 formation.
CONCLUSION
Here in this project, size controlled Pt nanoparticles with 4.8 nm diameter were anchored onto the surface of 3D mesoporous nickel-oxide support. Pt/NiO, pristine NiO as well as Pt
supported on SBA-15 catalysts were tested in CO2 hydrogenation reaction in the gas phase in a flow reactor at 473 – 673 K as well as investigated with Temperature Programmed
Reduction (TPR). The catalysts were also monitored under reaction conditions with Near 3
4 5 6 7 8 9 10 11 12 13 14 15 16 17 18 19 20 21 22 23 24 25 26 27 28 29 30 31 32 33 34 35 36 37 38 39 40 41 42 43 44 45 46 47 48 49 50 51 52 53 54 55 56
Ambient Pressure X-ray Photoelectron Spectroscopy (NAP-XPS) as well as in-situ Diffuse Reflectance Infrared Fourier Transform Spectroscopy (DRIFTS).
1 % Pt/NiO was ~20 times and ~1.5 times more active at 493 K compared to Pt/SBA-15 and NiO catalysts, respectively. However, the Pt-free NiO support has an activity of 120%
compared to Pt/NiO catalysts at 673 K. In the case of 1% Pt/SBA-15 catalyst, selectivity towards methane was 13 %, while it was 90% and 98% for NiO and 1% Pt/NiO at 673 K, respectively.
In the case of pure NiO, we found that the surface of the support was mainly covered by elemental Ni under reaction conditions, where the Ni/NiOx system is responsible for the high activity of Pt-free catalyst. In the case of Pt/NiO, Pt improves the reduction of NiOx towards metallic Ni. We found oxidized Pt at 673 K with XPS at 5% Pt content showing the presence of a Pt/PtOx/Ni/NiOx mixed phase, where the different interfaces may be responsible for the high activity and selectivity towards methane.
In the case of pure NiO under reaction condition, formaldehyde as well as a small amount hydrogen perturbated CO was detected. However, in the case of 1 % Pt/NiO, significant amounts of HnCO species were presented on the surface showing that the reaction towards methane goes through the dissociation of HnCO on the surface. The formyl/formaldehyde form could be a rather inactive intermediate due to its high thermal stability.
ACKNOWLEDGEMENT
This paper was supported by the János Bolyai Research Scholarship of the Hungarian
Academy of Sciences as well as the Hungarian Research Development and Innovation Office through grants NKFIH OTKA PD 120877 of AS. ÁK, GH and KZ are grateful for the fund of NKFIH (OTKA) K112531 & NN110676, PD 115769 and K120115, respectively. This collaborative research was partially supported by the “Széchenyi 2020” program in the framework of GINOP-2.3.2-15-2016-00013 “Intelligent materials based on functional
surfaces – from syntheses to applications” project. NAP-XPS measurements were governed in in Prage, Charles University under the program of Ceric-Eric Consortium.
2 3 4 5 6 7 8 9 10 11 12 13 14 15 16 17 18 19 20 21 22 23 24 25 26 27 28 29 30 31 32 33 34 35 36 37 38 39 40 41 42 43 44 45 46 47 48 49 50 51 52 53 54 55 56 57
ASSOCIATED CONTENT Supporting Information.
Detailed experimental procedures and supplementary figures and table. This material is available free of charge via the Internet at http://pubs.acs.org.
AUTHOR INFORMATION Corresponding Author
* sapia@chem.u-szeged.hu Author Contributions
‡These authors contributed equally.
REFERENCES
(1) Chiang, J. H.; Hopper, J. R. Kinetics of the Hydrogenation of Carbon Dioxide over Supported Nickel. Ind. Eng. Chem. Prod. Res. Dev. 1983, 22, 225–228.
(2) Vannice, M. A. The Catalytic Synthesis of Hydrocarbons from H2/CO Mixtures over the Group VIII Metals II. The Kinetics of the Methanation Reaction over Supported Metals. J. Catal. 1975, 37 (3), 462–473.
(3) Schlutter, M.; Götz, M.; Lefebre, J.; Prabhakaran, P.; Schneider, J.; Rönsch, S.;
Matthischkle, S.; Bajorh, S. Review on Methanation – From Fundamentals to Current Projects. Fuel 2015, 166, 276–296.
(4) Li, C.-S.; Melaet, G.; Ralston, W. T.; An, K.; Brooks, C.; Ye, Y.; Liu, Y.-S.; Zhu, J.;
Guo, J.; Alayoglu, S.; et al. High-Performance Hybrid Oxide Catalyst of Manganese and Cobalt for Low-Pressure Methanol Synthesis. Nat. Commun. 2015, 6, 6538.
(5) Giesbrecht, P. K.; Herbert, D. E. Electrochemical Reduction of Carbon Dioxide to Methanol in the Presence of Benzannulated Dihydropyridine Additives
Electrochemical Reduction of Carbon Dioxide to Methanol in the Presence of Benzannulated Dihydropyridine Additives. ACS Energy Lett. 2017.
(6) Boston, D. J.; Xu, C.; Armstrong, D. W.; Macdonnell, F. M. Photochemical Reduction of Carbon Dioxide to Methanol and Formate in a Homogeneous System with
3 4 5 6 7 8 9 10 11 12 13 14 15 16 17 18 19 20 21 22 23 24 25 26 27 28 29 30 31 32 33 34 35 36 37 38 39 40 41 42 43 44 45 46 47 48 49 50 51 52 53 54 55 56
Pyridinium Catalysts. J. Am. Chem. Soc. 2013, 135, 16252–16255.
(7) Sápi, A.; Varga, A.; Samu, G. F.; Dobó, D. G.; Juhász, K. L.; Takacs, B.; Varga, E.;
Kukovecz, A.; Kónya, Z.; Janáky, C. Photoelectrochemistry by Design: Tailoring the Nanoscale Structure of Pt/NiO Composites Leads to Enhanced Photoelectrochemical Hydrogen Evolution Performance. J. Phys. Chem. C 2017, 121, 12148–12158.
(8) Halasi, G.; Gazsi, A.; Bánsági, T.; Solymosi, F. Applied Catalysis A : General Catalytic and Photocatalytic Reactions of H2 + CO2 on Supported Au Catalysts.
"Applied Catal. A, Gen. 2015, 506, 85–90.
(9) Frontera, P.; Macario, A.; Ferraro, M.; Antonucci, P. Supported Catalysts for CO2
Methanation: A Review. Catalysts 2017, 7 (2), 59.
(10) F. Solymosi, A. E. Hydrogenation of CO2 to CH4 over Alumina-Supported Noble Metals. J. Mol. Catal. A Chem. 1980, No. 8, 471.
(11) Jadhav, S. G.; Vaidya, P. D.; Bhanage, B. M.; Joshi, J. B. Catalytic Carbon Dioxide Hydrogenation to Methanol: A Review of Recent Studies. Chem. Eng. Res. Des. 2014, 92, 2557–2567.
(12) Takashi, I.; Tokio, I. Hydrogenation of Carbon Dioxide and Carbon Monoxide over Supported Platinum Catalysts. J. Chem. Soc. Faraday Transit. 1986, 82, 1681–1686.
(13) An, K.; Alayoglu, S.; Musselwhite, N.; Plamthottam, S.; Melaet, G.; Lindeman, A. E.;
Somorjai, G. A. Enhanced CO Oxidation Rates at the Interface of Mesoporous Oxides and Pt Nanoparticles. J. Am. Chem. Soc. 2013, 135 (44), 16689–16696.
(14) Patil, U. V.; Ramgir, N. S.; Karmakar, N.; Bhogale, A.; Debnath, A. K.; Aswal, D. K.;
Gupta, S. K.; Kothari, D. C. CO2 Hydrogenation Studies on Co and CoPt Bimetallic Nanoparticles under Reaction Conditions Using TEM, XPS and NEXAFS. Nano Lett.
2014, 136 (May), 4792–4796.
(15) Zheng, F.; Alayoglu, S.; Guo, J.; Pushkarev, V.; Li, Y.; Glans, P.; Chen, J.; Somorjai, G. In-Situ X-Ray Absorption Study of Evolution of Oxidation States and Structure of Cobalt in Co and CoPt Bimetallic Nanoparticles (4 Nm) under Reducing (H2) and Oxidizing (O2) Environments. Nano Lett. 2011, 11, 847–853.
(16) Sapi, A.; Thompson, C.; Wang, H.; Michalak, W. D.; Ralston, W. T.; Alayoglu, S.;
Somorjai, G. A. Recovery of Pt Surfaces for Ethylene Hydrogenation-Based Active 2
3 4 5 6 7 8 9 10 11 12 13 14 15 16 17 18 19 20 21 22 23 24 25 26 27 28 29 30 31 32 33 34 35 36 37 38 39 40 41 42 43 44 45 46 47 48 49 50 51 52 53 54 55 56 57
Site Determination. Catal. Letters 2014, 144 (7), 1151–1158.
(17) Alayoglu, S.; Krier, J. M.; Michalak, W. D.; Zhu, Z.; Gross, E.; Somorjai, G. A. In Situ Surface and Reaction Probe Studies with Model Nanoparticle Catalysts. ACS Catal.
2012, 2, 2250–2258.
(18) Khachatur, M.; Manukyan, V.; Avetisyan, A. g.; Shuck, C.; Chatilyan, H. A.;
Rouvimov, S.; Kharatyan, S. L.; Mukasyan, A. S. Nickel Oxide Reduction by
Hydrogen: Kinetics and Structural Transformations. J. Phys. Chem. C 2015, 119 (28), 16131–16138.
(19) Erdohelyi, A., Solymosi F., B. T. Infrared Study of the Surface Interaction between H2
and CO2 over Rhodium on Various Supports. J. Chem. Soc. Farad. Trans. 1981, 77, 2645–2657.
(20) M. Tóth, J. Kiss, A. Oszkó, G. Pótári, B. L.; Erdőhelyi, A. Hydrogenation of Carbon Dioxide on Rh, Au and Au–Rh Bimetallic Clusters Supported on Titanate Nanotubes, Nanowires and TiO2. Top. Catal. 2012, 55, 747–756.
(21) Fisher, I. A.; Bell, A. T. A Comparative Study of CO and CO2 Hydrogenation over Rh/SiO2. J. Catal. 1996, 162 (259), 54–65.
(22) Gómez-Pérez, J.; Dobó, D. G.; Juhász, K. L.; Sápi, A.; Haspel, H.; Kukovecz, Á.;
Kónya, Z. Photoelectrical Response of Mesoporous Nickel Oxide Decorated with Size Controlled Platinum Nanoparticles under Argon and Oxygen Gas. Catal. Today 2016, 1–7.
(23) Borodko, Y.; Habas, S. E.; Koebel, M.; Yang, P.; Frei, H.; Somorjai, G. A. Probing the Interaction of Poly(vinylpyrrolidone) with Platinum Nanocrystals by UV - Raman and FTIR. J. Phys. Chem. B 2006, 110, 23052–23059.
(24) Borodko, Y.; Humphrey, S. M.; Tilley, T. D.; Frei, H.; Somorjai, G. A. Charge- Transfer Interaction of Poly(vinylpyrrolidone) with Platinum and Rhodium Nanoparticles. J. Phys. Chem. C 2007, No. 111, 6288–6295.
(25) Luo, I.; Monai, M.; Wang, C.; Lee, J. D.; Duchoň, T.; Dvořák, F.; Matolín, V.; Murray, C. B.; Fornasiero, P.; Gorte, R. J. Unraveling the Surface State and Composition of Highly Selective Nanocrystalline Ni–Cu Alloy Catalysts for Hydrodeoxygenation of HMF. Catal. Sci. Technol. 2017, 8, 1735–1743.
3 4 5 6 7 8 9 10 11 12 13 14 15 16 17 18 19 20 21 22 23 24 25 26 27 28 29 30 31 32 33 34 35 36 37 38 39 40 41 42 43 44 45 46 47 48 49 50 51 52 53 54 55 56