Contents lists available atScienceDirect
Molecular Catalysis
journal homepage: www.elsevier.com/locate/mcat
Phosphorus-loaded alumina supported nickel catalysts for CO
2hydrogenation: Ni
2P/Ni
5P
12drives activity
T. Rajkumar
a, András Sápi
a,b,*, Marietta Ábel
a, Gyula Halasi
a, János Kiss
a,c, Juan Fernando Gómez-Pérez
a, Henrik Bali
a, Ákos Kukovecz
a, Zoltán Kónya
a,caUniversity of Szeged, Interdisciplinary Excellence Centre, Department of Applied and Environmental Chemistry, H-6720, Rerrich Béla tér 1, Szeged, Hungary
bInstitute of Environmental and Technological Sciences, University of Szeged, H-6720, Szeged, Hungary
cMTA-SZTE Reaction Kinetics and Surface Chemistry Research Group, University of Szeged, H-6720, Szeged, Hungary
A R T I C L E I N F O Keywords:
CO2hydrogenation H2-TPR Phosphorus-loaded Nickel-based catalyst XPS
A B S T R A C T
A series of 5 wt% NiO-xP-Al2O3with different phosphorus loading contents (x = 0, 5, 15 and 20 wt%) were prepared by a modified sol-gel method. A significant promotional effect of phosphorus on NiO-Al2O3in CO2
hydrogenation is observed. All the catalysts reach the highest conversion at 600 °C with 61.54 %, 62.89 %, 63.88
% and 66.13 % respectively for 5 wt% NiO-Al2O3, 5 wt% NiO-5P-Al2O3, 5 wt% NiO-15P-Al2O3and 5 wt% NiO- 20P-Al2O3 catalysts. Ni/NiO/Ni2P/Ni5P12/AlPO4interfacial species were detected on the surface as active species on the used catalysts by X-ray photoelectron spectroscopy. The formation ratio of the metal-phosphide is relatively low ∼3−5 %, and this atomic concentration is decreasing with the rising of the phosphate content.
However, the nickel enrichment in the surface layer presumable in Ni2P/Ni5P12form is very likely according to the P 2p spectra and the authors assume that could be responsible for the enhanced catalytic activity.
1. Introduction
In recent years, CO2hydrogenation is the most important process because it not only reduces global warming but also produces value- added products [1–5]. The hydrogen obtained from water electrolysis using renewable and sustainable energy sources such as solar, wind, geothermal, biomass etc. can be used to hydrogenate CO2[6]. A variety of chemicals such as CO, CH4, CH3OH etc. can be obtained through catalytic hydrogenation of CO2[7–9]. CO is a valuable precursor mo- lecule that can be used as a raw material for the production of olefins, methyl alcohols and liquid hydrocarbons for the Fischer-Tropsch synthesis [10,11]. Various precious metals including Au, Pt, Pd, Rh and Ru [12–16] and non-precious metals Ni, Fe and Cu [17–19] loaded on various supports have been reported for the production of CO.
Several metal catalyst have been reported to be active in CO2me- thanation reaction including noble metal catalysts such as Pd, Ru and Pt [20–22] and non-noble metal catalysts such as Cu, Ni and Co [19,23,24] loaded on various supports such as Al2O3, SiO2, TiO2, CeO2
and ZrO2[25–29]. NiO have been extensively investigated in various fields as catalysts [30,31], sensors [32–34] as well as batteries [35,36]
due to their high catalytic activity, low cost and low toxicity. γ-Alumina is widely used as a catalyst [37–39], adsorbent [40] and catalyst
support [41] due its thermal, chemical and mechanical stabilities.
Compared with individual performances of NiO and Al2O3, NiO-Al2O3
composites are more efficient and have been used as catalysts [42–45], batteries [46,47], sensors [48,49] and adsorbents [50,51]. The non- metal phosphorus element has been proven to serve as a structure stabilizer of alumina [52–54]. Meanwhile, the incorporation of phos- phorus into alumina brings about the decoration of hydroxyl groups on the surface of alumina accompanied by the formation of PeOH groups.
The dehydroxylation between PeOH groups results in the formation of P]O groups, which will rehydrate into PeOH groups in the presence of water and consequently reduce the adsorption of water on the ad- sorption sites of the catalysts, hence enabling the improvement of the hydrothermal stability for the NiO/Al2O3catalysts. Moreover, the re- ducibility of metal-alumina have been found to be increased after doping phosphorus [55].
In the present work, a series of 5 wt% NiO-xP-Al2O3(x = 0, 5, 15, 20 wt%) catalysts have been prepared by a modified sol-gel method and investigated their performances in CO2 hydrogenation reaction. The results show that addition of phosphorus can significantly increase the catalytic activity. Compared with phosphorus unloaded 5 wt% NiO- Al2O3 catalyst, phosphorus loaded 5 wt% NiO-xP-Al2O3catalysts ex- hibit superior performance.
https://doi.org/10.1016/j.mcat.2020.111113
Received 7 May 2020; Received in revised form 30 June 2020; Accepted 4 July 2020
⁎Corresponding author at: University of Szeged, Interdisciplinary Excellence Centre, Department of Applied and Environmental Chemistry, H-6720, Rerrich Béla tér 1, Szeged, Hungary.
E-mail address:sapia@chem.u-szeged.hu(A. Sápi).
2468-8231/ © 2020 The Author(s). Published by Elsevier B.V. This is an open access article under the CC BY license (http://creativecommons.org/licenses/BY/4.0/).
T
2. Experimental 2.1. Chemicals
Nickel (II) nitrate hexahydrate (Ni(NO3)2.6H2O, ≥ 98.5 %) and pluronic P-123 (average Mn ∼5800) were purchased from Aldrich.
Ammonium dihydrogen phosphate was purchased from Reanal.
Aluminium isopropoxide (≥98 %) and acetic acid (99.7 %) were pur- chased from Sigma-Aldrich. Ethanol absolute (99.96 %) was purchased from VWR chemicals. Isopropanol (99.99 %) was purchased from molar chemicals. All chemicals were used as received without any further purification.
2.2. Synthesis of catalyst support
P-loaded alumina was prepared via a modified sol-gel method. 1.50 g P123 (Mav= 5800) was dissolved in the mixed solution of 30 mL absolute ethanol, 10 mL isopropanol and 0.18 mL acetic acid at ambient temperature. Then, a required amount of ammonium dihydrogen phosphate and 0.015 mol of aluminium isopropoxide were introduced into the above solution under vigorous stirring for 4 h. The product was dried overnight at 80 °C and calcined in air at 500 °C for 4 h and then at 1000 °C for 1 h.
2.3. Synthesis of catalysts
The as-obtained P-loaded Al2O3support was loaded with 5 wt% NiO by the incipient wetness impregnation method using Ni(NO3)2.6H2O aqueous solution as metal precursors. The product was dried overnight at 80 °C and calcined in air at 500 °C for 1 h. The final sample was marked as 5 wt% NiO-xP-Al2O3(x = 0, 5, 15, 20 wt%).
2.4. Characterization of the catalysts
2.4.1. N2adsorption-desorption isotherm measurements
The specific surface area (BET method), the pore size distribution and the total pore volume were determined by the BJH method using a Quantachrome NOVA 2200 gas sorption analyser by N2gas adsorption/
desorption at −196 °C. Before the measurements, the samples were pre- treated in a vacuum at 200 °C for 2 h.
2.4.2. Powder X-ray diffraction (XRD)
XRD studies of all samples were performed on a Rigaku MiniFlex II instrument with a Ni-filtered Cu-Kα source in the range of 2θ = 20−80°.
2.4.3. Transmission Electron Microscopy (TEM)
Imaging of the all the samples were carried out using a FEI TECNAI G2 20 X-Twin high-resolution transmission electron microscope (equipped with electron diffraction) operating at an accelerating vol- tage of 200 kV. The samples were drop-cast onto carbon film coated copper grids from ethanol suspension.
2.4.4. H2-Temperature programmed reduction (H2-TPR)
The temperature-programmed reduction (TPR) was carried out in a BELCAT-A analyser using a reactor (quartz tube with 9 mm outer dia- meter) that was externally heated. Before the measurements, the 50 mg of catalyst was pre-treated in oxygen at 400 °C for 30 min and in N2at 400 °C for 15 min. Thereafter, the sample was cooled in flowing N2to 50 °C. The oxidized sample was flushed with N2containing 10 % H2, the reactor was heated linearly at a rate of 5 °C/min from 50 °C to 500 °C and the H2 consumption was detected by a thermal conductivity
detector (TCD).
2.4.5. X-ray photoelectron spectra
The chemical states (and the atomic ratio of the elements) were investigated by X-ray photoelectron spectroscopy (XPS). The SPECS instrument was equipped with a Phoibos150 MCD-9 analyser. The Al Kα x-ray source was operated at 14 kV and 10.8 mA (150 W) and the analyser was used in FAT mode with a pass energy of 20 eV in the case of high-resolution spectra. CasaXPS software was used for data eva- luation. The binding energy was set to the adventitious carbon C1 s peak is at 284.8 eV. The peaks of the P2p were fitted with single due to closely spaced spin-orbit coupling. Specs FG 15/40 flood gun was op- erated during the accumulation at 0.6 V and 0.3 mA to the prevent the charging of the surface of the sample.
2.4.6. Hydrogenation of carbon-dioxide in a continuous flow reactor Before the catalytic experiments in a continuous-flow reactor the as- received catalysts were oxidized in the O2atmosphere at 300 °C for 30 min to remove the surface contaminants and thereafter were reduced in H2at 300 °C for 60 min. Catalytic reactions were carried out at atmo- spheric pressure in a fixed-bed continuous-flow reactor (200 mm long with 8 mm i.d.), which was heated externally. The dead volume of the reactor was filled with quartz beads. The operating temperature was controlled by a thermocouple placed inside the oven close to the reactor wall, to assure precise temperature measurement. For catalytic studies, small fragments (about 1 mm) of slightly compressed pellets were used.
Typically, the reactor filling contained 150 mg of catalyst. In the re- acting gas mixture, the CO2: H2molar ratio was 1:4, if not denoted otherwise. The CO2: H2mixture was fed with the help of mass flow controllers (Aalborg), the total flow rate was 50 mL/min. The reacting gas mixture flow entered and left the reactor through an externally heated tube in order to avoid condensation. The analysis of the products and reactants was performed with an Agilent 6890 N gas chromato- graph using HP-PLOTQ column. The gases were detected
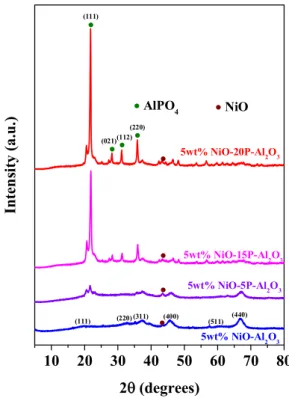
Fig. 1.XRD pattern of 5 wt% NiO-xP-Al2O3(x = 0, 5, 15, 20) catalysts.
simultaneously by thermal conductivity (TC) and flame ionization (FI) detectors. The CO2was transformed by a methanizer to methane and it was also analyzed by FID. CO2conversion was calculated on a carbon atom basis, i.e.
= ×
CO conversion(%) CO CO
CO 100%
2 2 in 2 out
2 in
CH4selectivity and CO selectivity were calculated as following
= ×
CH selectivity(%) CH
CO CO 100%
4 4 out
2 in 2 out
= ×
CO selectivity(%) CO
CO outCO 100%
2 in 2 out
whereCO2 inandCO2 out represent theCO2 concentration in the inlet and outlet respectively, and CH4 outand COoutrepresent the amount of formed CH4 and CO, respectively.
3. Results and discussion
3.1. Basic characterization of the catalysts
Fig. 1presented the XRD pattern of all the catalysts. The diffraction peaks observed at 2θ = 21.9°, 28.2°, 31.1° and 35.8° are assigned to diffraction planes (111), (021), (112) and (220) of AlPO4-tridymite crystal structure (JCPDS No. 11-0500) with no impurity phases [56].
The small peak at 20.6° may be due to the presence of structural defects [57]. The peak intensity increased with phosphorous content, sug- gesting the growth of AlPO4-tridymite crystal phase. All the phosphorus loaded samples exhibited no characteristic diffraction peaks related with α-Al2O3and NiO phases. 5 wt% NiO-Al2O3catalyst exhibited main peaks at 2θ of 19.8°, 32.7°, 37.3°, 39.5°, 45.6°, 60.6°, 66.9° are assigned to diffraction planes (111), (220), (311), (222), (400), (511) and (440) of cubic γ-Al2O3crystal phase (JCPDS No. 29-0063) [58]. There is no obvious signal of NiO phase detected in the XRD patterns of 5 wt% NiO- Al2O3catalyst except a low intense peak at 2θ = 43.4° as a result of overlapping with the γ-Al2O3peaks and low NiO content.
The BET surface area, pore volume and pore size of the catalysts were summarized inTable 1. All the catalysts showed type H3 hyster- esis loop indicating the presence of slit shaped pores. The pore size distribution reveals the existence of mesopores in the range 2–9 nm. It is clear that the introduction of phosphorus into the 5 wt% NiO-Al2O3
results in considerable decrease in the surface area and pore volume with 22.67 m2/g and 0.06 cm3/g respectively for 5 wt% NiO-20P-Al2O3
in comparison with 100.52 m2/g and 0.26 cm3/g for 5 wt% NiO-Al2O3. This can be attributed to the blocking of pores of 5 wt% NiO-Al2O3after phosphorus loading.
Table 1
Textural parameters of the catalysts.
Samples BET surface area (m2/g) Pore volume (cm3/g) Average pore size (nm)
5 wt% NiO-Al2O3 100.52 0.26 4.19
5 wt% NiO-5P-Al2O3 53.91 0.10 1.67
5 wt% NiO-15P-Al2O3 39.13 0.09 1.81
5 wt% NiO-20P-Al2O3 22.67 0.06 4.92
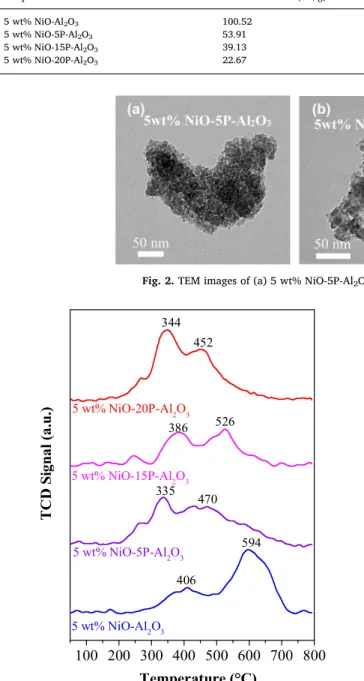
Fig. 2.TEM images of (a) 5 wt% NiO-5P-Al2O3(b) 5 wt% NiO-15P-Al2O3(c) 5 wt% NiO-20P-Al2O3.
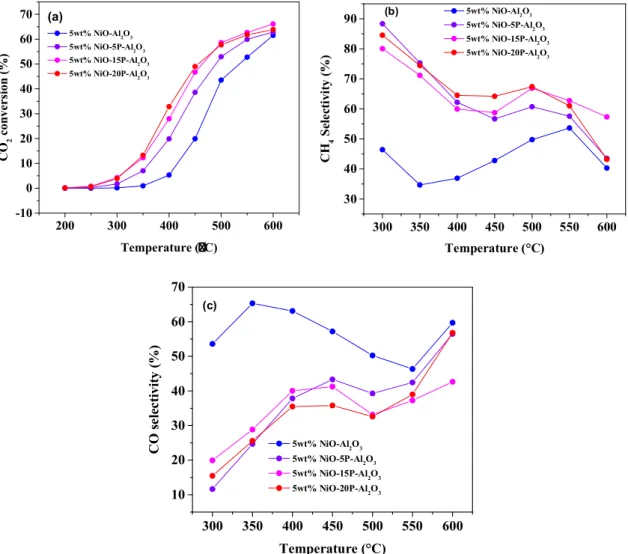
Fig. 3.H2-TPR profile of 5 wt% NiO-xP-Al2O3(x = 0, 5, 15, 20) catalysts.
Table 2
H2temperature-programmed reduction data for the catalysts.
Catalysts H2-TPR
Peak positions (°C) Total H2consumption (mmol g−1) 5 wt% NiO-Al2O3 406, 594 0.827
5 wt% NiO-5P-Al2O3 335, 470 0.838 5 wt% NiO-15P-Al2O3 386, 526 0.764 5 wt% NiO-20P-Al2O3 344, 452 0.952
The morphology and particle size of some of the catalytically active catalysts were examined by TEM measurements and shown inFig. 2. All the catalysts show nanoobjectives with porous structures with a building blocks of spherical shaped morphology with the size of
∼2−15 nm.
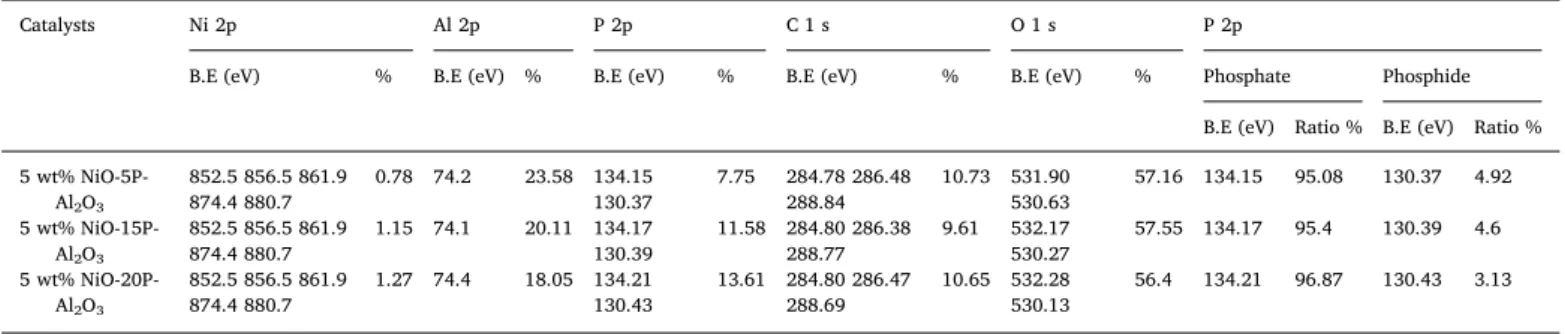
The reducibility of the catalysts was studied by the H2-TPR tech- nique and the results are shown inFig. 3. 5 wt% NiO-Al2O3catalyst exhibited two reduction peaks. The low temperature peak at 406 °C was attributed to reduction of NiO not bound with Al2O3 and high tem- perature peak at 594 °C to the reduction of NiO that weakly interacted Fig. 4.CO2conversion on 5 wt% NiO-xP-Al2O3(x = 0, 5, 15, 20) catalysts (a), CH4selectivity for CO2hydrogenation on 5 wt% NiO-xP-Al2O3(x = 0, 5, 15, 20) catalysts (b) and CO selectivity for CO2hydrogenation on 5 wt% NiO-xP-Al2O3(x = 0, 5, 15, 20) catalysts (c).
Fig. 5.Arrhenius plot for 5 wt% NiO-xP-Al2O3(x = 0, 5, 15, 20) catalysts (a); Time on stream study over 5 wt% NiO-xP-Al2O3(x = 0, 5, 15, 20) catalysts at 600 °C (b).
with Al2O3[59–62].
When phosphorus was added into the NiO-Al2O3catalyst, there is a shift in reduction peaks of NiO towards lower temperature indicates that the addition of phosphorus facilitates the reduction of NiO. This observation corroborated well according to the previous work reported over Pd/xP-OMA catalyst [63]. The total H2consumptions have been summarized inTable 2.
3.2. Catalytic performance of the Phosphorous-loaded NiO/Al2O3catalysts in CO2hydrogenation reaction
The catalytic performances of all the 5 wt% NiO-xP-Al2O3(x = 0, 5, 15, 20) catalysts were evaluated at atmospheric pressure in the tem- perature range from 200 °C to 600 °C. The CO2conversion is shown in Fig. 4a. CO2 conversion increased with temperature raising from 200−600 °C. All the catalysts reach the highest conversion at 600 °C with 61.54 %, 62.89 %, 63.88 % and 66.13 % respectively for 5 wt%
NiO-Al2O3, 5 wt% NiO-5P-Al2O3, 5 wt% NiO-15P-Al2O3 and 5 wt%
NiO-20P-Al2O3. The CO2conversion decreases in the order 5 wt% NiO- 20P-Al2O3> 5 wt% NiO-15P-Al2O3> 5 wt% NiO-5P-Al2O3> 5 wt%
NiO-Al2O3.
The main products identified during the catalytic reaction were CO and CH4. The CH4and CO selectivity results are shown inFig. 4b and c respectively. CH4selectivity also depends on phosphorus loading, with 5 wt% NiO-xP-Al2O3(x = 5, 15, 20) catalysts forming high CH4than 5 wt% NiO-Al2O3catalyst. The CH4selectivity is high at low temperature and decreases to 64.2 %, 58.8 % and 56.7 % for 5 wt% NiO-20P-Al2O3, 5 wt% NiO-15P-Al2O3and 5 wt% NiO-5P-Al2O3catalysts respectively at 450 °C and then increased and decreased. The CO selectivity first in- creases then decreases and then again increases as the temperature increases. 5 wt% NiO-Al2O3catalyst displayed higher CO selectivity.
Gao et al. reported that, above 450 °C the formation of CO increases as a result of reverse water gas shift reaction while the CH4formation de- creases as a result of exothermic nature of CO2methanation [64].
Fig. 5a shows the Arrhenius plot for CO2hydrogenation over all the 5 wt% NiO-xP-Al2O3(x = 0, 5, 15, 20) catalysts. The apparent acti- vation energies were calculated from the slopes in the temperature Fig. 6.XRD pattern of used 5 wt% NiO-xP-Al2O3(x = 0, 5, 15, 20) catalysts.
Fig. 7.XPS (a) Ni 2p (b) P 2p spectra of 5 wt% NiO-xP-Al2O3(x = 5, 15, 20) catalysts.
range of 350−450 °C resulting in values of 56.3 kJ mol−1for 5 wt%
NiO-Al2O3, 68.3 kJ mol−1for 5 wt% NiO-5P-Al2O3, 49.1 kJ mol−1for 5 wt%NiO-15P-Al2O3and 45.5 kJ mol−1for 5 wt% NiO-20P-Al2O3. The apparent activation energy decreases with increase in phosphorus loading. 5 wt% NiO-20P-Al2O3catalyst had the lowest apparent acti- vation energy and this is in line with the catalytic activity.
Fig. 5b shows the time on stream results of all the catalysts for CO2
hydrogenation at 600 °C. It can be seen that all the catalysts exhibit almost similar stability indicates that phosphorus addition does not improve the stability of the catalysts.
3.3. Characterization of the used catalysts
The used catalysts have been characterized by XRD in order to identify possible structural changes (Fig. 6). Besides NiO and AlPO4
form, the XRD patterns revealed new peaks at 2θ = 44.5°, 51.8° and 76.3° for metallic nickel (JCPDS No. 65-2865) [65]. This metallic nickel is supposed to be formed during the pre-treatment with H2prior to the catalytic reaction and is responsible for H2dissociation during CO2
hydrogenation.
For better understanding of the outstanding activity of phosphorous loaded catalysts, XPS studies were performed on the spent catalysts.
The XPS was measured to study the chemical composition and valence states of the surface of the used 5 wt% NiO-xP-Al2O3(x = 5, 15, 20) catalysts. The core level Ni 2p spectrum is shown inFig. 7a. The peak at binding energy of 856.5 eV is ascribed to Ni 2p3/2and another peak at binding energy of 874.4 eV is ascribed to Ni 2p1/2. The two relatively weak peaks at 861.9 eV and 880.7 eV belong to shakeup satellites in- dicating the presence of NiO [66]. The small shoulder peak at 852.7 eV is ascribed to the presence of metallic nickel [67]. The peak at 74.4 eV is ascribed to the presence of either Al2O3or AlPO4[68]. However, based on the XRD results of the used catalyst, it could be expected as AlPO4.Fig. 7b. shows P 2p XPS spectra. The peak at 134.4 eV is as- cribed to the presence of AlPO4[69]. The small peak at 130.3 eV can be assigned to the Ni2P/Ni5P12arising from the interaction of nickel with phosphorus [70]. This indicates the existence of Ni/NiO/Ni2P/Ni5P12/ AlPO4interfacial species in the catalyst during the reaction and this interfacial species increased with phosphorus loading and can be cor- related with the higher catalytic activity.
The formation ratio of the metal-phosphide is relatively low ∼3−5
% (Table 3) and this atomic concentration is decreasing with the rising of the phosphate content. However, the nickel enrichment in the sur- face layer presumable in Ni2P/Ni5P12form is very likely according to the P 2p spectra. The authors assume that could be responsible for the enhanced catalytic activity. In the C 1s XPS spectra, three peaks were identified. The first peak at 284.78 eV is assigned to the CC and CHee hydrocarbon and the second peak at 286.48 eV is assigned to COeH arising from surface contamination. The third peak at 288.84 eV are assigned to CO and OCO]e]species, which can be attributed to a surface contamination component or a solvent degradation product. In the O 1s XPS spectra, two peaks were identified. The first peak at 531.9
eV is assigned to CO]and the second peak at 530.63 eV is assigned to the lattice oxygen, OeCO][71]. The corresponding binding energies and atomic percentages as well as the phosphate and phosphide ratio according to the deconvoluted XPS spectra are reported inTable 3.
4. Conclusion
5 wt% NiO-xP-Al2O3catalysts were prepared by a modified sol-gel method. The effect of phosphorus addition on NiO-Al2O3catalyst in CO2hydrogenation was investigated. The BET surface area decreased with increasing phosphorus doping. The phosphorus loaded NiO-Al2O3
exhibited enhanced performance towards CO2hydrogenation compared with pure NiO-Al2O3. Ni/NiO/Ni2P/Ni5P12/AlPO4 interfacial species were detected as active species on the used catalysts by X-ray photo- electron spectroscopy. The formation ratio of the metal-phosphide is relatively low ∼3−5 %, and this atomic concentration is decreasing with the rising of the phosphate content. However, the nickel enrich- ment in the surface layer presumable in Ni2P/Ni5P12form is very likely according to the P 2p spectra and the authors assume that could be responsible for the enhanced catalytic activity. This work will not only help in understanding the role phosphorus in CO2hydrogenation re- action but also provide insights for future design and development of high performance phosphorus loaded catalysts.
Credit author statement
The authors have nothing to declare about Credit of Statement.
Declaration of Competing Interest
The authors declare no competing financial interest.
Acknowledgements
This paper was supported by the Hungarian Research Development and Innovation Office through grants NKFIH OTKA PD 120877 of AS.
ÁK, and KZ is grateful for the fund of NKFIH (OTKA)K112531 &
NN110676 and K120115, respectively. The financial support of the Hungarian National Research, Development and Innovation Office through the GINOP-2.3.2-15-2016-00013 project "Intelligent materials based on functional surfaces - from syntheses to applications" and the Ministry of Human Capacities through the EFOP-3.6.1-16-2016-00014 project and the 20391-3/2018/FEKUSTRAT are acknowledged.
References
[1] W. Zhou, K. Cheng, J. Kang, C. Zhou, V. Subramanian, Q. Zhang, Y. Wang, Chem.
Soc. Rev. (2019).
[2] M. Aresta, A. Dibenedetto, A. Angelini, Chem. Rev. 114 (2013) 1709–1742.
[3] A. Sápi, G. Halasi, J. Kiss, D.G. Dobó, K.N.L. Juhász, V.J. Kolcsár, Z. Ferencz, G. Vári, V. Matolin, A.S. Erdőhelyi, J. Phys. Chem. C 122 (2018) 5553–5565.
[4] A. Sápi, T. Rajkumar, M. Ábel, A. Efremova, A. Grósz, A. Gyuris, K.B. Ábrahámné, Table 3
Binding Energy (eV) and Atomic Percentages (%) of Ni, Al, P, C and O elements as well as the phosphate and phosphide ratio obtained from XPS spectra of 5 wt%
NiO-xP-Al2O3(x = 0, 5, 15, 20) catalysts.
Catalysts Ni 2p Al 2p P 2p C 1 s O 1 s P 2p
B.E (eV) % B.E (eV) % B.E (eV) % B.E (eV) % B.E (eV) % Phosphate Phosphide
B.E (eV) Ratio % B.E (eV) Ratio % 5 wt% NiO-5P-
Al2O3
852.5 856.5 861.9
874.4 880.7 0.78 74.2 23.58 134.15
130.37 7.75 284.78 286.48
288.84 10.73 531.90
530.63 57.16 134.15 95.08 130.37 4.92 5 wt% NiO-15P-
Al2O3
852.5 856.5 861.9
874.4 880.7 1.15 74.1 20.11 134.17
130.39 11.58 284.80 286.38
288.77 9.61 532.17
530.27 57.55 134.17 95.4 130.39 4.6 5 wt% NiO-20P-
Al2O3
852.5 856.5 861.9
874.4 880.7 1.27 74.4 18.05 134.21
130.43 13.61 284.80 286.47
288.69 10.65 532.28
530.13 56.4 134.21 96.87 130.43 3.13
I. Szenti, J. Kiss, T. Varga, J. Co2 Util. 32 (2019) 106–118.
[5] T. Rajkumar, A. Sápi, M. Ábel, F. Farkas, J.F. Gómez-Pérez, Á. Kukovecz, Z. Kónya, Catal. Letters (2019) 1–10.
[6] J.A. Turner, Science 305 (2004) 972–974.
[7] S. Kattel, P. Liu, J.G. Chen, J. Am. Chem. Soc. 139 (2017) 9739–9754.
[8] H. Yang, C. Zhang, P. Gao, H. Wang, X. Li, L. Zhong, W. Wei, Y. Sun, Catal. Sci.
Technol. 7 (2017) 4580–4598.
[9] M.D. Porosoff, B. Yan, J.G. Chen, Energy Environ. Sci. 9 (2016) 62–73.
[10] Y. Xu, J. Liu, J. Wang, G. Ma, J. Lin, Y. Yang, Y. Li, C. Zhang, M. Ding, ACS Catal. 9 (2019) 5147–5156.
[11] J. Su, H. Zhou, S. Liu, C. Wang, W. Jiao, Y. Wang, C. Liu, Y. Ye, L. Zhang, Y. Zhao, Nat. Commun. 10 (2019) 1297.
[12] J.H. Kwak, L. Kovarik, J.N. Szanyi, ACS Catal. 3 (2013) 2094–2100.
[13] A. Goguet, F. Meunier, J. Breen, R. Burch, M. Petch, A.F. Ghenciu, J. Catal. 226 (2004) 382–392.
[14] X. Zhu, X. Qu, X. Li, J. Liu, J. Liu, B. Zhu, C. Shi, Chin. J. Catal. 37 (2016) 2053–2058.
[15] S.V. Lambeets, C.D. Barroo, S. Owczarek, L. Jacobs, E. Genty, N. Gilis, N. Kruse, T. Visart De Bocarmé, J. Phys. Chem. C 121 (2017) 16238–16249.
[16] A. Aitbekova, L. Wu, C.J. Wrasman, A. Boubnov, A.S. Hoffman, E.D. Goodman, S.R. Bare, M. Cargnello, J. Am. Chem. Soc. 140 (2018) 13736–13745.
[17] C. Zhao, X. Dai, T. Yao, W. Chen, X. Wang, J. Wang, J. Yang, S. Wei, Y. Wu, Y. Li, J.
Am. Chem. Soc. 139 (2017) 8078–8081.
[18] D. Williamson, C. Herdes, L. Torrente-Murciano, M.D. Jones, D. Mattia, ACS Sustain. Chem. Eng. (2019).
[19] R. Mutschler, E. Moioli, W. Luo, N. Gallandat, A. Züttel, J. Catal. 366 (2018) 139–149.
[20] J. Martins, N. Batail, S. Silva, S. Rafik-Clément, A. Karelovic, D.P. Debecker, A. Chaumonnot, D. Uzio, Catal. Commun. 58 (2015) 11–15.
[21] L. Falbo, C.G. Visconti, L. Lietti, J. Szanyi, Appl. Catal. B (2019) 117791.
[22] Y. Wang, H. Arandiyan, J. Scott, K.-F. Aguey-Zinsou, R. Amal, Acs Appl. Energy Mater. 1 (2018) 6781–6789.
[23] J. Li, Y. Lin, X. Pan, D. Miao, D. Ding, Y. Cui, J. Dong, X. Bao, ACS Catal. (2019).
[24] W. Li, Y. Liu, M. Mu, F. Ding, Z. Liu, X. Guo, C. Song, Appl. Catal. B 254 (2019) 531–540.
[25] D. Beierlein, D. Häussermann, M. Pfeifer, T. Schwarz, K. Stöwe, Y. Traa, E. Klemm, Appl. Catal. B 247 (2019) 200–219.
[26] S. Li, S. Guo, D. Gong, N. Kang, K.-G. Fang, Y. Liu, Int. J. Hydrogen Energy 44 (2019) 1597–1609.
[27] A. Kim, C. Sanchez, B. Haye, C. Boissière, C. Sassoye, D.P. Debecker, Acs Appl. Nano Mater. (2019).
[28] S. Lee, Y.H. Lee, D.H. Moon, J.Y. Ahn, D.D. Nguyen, S.W. Chang, S. Kim, Ind. Eng.
Chem. Res. (2019).
[29] X. Jia, X. Zhang, N. Rui, X. Hu, C.-j. Liu, Appl. Catal. B 244 (2019) 159–169.
[30] X. Zhang, S.D. House, Y. Tang, L. Nguyen, Y. Li, A.A. Opalade, J.C. Yang, Z. Sun, F.F. Tao, ACS Sustain. Chem. Eng. 6 (2018) 6467–6477.
[31] Z.-F. Jiao, J.-X. Zhao, X.-N. Guo, X.-L. Tong, B. Zhang, G.-Q. Jin, Y. Qin, X.-Y. Guo, Catal. Sci. Technol. 9 (2019) 2266–2272.
[32] H. Liu, Y. He, K. Nagashima, G. Meng, T. Dai, B. Tong, Z. Deng, S. Wang, N. Zhu, T. Yanagida, Sens. Actuators B Chem. 293 (2019) 342–349.
[33] M. Yin, Z. Zhu, J. Alloys. Compd. 789 (2019) 941–947.
[34] Z. Zhu, L. Zheng, S. Zheng, J. Chen, X. Xing, D. Feng, D. Yang, J. Mater. Chem. A 7 (2019) 10456–10463.
[35] Y. Teng, H. Zhao, Z. Zhang, Y. Li, H. Liu, Mater. Lett. 246 (2019) 141–143.
[36] Y. Hong, J. Yang, J. Xu, W.M. Choi, Curr. Appl. Phys. 19 (2019) 715–720.
[37] F. Ding, A. Zhang, M. Liu, Y. Zuo, K. Li, X. Guo, C. Song, Ind. Eng. Chem. Res. 53
(2014) 17563–17569.
[38] J. Liu, A. Zhang, X. Jiang, M. Liu, J. Zhu, C. Song, X. Guo, Ind. Eng. Chem. Res. 57 (2018) 9120–9126.
[39] J. Sun, Y. Wang, H. Zou, X. Guo, Z.-j. Wang, J. Energy Chem. 29 (2019) 3–7.
[40] W. Cai, Y. Hu, J. Chen, G. Zhang, T. Xia, CrystEngComm 14 (2012) 972–977.
[41] M. Trueba, S.P. Trasatti, Eur. J. Inorg. Chem. 2005 (2005) 3393–3403.
[42] S. Das, A. Bag, R.K. Gupta, M. Sengupta, A. Bordoloi, Acs Appl. Energy Mater. 1 (2018) 4414–4419.
[43] Y. Zhan, Y. Wang, D. Gu, C. Chen, L. Jiang, K. Takehira, Appl. Surf. Sci. 459 (2018) 74–79.
[44] S.M. Sajjadi, M. Haghighi, Int. J. Energy Res. 43 (2019) 853–873.
[45] G. Zhu, K. Wu, L. Tan, W. Wang, Y. Huang, D. Liu, Y. Yang, ACS Sustain. Chem. Eng.
6 (2018) 10078–10086.
[46] Q. Li, Z. Yi, Y. Cheng, X. Wang, D. Yin, L. Wang, Appl. Surf. Sci. 427 (2018) 354–362.
[47] Y. Feng, H. Zhang, L. Fang, W. Li, Y. Wang, J. Mater. Chem. A 4 (2016) 11507–11515.
[48] X. Li, Z. Mu, J. Hu, Z. Cui, Sens. Actuators B Chem. 232 (2016) 143–149.
[49] Y. Liu, F. Liu, J. Bai, T. Liu, Z. Yu, M. Dai, L. Zhou, H. Wang, Y. Zhang, H. Suo, Sens.
Actuators B Chem. (2019).
[50] J. Rong, T. Zhang, F. Qiu, M. Chen, Korean J. Chem. Eng. 34 (2017) 41–53.
[51] C. Lei, X. Zhu, Y. Le, B. Zhu, J. Yu, W. Ho, RSC Adv. 6 (2016) 10272–10279.
[52] W. Gu, M. Shen, X. Chang, Y. Wang, J. Wang, J. Alloys. Compd. 441 (2007) 311–316.
[53] J. Wang, Y. Wang, J. Wen, M. Shen, W. Wang, Microporous Mesoporous Mater. 121 (2009) 208–218.
[54] M. Shen, L. Song, J. Wang, X. Wang, Catal. Commun. 22 (2012) 28–33.
[55] X. Chen, X. Zheng, W. Lin, D. Chen, Y. Zheng, L. Jiang, Powder Technol. 338 (2018) 869–877.
[56] Y.-f. Liu, Z.-p. Yang, Q.-m. Yu, J. Alloys. Compd. 509 (2011) L199–L202.
[57] J. Campelo, M. Jaraba, D. Luna, R. Luque, J. Marinas, A. Romero, J. Navio, M. Macias, Chem. Mater. 15 (2003) 3352–3364.
[58] M. Shah, A. Bordoloi, A.K. Nayak, P. Mondal, Fuel Process. Technol. 192 (2019) 21–35.
[59] S. Mahammadunnisa, P. Manoj Kumar Reddy, B. Ramaraju, C. Subrahmanyam, Energy Fuels 27 (2013) 4441–4447.
[60] T. Borowiecki, W. Gac, A. Denis, Appl. Catal. A Gen. 270 (2004) 27–36.
[61] J. Zhang, H. Xu, X. Jin, Q. Ge, W. Li, Appl. Catal. A Gen. 290 (2005) 87–96.
[62] S. Abate, C. Mebrahtu, E. Giglio, F. Deorsola, S. Bensaid, S. Perathoner, R. Pirone, G. Centi, Ind. Eng. Chem. Res. 55 (2016) 4451–4460.
[63] X. Chen, Y. Zheng, F. Huang, Y. Xiao, G. Cai, Y. Zhang, Y. Zheng, L. Jiang, ACS Catal. 8 (2018) 11016–11028.
[64] J. Gao, Y. Wang, Y. Ping, D. Hu, G. Xu, F. Gu, F. Su, RSC Adv. 2 (2012) 2358–2368.
[65] X. Fang, J. Zhang, J. Liu, C. Wang, Q. Huang, X. Xu, H. Peng, W. Liu, X. Wang, W. Zhou, J. Co2 Util. 25 (2018) 242–253.
[66] Y. Fu, C. Zhu, H. Wang, Y. Dou, W. Shi, M. Shao, H. Huang, Y. Liu, Z. Kang, Inorg.
Chem. Front. 5 (2018) 1646–1652.
[67] L. Sciortino, F. Giannici, A. Martorana, A.M. Ruggirello, V.T. Liveri, G. Portale, M.P. Casaletto, A. Longo, J. Phys. Chem. C 115 (2011) 6360–6366.
[68] S. Verdier, L. El Ouatani, R. Dedryvere, F. Bonhomme, P. Biensan, D. Gonbeau, J.
Electrochem. Soc. 154 (2007) A1088–A1099.
[69] J.A. Rotole, P.M. Sherwood, Surf. Sci. Spectra 5 (1998) 60–66.
[70] Y. Chen, H. She, X. Luo, G.-H. Yue, D.-L. Peng, J. Cryst. Growth 311 (2009) 1229–1233.
[71] R. Al-Gaashani, A. Najjar, Y. Zakaria, S. Mansour, M. Atieh, Ceram. Int. 45 (2019) 14439–14448.