Cu-Fe/Graphite-oxide Nanocomposite For Photodegradation Of Dichloro-Diphenyl-Trichlorothane (DDT) From Aqueous Solution
Giang H. Lea, Thanh T. Nguyenb, Manh B Nguyena, Trang T. T. Quana, Trinh Duy Nguyenc, András Sápid,*, Imre Szentid, Ákos Kukoveczd, Zoltán Kónyad and Tuan A. Vua
aInstitute of chemistry, Vietnam Academy of Science and Technology.18 Hoang Quoc Viet street, Cau Giay, Ha Noi, Vietnam.
bGraduate University of Science and Technology, Vietnam Academy of Science and Technology. 18 Hoang Quoc Viet street, Cau Giay, Ha Noi, Vietnam.
cNTT Institute of High Technology, Nguyen Tat Thanh University, 300A Nguyen Tat Thanh, District 4, Ho Chi Minh City, Vietnam
dUniversity of Szeged, Interdisciplinary Excellence Centre, Department of Applied and Environmental Chemistry, H- 6720, Rerrich Béla tér 1, Szeged, Hungary
*Corresponding author Email: sapia@chem.u-szeged.hu
Submitted/Received: ……....………..… Accepted: …………....…………...
Cu-Fe/GO nanocomposite was successfully synthesized by “atomic implantation” method via simultaneous incorporation of Fe and Cu atoms into graphene oxide frameworks. The sample was characterized by XRD, TEM, FTIR, BET, EDX and XPS. From EDX and TEM images, it showed that Cu-Fe/GO sample has particle size of 5 - 10 nm with uniform size distribution. From XPS results, existence of both Fe2+ and Cu+ ions in the Cu-Fe/GO structure were revealed. The photocatalytic degradation of 4,4’-DDT was performed in a bath with magnetic stirring under UV- A irradiation using H2O2 as an oxidant co-agent. The various effects like pH, H2O2 concentration, catalyst dosage were investigated. The best conditions were found to be pH of 5; 15 mg/L H2O2
concentration 0.2 g/L catalyst and reaction time of 3 hours at room temperature. To our best knowledge, the highly photocatalytic performance of novel Cu-Fe/GO nanocomposite in the degradation of 4,4’-DDT from aqueous solution has not yet been reported. Thus, after 3 hours of reaction, 4,4’-DDT removal efficiency reached the value of 99.7% with a high, reproducible stability. We believe that the high degradation activity can be attributed to the presence of the reduction of Fe3+ to Fe2+ by the help of Cu+-ions which pathway are playing importan role in the formation of OH∙ radicals.
Keywords: Cu-Fe/GO nanocomposite, Sun-light irradiation, DDT photocatalytic degradation
1. Introduction
Dichloro Diphenyl Trichlorothane (DDTs), Polychlorinated biphenyl (PCBs), Dioxins and Furans were listed in twelve persistent organic pollutants (POPs) on the Stockholm Convention, which are highly considered because of their high risk of causing harmful effects on human health and the environment.1 Many methods and techniques have been developed to eliminate these pollutants in the environment such as adsorption, biodegradation, chemical degradation.1-3 Recently, nano structured zero valent iron was claimed as highly active sites for degradation of DDT in water and soil. S. Kang el al.,4 successfully synthesized nano structured zero valent iron by ball-milling the industrially reduced iron powder. They showed that nano zero vanlent ion in plate-like exhibited higher DDT degradation performance as compared to that of commercial zero valent ion powders.
Yehia S. Temsha el al.,5 also claimed that nano sized zero valent iron (nZVI) prepared by precipitation with boro hydride and by gas phase reduction of iron oxide under H2 environment showed high efficiency in DDT degradation. Additionally, H. Tian el al.,6 reported the bimetalic Ni/Fe nano particles as efficient catalyst for DDT degradation in aqueous solution where Fe nano particles promoted fenton reaction while Ni promoted the dehydroclorination reation.
Advanced oxidation processes (AOPs) is one of the most effective methods used to degrade toxic pollutants into non-toxic compounds. This refers to an oxidation process through the formation of hydroxyl radicals (•OH) which promoted the degradation of primarily organic chemical contaminants in water. These hydroxyl radicals subsequently react with organic contaminants through a series of multi-step reactions to form the non-toxic products such as low molecular weight carboxylic acids, HCl, CO2, and H2O.7 Fenton process using Fenton’s reagent (Fe2+/H2O2) has unique advantages, including its low cost, high degradation efficiency, low toxicity and simple operation.8 Unfortunately, the traditional homogeneous Fenton reaction has some drawbacks; for example, the lack of the recovery of the catalysts, its inefficiency in most natural aqueous media (pH 5÷9), production of large amounts of sludge and requirement of the further treatments, which may prevent its potential application.9 In order to overcome these problems, heterogeneous Fenton- like processes using iron-based catalysts such as Fe2O3, Fe3O4, FeOOH, Feo, Fe-MOFs, Feo-Fe3O4
nanoparticles have been recently studied and developed.9-13 Fenton-like oxidation mainly occurs at the solid–liquid interface, where the iron remains either in the solid phase and/or an adsorbed ion.9
In the last few years, extensive works have tried to synthesize iron oxide with other materials such as Feo/CeO2 composite,11 Fe3O4/CeO2 composite,12 Fe-g-C3N4/graphitized mesoporous carbon composite,14 graphene oxide/Fe2O3,15 Fe-Fe3O4/GO,16 graphene oxide/FePO4,17 graphene oxide/Fe- MOFs,18. Among them, graphene and graphene oxide (GO) materials have been received a great interest due to their unique structure and physical-chemical properties such as high conductivities at room temperature, high specific surface and chemical stability,19,20 and high visible light absorption ability.21
In this paper, we report the synthesis of Cu-Fe/GO nanocomposite using atomic implantation method by the simultaneous incorporation of Fe and Cu atoms in vapor phase into graphene oxide framework. The photocatalytic activity of this novel material was investigated by the 4,4’-DDT degradation from aqueous solution. Furthermore, the role of Cu as well as mechanism of heterogeneous Fenton-like process for the 4,4’-DDT degradation was elucidated.
2. Experimental
2.1. Synthesis of Cu-Fe/GO nanocomposite
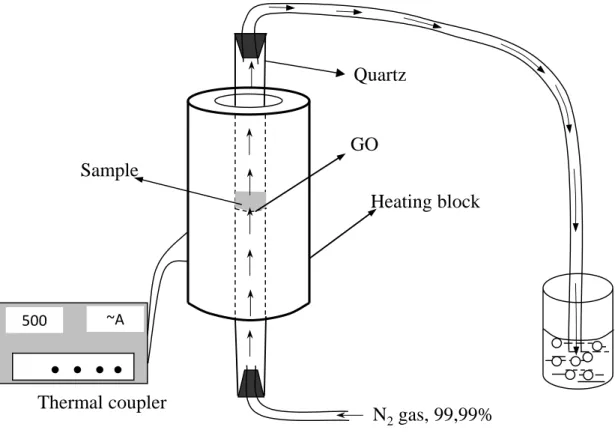
Cu-Fe/GO nanocomposite was synthesized by atomic implantation method. The determined amount of FeCl3.6H2O, CuCl2.4H2O and GO with the Cu:Fe:GO ratio of 2:18:80 in wt% were mixed and put into a tubular furnace (Fig. 1). The system is heated to 500 oC with a rate of 10
oC/min and maintained for 30 minutes at 500°C under N2 atmosphere. After that, the Cu-Fe/GO nanocomposite material was cooled down to room temperature.
● ● ● ●
Thermal coupler
Heating block Sample
Quartz
N2gas, 99,99%
GO
500 ~A
Figure 1. Schematic view of the equipment for synthesis of Cu-Fe/GO nanocomposite by atomic implantation method
2.2. Characterization
X-ray powder diffraction (XRD) patterns was recorded using a Cu Kα radiation source on a D8 Advance Bruker powder diffractometer. Transmission electron microscopy studies was performed using a JEOL JEM 1400 Transmission Electron Microscope (TEM) at 100 kV acceleration voltage.
Fourier transform infrared (FT-IR) spectra will be obtained on a JACOS 4700 instrument, with samples being dispersed on potassium bromide pressed into pellets. The surface area (BET) was determined using nitrogen adsorption and desorption method combined with Brunauer-Emmett- Teller (BET) equation (Trista Plus II). The synthesized photocatalysts was analyzed by a Thermo Fisher K-Alpha X-ray Photoelectron Spectrometer (XPS, ESCALab MKII). The XPS spectra was fitted by Gaussian multi-peak shapes to characterize the elemental states of the photocatalysts.
Energy Dispersive X-ray spectroscopic mapping (EDX) were performed using a JEOL JED-2300 spectrometer.
2.3. Photocatalytic degradation experiments
The photo-Fenton reactivity of the Fe/GO and Cu-Fe/GO nanocomposite were tested in the degradation of 4,4’-DDT from aqueous solution under stirring conditions and simulated sunlight irradiation used UV-A range lamps (4 lamps, power of 15 W for each lamp). The distance from the irradiator to the surface of the testing solution is 20 cm, the brightness is 2.03.104 Lux (M6M PRO Lux Meter LX 1010 BS - Taiwan). The experiment was carried out at room temperature in a Pyrex reactor equipped with cooling water system. For each experiments, 100 mL of DDT solution of 10 mg/L concentration and Cu-Fe/GO nanocomposite catalyst were mixed. The catalyst concentration and the pH of the solution were tuned to find the optimal conditions. Here in, we used 10-100 mg/L H2O2 concentration, catalyst dosage of 0.05 – 0.4 g/L and pH of 3 – 8. The reaction mixture was stirred in the dark for 30 minutes to reach the saturated adsorption–desorption equilibrium balance on the catalyst surface. Then the reaction mixture was exposed to light under magnetic stirring condition. The suspension was collected and separated by centrifugation. The 4,4’-DDT concentrations were analyzed by using a GC/MS Agilent GC 7890A, MS 5975C spectrometer. The intermediate products were analyzed by a LC/MS/MS HRAM (Thermo Fisher) with a column of Ultra Aqueous C18,5µm. The degradation efficiency of 4,4’-DDT (%) was calculated according to the formula:
Removal efficiency (%) = 100(%) - [(Ct/Co) x 100(%)]
Where Co, Ct (mg/L) is the initial concentration and concentration after the time t of the reaction.
3. Results and Discussion 3.1. Structure and morphology
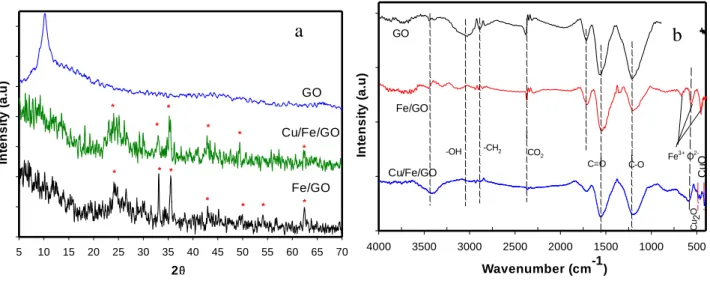
Figure 2 shows the crystal structure and formed functional groups of synthesized materials obtained by XRD and FTIR techniques.
2
5 10 15 20 25 30 35 40 45 50 55 60 65 70
Intensity (a.u)
GO
Fe/GO
* * *
* * * *
*
*
*
*
*
*
Cu/Fe/GO
Wavenumber (cm-1 )
500 1000 1500 2000 2500 3000 3500 4000
Intensity (a.u)
GO
Fe/GO
-OH -CH2 CO2
C=O C-O Fe3+ O2- CuOCu2O Cu/Fe/GO
Figure 2. XRD patterns (a) and FTIR spectra (b) of GO, Fe/GO and Cu-Fe/GO nanocomposite material.
From XRD patterns, it observed that Fe existed in the form of -Fe2O3 which appeared at 2θ of 24.1° (012), 33.1° (104), 36.5° (110), 40.8° (113), 49.4° (024), 54.1° (116), 57.5° (018), 62.3° (214) and 64° (300).15 In the case of Cu-Fe/GO catalyst, the small increment of the peak ~33°, 37° and 43° can be attributed to the presence of oxide as well as metallic Cu next to the -Fe2O3 form, however, due to the low amount of copper, XPS analysis was performed for deeper understanding (Figure 3.). It is interesting to note, that the absence of the peak at 2θ =11.5o which typical for GO structure in Fe/GO and Cu-Fe/GO the nanocomposite materials, indicated that Fe and Cu particles were intercalated within the GO layer.22
FTIR spectra of Cu-Fe/GO nanocomposite showed the presence of peaks at 3419 cm−1 and at 1576 cm−1 which assigned to the C–OH, COOH group, respectively.23 The intense peak at 1230 cm−1 is related to the aromatic stretching vibration of C–O bond.23 In additional, peaks at 630 cm-1, 570 cm-1, 480 cm-1 corresponding to the formation of Fe-GO and Fe2O3-GO binding to the functional groups of GO.24 Thus, these results revealed the interaction between Fe2O3 and GO.
FTIR spectra of Cu-Fe/GO also showed low intensity peaks at 506 cm-1 and 430 cm-1 which assigned to the Cu, Cu2O or CuO in the structure of Fe-Cu/GO composite.25,26
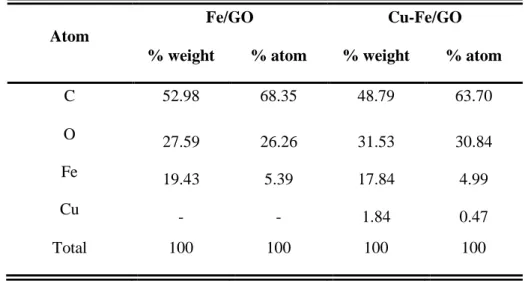
As indicated in Table 1 the Fe:Cu ratio correlates well with the synthetic parameters. It is also seen, that the Cu content is as low as 1.84% wt. The Cu/Fe ratio (in moles) is about 0.1. The Fe content in both Fe/GO and Fe-Cu/GO was not considerably differentiated.
a b
Table 1. EDX analysis for the elemental composition of the composite Fe/GO and Cu-Fe/GO
Atom
Fe/GO Cu-Fe/GO
% weight % atom % weight % atom
C 52.98 68.35 48.79 63.70
O 27.59 26.26 31.53 30.84
Fe 19.43 5.39 17.84 4.99
Cu - - 1.84 0.47
Total 100 100 100 100
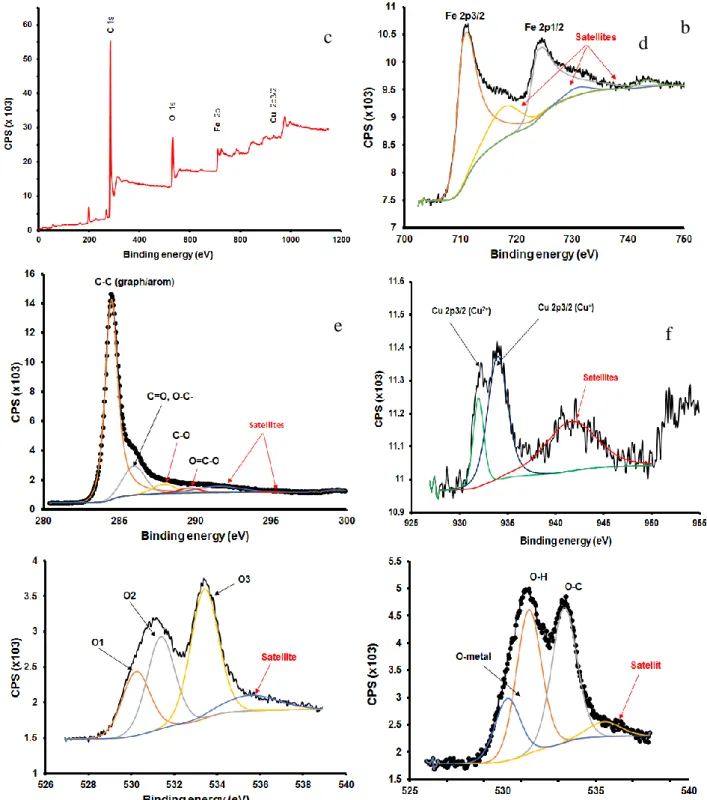
XPS spectra in Figure 3. showed that the occurrence of peaks at binding energy of 931 eV; 943 eV and 951 eV ascribed to the formation of Cu(II)O in the material.25 The peak at 934 eV assigned to Cu2O.25 Moreover, the binding energy of Fe2p3/2 of the hybrid was located at 710 eV while the peak of Fe2p1/2 appeared at 724 eV which indicated the existence of Fe2O3.26, 27 Low intensity peaks at 715 eV and 730 eV could ascribe to the formation of Fe(II)O in the material.27, 28 The deconvolution of the C1s peak was consisted of three peaks at 284.4 eV, 285.6 eV and 288.3 eV, which were ascribed to the C-C, C-O, and C(O)O bonding in GO sheets. The deconvolution of O1s spectrum showed three peaks corresponding to Fe-O (529.9 eV), C=O (531.1 eV), and C-O (533.0 eV), respectively.
Figure 3. XPS survey spectra, Fe2p, C1s and O1s XPS spectra of the Fe/GO nanocomposite (f,g,h) and Cu- Fe/GO nanocomposites (a,b,c,d,e)
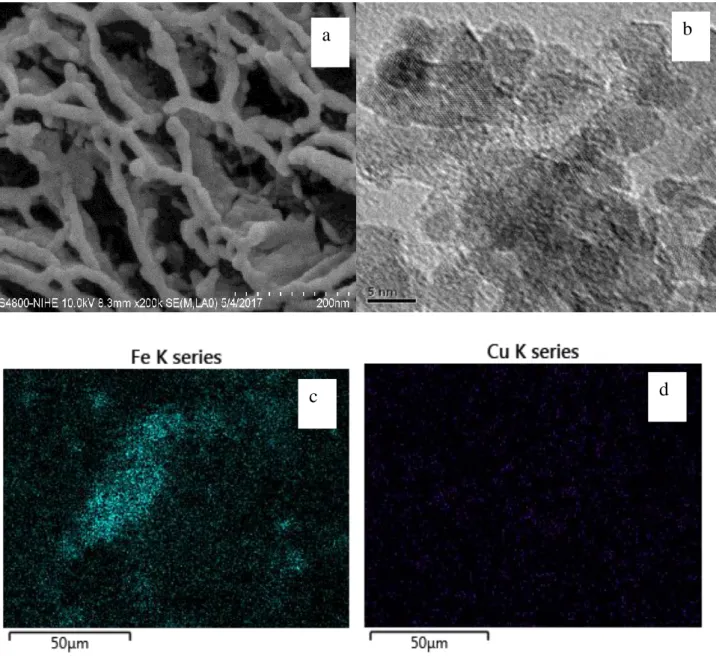
SEM and TEM images of Cu-Fe/GO composite were illustrated in Figure 4. SEM image (Figure 4a.) show the presence of a structured porous GO network, while TEM image (Figure 4b.) presents nanoparticles with particle size of 5-10 nm and relative uniform distribution which can be attributed
a b
c d
e f
to the Fe- and Cu-based co-catalysts. The EDX mapping results (Fig. 4 c,d) confirmed the nice dispersion of the nanoparticles.
Figure 4. SEM (a) and TEM (b) images and EDX mapping maping (c, d) of the Cu-Fe/GO composite
3.2. N2 adsorption–desorption isotherms (BET)
The nitrogen adsorption–desorption isotherms of Cu-Fe/GO composite and GO were presented in Fig. 5 and the textual features were listed in Table 2.
a b
c d
Relative Pressure (p/p°)
0,0 0,1 0,2 0,3 0,4 0,5 0,6 0,7 0,8 0,9 1,0
Quantity Adsorbed (cm³/g STP)
0 200 400 600 800 1000 1200
GO
Cu-Fe/GO
Pore Width (nm)
0 20 40 60 80 100
Pore Volume (cm³/g·nm)
0,000 0,005 0,010 0,015 0,020 0,025 0,030 0,035 0,040
Pore Width (nm)
0 10 20 30 40 50
Pore Volume (cm³/g·nm)
0,000 0,005 0,010 0,015 0,020 0,025 0,030 0,035 0,040
GO
Cu-Fe/GO
Figure 5. N2 adsorption – desorption isotherms (a) and pore distribution (b) of Cu-Fe/GOand GO
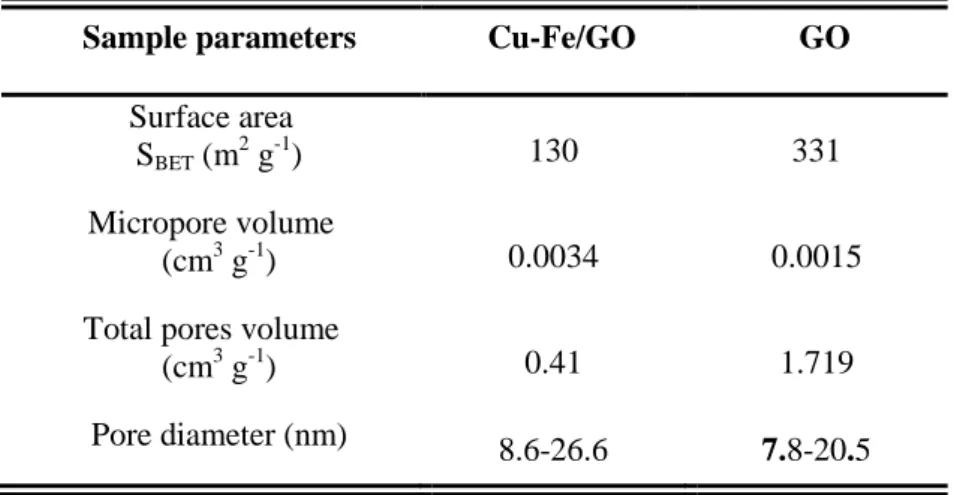
The N2 adsorption–desorption curve of GO and Cu-Fe/GO composite (Figure 5.) displayed type IV isotherm, which is characteristic of the porous nature of the material.15 As observed in Table 2, the surface area of the Cu-Fe/GO nanocomposite strongly reduced from 331 m2/g to 130 m2/g as compared to that of GO. This clearly indicated that Cu and Fe well deposited on the surface of GO causing the decrease of N2 adsorption capacity of the sample. However, the presence of the nanoparticles caused increament in the pore diameter compared to the pure GO.
Table 2. Textual features of of GO and Cu-Fe/GO nanocomposite material.
Sample parameters Cu-Fe/GO GO
Surface area
SBET (m2 g-1) 130 331
Micropore volume
(cm3 g-1) 0.0034 0.0015
Total pores volume
(cm3 g-1) 0.41 1.719
Pore diameter (nm) 8.6-26.6 7.8-20.5
a b
3.3. Effects of parameters on the degradation of 4,4’-DDT 3.3.1. Effect of pH
After the detailed characterization of the samples, the Cu-Fe/GO catalyst was tested in photocatalytic degradation of 4,4’-DDT, where firstly, the pH, amount of catalysts as well as amount of H2O2 were tuned.
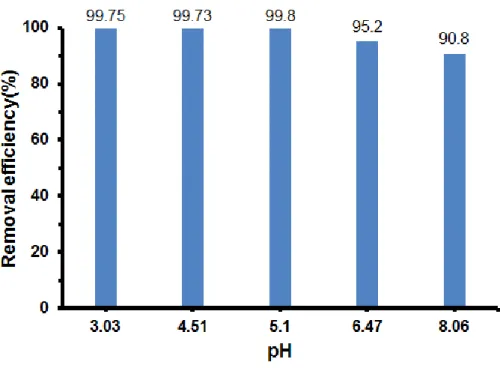
From the literature reports it is well known that, pH values play an important role in the Fenton reaction for organic contaminants degradation.8,14 The effect of pH on the degradation of 4,4’-DDT over the Cu-Fe/GO nanocomposite was examined in the range of pH 3 to 8.
Figure 6. showed the removal efficiency of 4,4’-DDT after 3 hours of reaction where the catalyst achieved the value of 99.7% at pH of 3-5. At the pH values of 5 -8 the removal efficiency slightly decreased from 99.7% to 90.8%, respectively. This result indicated the different behavior between the heterogeneous and homogenous Fenton reaction, where homogeneous Fenton reaction strongly depends on pH values and favored at lower pH.29-33
Figure 6. Effect of solution pH on the photo-Fenton degradation of 4,4’-DDT over the Cu-Fe/GO nanocomposite catalyst.
3.3.2. Effect of catalyst dosage
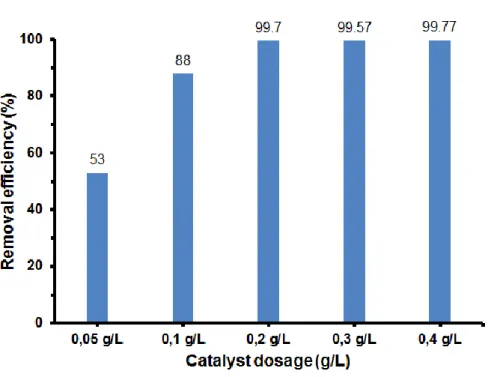
Figure 7. showed the 4,4’-DDT removal efficiency of the Cu-Fe/GO composite at different catalyst dosages in condition: 4,4’-DDT concentration of 10 mg/L, pH of 5 and catalyst dosages ranged in 0.05 - 0.4 g/L. As noted in Figure 7., the increase of Cu-Fe/GO catalyst dosage from 0.05 to 0.2 g/L improved the 4,4’-DDT removal efficiency from 53.0% to 99.8%. Further increase of catalyst dosages from 0.2 mg/L to 0.4 mg/L did not increase the 4,4’-DDT removal efficiency. This result indicated that at catalyst concentration of 0.2 mg/L provided enough active sites to completely degrade the 4,4’-DDT. In the case of higher initial 4,4’-DDT concentration, higher catalyst concentration may be needed.29
Figure 7. Removal efficiency at different of Cu-Fe/GO catalyst dosage in the photo-fenton degradation of 4,4’-DDT.
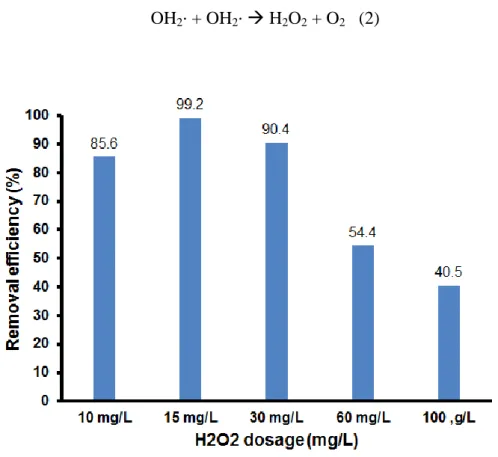
3.3.3. Effect of H2O2 dosage
Figure 8. plotted the 4,4’-DDT degradation over the Cu-Fe/GO catalyst at different H2O2
concentrations. 4,4’-DDT degradation was performed in the following conditions: 4,4’-DDT concentration of 10 mg/L, catalyst concentration of 2 mg/L, pH of 5, reaction time of 3h and H2O2
concentration changed from 10 mg/L to 100 mg/L. As seen in Figure 8., with increasing H2O2
concentration from 10 mg/L to 15 mg/L, the 4,4’-DDT removal efficiency increased from 85.6% to 99.2%, respectively. Further increase of H2O2 concentration from 30 mg/L to 100 mg/L decreased the 4,4’-DDT removal efficiency from 90.4% to 40.5%. This can be explained as the following: at low H2O2 concentrations, 4,4’-DDT removal efficiency increased with increasing H2O2 concentration due to H2O2 concentration promoted to form the optimal amount of OH∙ radicals while at high H2O2 concentration, the excess amount of H2O2 caused the reducing of OH∙ radicals according to the following reaction.29
OH∙ + H2O2 OH2∙ + H2O (1) OH2∙ + OH2∙ H2O2 + O2 (2)
Figure 8. 4,4’-DDT removal efficiency of Cu-Fe/GO composite as a function of H2O2 dosage
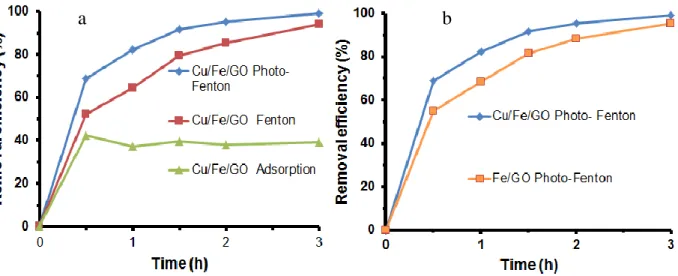
3.3.4. DDT degradation by Cu-Fe/GO catalyst
After tuning the parameters of the photodegradation, the degradation of 4,4’-DDT on the Cu- Fe/GO catalyst system through various adsorption, Fenton and photo-Fenton processes were examined (Figure 9.). The 4,4’-DDT removal efficiency by adsorption process reached the value of 40% after 30 min and maintained this value for another 2.5 h reaction. By Fenton and photo-Fenton processes, removal efficiency reached to the much higher values of 85% and 99.2%, respectively.
As noted in Figure 9a., removal efficiency by photo-Fenton reaction was enhanced as compared to that of Fenton reaction. This can be explained by the fact that the presence of Cu+ ions as evidenced by XPS can reduce Fe3+ to Fe2+ ion, providing more OH∙ radicals under visible light irradiation.34,35 Additionally, GO also plays an important role in accepting electrons generated by Fe2O3
semiconductor under light irradiation, inhibiting the recombination of electrons and holes which can be responsible to the rapid loss of photo catalytic activity.15,36,37 The promoting effect of Cu is also illustrated in Figure 9b., where the photocatalytic activity of Fe/GO and Cu-Fe/GO were compared.
The rate of the photocatalytic activity was higher in the case of the Cu-loaded samples.
Figure 9. Dependence of 4,4’-DDT removal efficiency on reaction time at different processes: adsorption, fenton and photo-fenton reaction (a) and comparison of 4,4’-DDT removal efficiency over
Fe/GO and Cu-Fe/GO (b)
a b
3.3.5. Intermediate products of the decomposition of 4,4’-DDT
POPs (persistent organic pollutants) degradation by AOP using photo-Fenton catalysts is one of the most effective methods. Our obtained results showed that the 4,4’-DDT was almost completely oxidized to CO2, H2O and HCl after 3h of reaction. However, for deeper understanding about the reaction mechanism, the intermediates produced during the reaction process were examined. Figure 10. showed the presence of some intermediates (e.g. hexacloro-cyclopenta-2,6 dichlorophenol and dinitro-toluene) identified by LC-MS. From the identified intermediates, the possible reaction path is the following:
-Firstly, dechlorination of 4,4’-DDT occurred with step by step to remove chlorine out from the 4,4’-DDT structure.
- Secondly, breaking the carbon chains and followed by decyclization
-Thirdly, complete oxidation of hydrocarbon with short chains to form CO2 and H2O.
So that, the intermediate products of the 4,4’-DDT decomposition tend to break down into shorter carbon chains (C14-C12-C7-C6) which is in a good agreement with that reported in the literature.38, 39
a
b
c d
Figure 10. The intermediates produced from DDT degradation process.
3.3.6. Stability of Cu-Fe/GO nanocomposite
In each test, the photocatalyst was separated from the equilibrium solution by filtration, then it was washed with methanol and vacuum dried at 60 oC. As observed in Figure 11a., after the first regeneration cycle, the removal efficiency reached to the value of 99.2%. After the fourth cycles, the removal efficiency reached to the value of 90.4%. From this result it showed that, after the fourth cycle of recycling the removal efficiency slightly decrease from 99.2% to 90.4%. The decrease of catalyst may be due to the iron leaching. In addition, XRD patterns (Figure 11b.) and SEM images (Figure 11c. and Figure 11d.) also demonstrated that there was no clear change observed in phase structure and morphology after the recycling experiments. From the results, the high photocatalytic activity could be proved.
2 degree
10 20 30 40 50 60 70
Intensity (a.u)
10 20 30 40 50 60 70
*
*
* *
* Cu-Fe/GO 1st
Cu-Fe/GO 4th
*
Figure 11. The cycling runs of DDT degradation over Cu-Fe/GO catalyst under simulated solar irradiation (a); XRD patterns of Cu-Fe/GO photocatalyst before and after (b) the SEM images of Cu-Fe/GO
after degradation (c and d)
4. Conclusions
Novel Cu-Fe/GO nanocomposite was successfully synthesized by atomic implantation method.
XRD, TEM, FTIR, EDX and XPS measurements proved the incorporation of Fe and Cu atoms with particle size of 5 - 10 nm into the graphene oxide frameworks. The various effects of pH, H2O2 concentration, catalyst dosage on the photocatalytic degradation of 4,4’-DDT in water were investigated. The best reaction condition was found to be pH of 5; 15 mg/L H2O2 concentration, 0.2g/L catalyst and reaction time of 3 hours at room temperature. This novel heterogeneous Fenton- like catalyst exhibited excellent photocatalytic performance for the 4,4’-DDTdegradation.
Maximum removal efficiency reached to the value of 99.7%. Additionally, this Cu-Fe/GO
a b
c d
composite showed high stability. Thus, the novel Cu-Fe/GO nanocomposite could be considered as an efficient and promising catalyst for the degradation of persistent organic pollutants.
Acknowledgments
The authors thanks the Institute of Chemistry, Vietnam Academy of Science and Technology for financial support of this work (TĐPCCC.03/18-20). This paper was supported by the Hungarian Research Development and Innovation Office through grants NKFIH OTKA PD 120877 of AS.
AK, and KZ is grateful for the fund of NKFIH (OTKA) K112531 & NN110676 and K120115, respectively. The financial support of the Hungarian National Research, Development and Innovation Office through the GINOP-2.3.2-15-2016-00013 project "Intelligent materials based on functional surfaces - from syntheses to applications" and the Ministry of Human Capacities through the EFOP-3.6.1-16-2016-00014 project and the grant 20391-3/2018/FEKUSTRAT is acknowledged.
References
1. M. Zhao, C. Wang, C. Zhang, Y. Wen and W. Liu, PLoS ONE 7(8), e43823 (2012).
2. H. Tian, J. Li, L. Zou, Z. Mu and Z. P. Hao, J. Chem. Technol. Biotechnol., 84(4), 490 (2009).
3. K. Ioannis Konstantinou and A. Triantafyllos Albanis, Appl. Catal. B Environ., 42, 319 (2003).
4. S. Kang, S. Liu, H. Wang and W. Cai,J. Hazard Mater. 307, 145 (2016).
5. S. Yehia E-Temsaha, A. Sevcu, K. Bobcikova, M.C. Erik and J. Joner, Chemosphere 144, 2221 (2016).
6. H. Tian, J. Li, Z. Mu, L. Li and Z. Hao, Sep. Purif. Technol., 66(1), 84 (2009).
7. M. Cheng, G. Zeng, D. Huang, C. Lai, P. Xu, C. Zhang and Y. Liu, Chem. Eng. J., 284, 582 (2015).
8. N. Wang, T. Zheng, G. Zhang and P. Wang, J. Environ. Chem. Eng., 4, 762 (2016).
9. M. Wang, G. Fang, P. Liu, D. Zhou, C. Ma, D. Zhang and J. Zhan, Appl. Catal. B Environ., 188, 113 (2016).
10. R. Cheng, G. Li, C. Cheng, L. Shi, X. Zheng and Z. Ma, RSC Adv., 5, 66927 (2015).
11. L. J. Xu and J. L. Wang, Appl. Catal. B Environ., 142–143, 396 (2013).
12. L. Xu and J. Wang, Sep. Purif. Technol., 149, 255 (2015).
13. A. Tuan Vu, H. Giang Le, D. Canh Dao, Q. Lan Dang, T. Kien Nguyen, T. Phuong Dang, T. K. Hoa Tran, T. Quang Duong, V. Tuyen Nguyen and D. Gun Lee, RSC Adv. 4, 41185 (2014).
14. J. Ma,Q. Yang, Y. Wen and W. Liu, Appl. Catal. B Environ., 201, 232 (2017).
15. S. Guo, G. Zhang, Y. Guo and J. C.Yu, CARBON 60, 437 (2013).
16. H. Giang Le, T. Quyet Ngo, T. Tuan Nguyen, K. Quang Nguyen, T.T. Trang Quan, D. Loi Vu, D. Gun Lee, and A. Tuan Vu,J. Mater. Eng. Perform., 27, 4225 (2018).
17. S. Guo, G. Zhang and J. C. Yu, J. Colloid. Interf. Sci., 448, 460 (2015).
18. A. Tuan Vu, H. Giang Le, T. Hoa Vu, T. Kien Nguyen, T. T. Trang Quan, K. Quang Nguyen, T. K. Hoa Tran, T. Phuong Dang, D. Loi Vu and D. Gun Lee, Mater. Res. Express 4, 035038 (2017).
19. M. Khan, M. N. Tahi, S. F. Adil, H. U. Khan, M. R. H. Siddiqui, A. A. Al-Warthan and W. Tremel, J.
Mater. Chem. A 3, 18753 (2015).
20. P. Bhunia, G. Kim, C. Baik and H.Lee, Chem. Commun. 48, 9888 (2012).
21. D. Prabu Jaihindh, C. Cheng Chen and Y. Pei Fu, RSC Adv. 8, 6488 (2018).
22. X.D. Huang, X.F. Zhou, K. Qian, D.Y. Zhao, Z.P. Liu, and C.Z. Yu, J. Alloys Compd. 514, 76 (2012).
23. V.H. Pham, T.V Cuong., S.H.Hur, E. Oh, E.J. Kim, E.W. Shin and J.S. Chung, J. Mater. Chem. 21, 3371 (2011).
24. C. Sarkar and S. K. Dolui, RSC Adv. 5, 60763 (2015).
25. P. Singh, P. Nath, R. Kumar Arun, S. Mandal and N. Chanda, RSC Adv. 6, 92729 (2016).
26. J. Lu, X. Jiao, D. Chen and W. Li, J. Phys. Chem. C 113, 4012 (2009).
27. Y. He, A. del Valle, Y. Qian and Y.F. Huang, Nanoscale 9, 1559 (2017).
28. V. Dicastro and S. Ciampi, Surf. Sci., 331, 294 (1995).
29. Q. Chen, P. Wu, Z. Dang, N.Zhu, P. Li, J. Wu and X.Wang, Sep. Purif. Technol., 71, 315 (2010).
30. G. Gan, J. Liu, Z. Zhu, Z. Yang, C. Zhang, X. Hou, Chemosphere 168, 254 (2017).
31. A. Babuponnusami and K. Muthukumar, J. Environ. Chem. Eng., 2, 557-572 (2014).
32. R. Li, X. Jin, M. Megharaj, R. Naidu and Z. Chen, Chem. Eng. J., 264, 587 (2015).
33. H. Chen, Z. Zhang, Z.Yang, Q. Yang, B. Li and Z. Bai, Chem. Eng. J., 273, 481 (2015).
34. J. Zhang, X. Zhang and Y. Wang, RSC Adv. 6, 13168 (2016).
35. X. Hu, Y. Liu, G. Zeng, H. Wang, S. You, X. Hu, X. Tan, A. Chen and F. Guo, Chemosphere 127, 35 (2015).
36. C. Zhou, W. Zhang, H. Wang, H. Li, J. Zhou, S. Wang, J. Liu, J. Luo, B. Zou and J. Zhou, Arab J. Sci.
Eng. 39, 6679 (2014).
37. B. Yang, Z. Tian, L. Zhang, Y. Guo and S. Yan, J. of Water Process Engineering, 5, 101 (2015).
38. H. Wang, H.Tian, Z. Hao, J. Environ. Sci-China., 24, 536 (2012).
39. X. Pan, D. Lin, Y. Zheng, Q. Zhang, Y. Yin, L. Cai, H. Fang, Y. Yu, Sci. Rep-Uk., 6, 21332 (2016).