Vibrational spectroscopy of H
2He
+and D
2He
+Oskar Asvanya, Stephan Schlemmera, Ad van der Avoirdb, Tam´as Szidarovszkyc, Attila G. Cs´asz´arc
aI. Physikalisches Institut, Universit¨at zu K¨oln, Z¨ulpicher Str. 77, 50937 K¨oln, Germany
bTheoretical Chemistry, Institute for Molecules and Materials, Radboud University, Nijmegen, The Netherlands
cLaboratory of Molecular Structure and Dynamics, Institute of Chemistry, ELTE E¨otv¨os Lor´and University and MTA-ELTE Complex Chemical Systems Research Group, H-1117 Budapest, P´azm´any P´eter s´et´any 1/A, Hungary
Abstract
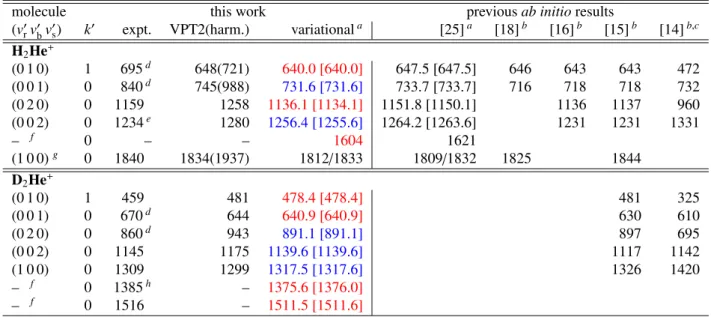
Vibrational modes of the relatively strongly bound H2He+ molecular ion and its deuterated congener D2He+are investigated by low-resolution multi-photon photodissociation spectroscopy, using a combination of a 4 K cryogenic ion-trap machine and the free- electron-laser FELIX. The band origins obtained are fully explained by accurate variational calculations of the rovibrational states of H2He+and D2He+based on the three-dimensional potential energy surface of Koneret al.[Phys. Chem. Chem. Phys.21(2019) 24976]. Results from second-order vibrational perturbation theory, based on a linear H–H–He equilibrium structure, agree well with those of the variational calculations for energies up to about 1300 cm−1. This suggests that H2He+and D2He+may either be considered as linear triatomic molecules with a degenerate bending mode, or as Van der Waals complexes with a strongly hindered rotation of He around the H+2 and D+2 subunits. The variational calculations show that in states close to the dissociation limit,1794 and 1852 cm−1 forpara- andortho-H2He+, respectively, the angular internal motion becomes delocalized. The low-resolution experiments corroborate the linear structure of the ions and identify the bright IR-active HH-stretch fundamental in H2He+at about 1840 cm−1and the DD-stretch fundamental in D2He+at about 1309 cm−1, both with an uncertainty of 0.5 ˙%, in good agreement with the calculations. The experiments also confirm the H+2–He bend and stretch fundamentals calculated at 632 and 732 cm−1and the D+2–He bend and stretch fundamentals at 473 and 641 cm−1, respectively.
Keywords: ion trap, free electron laser, vibrational spectroscopy, H2He+, D2He+
1. Introduction
H2He+is a fundamental open-shell molecular system con- sisting of two protons, oneα-particle, and three electrons. To the best of our knowledge it was first detected, in 1925, in a mass spectrum by Hogness and Lunn [1]. This molecu- lar ion, as well as larger complexes of the He-solvated se- ries H2He+n, have been unambiguously observed by mass- spectrometric means in a drift tube [2] and in He-droplet ex- periments [3].
As the H2He+ molecular ion is composed of the only ele- ments abundantly available at the very beginning of the uni- verse, it might have been formed at the earliest stages of chem- ical evolution. Most importantly, it must have played a crucial role as the intermediate in the fundamental inelastic or reac- tive collisions between H+2 ions and He atoms, as well as in the collision between the first molecule of the primordial universe, the HeH+ion, detected recently [4] in the hot gas of the plan- etary nebula NGC 7027, and hydrogen atoms. Therefore, the detailed knowledge of at least the ˜X2Σ+ potential energy sur- face (PES) of H2He+ [5, 6] is of fundamental importance for astronomy (the excited electronic states of H2He+are well sep- arated from the ground state). Due to the presence of two H atoms, the molecular ion has two nuclear-spin isomers, ortho- andpara-H2He+(a similar statement holds for D2He+).
Email address:asvany@ph1.uni-koeln.de(Oskar Asvany)
The ˜X2Σ+PES of H2He+has been explored experimentally by numerous reactive scattering experiments through the reac- tion H+2(v)+He and its isotopic variants [7, 8, 9, 10, 11], where vis the vibrational quantum number. Due to its endothermicity of 0.806 eV [7], the reaction exhibits strong enhancement upon vibrational excitation.
Experimental investigations of the (ro)vibrational bound states of H2He+ via spectroscopy are extremely sparse. The only investigation available up to date, due to Carrington and co-workers [12, 13], is an unusual one, in which a mass- selected and highly-excited beam of H2He+ions was subjected to microwave radiation. Those ions very close to the dissoci- ation limit were subsequently dissociated by an electric field and the H+2 fragments counted as a function of the excitation frequency. Several microwave and millimeter-wave transitions have been observed for H2He+[13]; in particular, aparatransi- tion close to 21.8 GHz and anorthotransition at 15.2 GHz, ex- hibiting fine- and hyperfine substructure. As the states involved in these transitions are close to the dissociation limit, the inter- pretation of these spectra provided a considerable challenge for first-principles computations [6].
Scattering and photodissociation simulations on the related PESs, as well as bound rovibrational states and transitions be- tween these states in the ground electronic state of H2He+have all been calculated with increasing accuracy during the last decades [6, 12, 14, 15, 16, 17, 18, 19, 20, 21, 22, 23, 24, 25].
Preprint submitted to JMS October 3, 2021
In the most recent work [6], high-levelab initiocomputations were used to construct two very similar analytical PESs, accu- rately including the important long-range part of the interac- tion between H+2 and He. Both PESs feature a global minimum with an equilibrium dissociation energy ofDe=2735 cm−1at the linear H–H–He configuration. One of these PESs, called FCI, is heavily utilized during the present study. In Ref. [6], computations of the bound states on these PESs were exe- cuted with two different variational techniques, one utilizing the DVR3D code [26] and the other a coupled-channels vari- ational method (CCVM) [27]. Both yielded the lowest bound state at −1794 cm−1, which corresponds to a dissociation en- ergy ofD0 =1794 cm−1forpara-H2He+andD0=1852 cm−1 forortho-H2He+(the latter is higher by about 58 cm−1due to dissociation into H+2(j = 1), see also Table 1, where jis the quantum number associated with the rotation of the diatomic H+2 unit). The PES of H2He+( ˜X2Σ+) is thus characterized by a relatively deep well and allows the ion to harbour more than a dozen vibrational states and hundreds of bound rovibrational states with total angular momenta up toJ=21,whereJis the quantum number corresponding to the overall rotation of the molecular ion. In another study, a plethora of rovibrational res- onances [28] with widely different lifetimes were found beyond the dissociation limit, though utilizing a different, less sophisti- cated PES [29]. All the bound states essentially correspond to strongly coupled H+2–He stretching and bending motions, while the H–H stretch motion is expected to be around 1800 cm−1, which is just below the dissociation limit ofortho-H2He+. The high quality of the recent first-principles computations facilitate reliable assignment suggestions [6], in particular for the near- dissociation spectra measured some 20 years ago [13]. Since the dissociation energy is in the infrared range probed by our experiments, one must address the question whether the spec- tral features observed can be interpreted as those belonging to a semirigid linear molecule or require sophisticated varia- tional treatments whereby rigidity of the molecular ion is not assumed.
To the best of our knowledge, no experimental (ro)vibrational spectroscopic data, apart from those al- ready mentioned [12, 13], are available for this molecule and its isotopologues, despite the potential astronomical relevance these data possess. To improve our knowledge about the structure and dynamics of the H2He+ and D2He+ systems, we need to obtain high-resolution rovibrational and rotational spectra of these elusive molecules, preferentially yielding their fundamental transitions and beyond. On our path to generate this knowledge, we present here the first low-resolution vibra- tional fingerprints of H2He+and D2He+, obtained by using a combination of a 4 K cryogenic ion trap apparatus [30] and the widely tunable free electron laser at the FELIX facility [31].
Furthermore, we present accurate variational calculations of the rovibrational states and transitions of H2He+ and D2He+, based on the three-dimensional FCI potential surface described in Ref. [6], as well as second-order vibrational perturbation theory (VPT2) [32, 33, 34] calculations based on the linear H–H–He equilibrium structure.
As to the structure of the rest of this paper, the experimental
W M
M W
P W
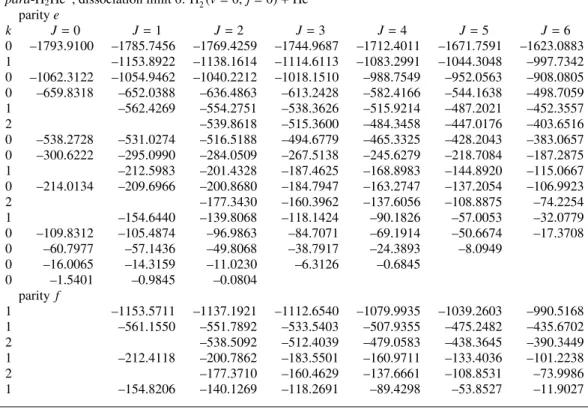
Figure 1: Scheme showing the path of the FELIX laser beam (red) through the 22-pole trapping machine FELION. After exiting the evacuated FELIX beam- line through a window (W, on the very left), the pulsed laser beam enters a purged laser table containing two guiding mirrors (M), which steer the beam through the 22-pole trapping machine into a power meter (P). All windows (W) are made of KRS-5, which permits experiments down to about 250 cm−1. The blue arrow indicates the way of the ion bunches from the storage ion source into the 22-pole ion trap.
details are given in Section 2, while the rovibrational eigen- state calculations are described in Section 3. Sections 4 and 5 summarize the spectral results obtained during this study for H2He+and D2He+, respectively, as well as a comparison of the experimental results with their computational counterparts, aid- ing the understanding of all the experimental features. Finally, in Section 6, we sketch a path how to obtain high-resolution spectra for the two ions investigated. The approach outlined is similar to that taken recently for the proton-helium cations HHe+n [35, 36, 37]. Section 6 also contains a summary of the results of this study.
2. Experimental Details
2.1. Experimental setup
The experimental setup employed during this study is eluci- dated using the scheme shown in Fig. 1. The central part of this experiment is a 22-pole ion trapping machine, called FE- LION [30], which is nearly identical to the one described in detail in Ref. [38]. Molecular ions are produced in an external storage ion source. In this source, electrons with small kinetic energy (<20 eV) are used to ionize (and also fragment) the precursor gas. After mass selection in a linear quadrupole mass filter, an ensemble of several ten thousand ions is injected into the cold 22-pole ion trap [39] and stored there for typically a few seconds. For a standard experiment, the trap is held at its lowest temperature,T =4 K. A∼100 ms-long He pulse at the beginning of the trapping cycle cools the ions and leads to the efficient formation of cation-helium complexes by ternary col- lisions. During the trapping time, the ionic complexes are ex- posed to the tunable IR pulses of FELIX [31] (see Fig. 1). Af- ter the storage period, the ion cloud is extracted from the trap,
mass-selected by a second mass filter, and the number of ions in a pre-selected mass channel is counted by an effective ion counter. Such storage cycles are repeated typically 2-3 times to improve the signal-to-noise ratio, after which the FELIX laser is tuned to the next frequency setting.
The FELIX laser is operated at its maximum repetition rate of 10 Hz. The pulses have an energy content varying from 8 to 14 mJ (at the user station), depending on the wavelength re- gion. The beam enters and exits the 22-pole trapping machine by a pair of KRS-5 windows, after which it is stopped by a power meter (see Fig. 1). The laser power is constantly mon- itored by this meter in order to normalize the obtained spectra to power. The bandwidth of FELIX is transform-limited with a typical resolution of 0.5 % full width at half maximum of the central frequency (e.g.,∆ν=5 cm−1atν=1000 cm−1). With this resolution, we are generally not able to resolve single rovi- brational lines, but can only recover the envelopes of the vi- brational bands. In our experiments, the trapping cycle time of 3 s was synchronized to the frequency of the main electrical power supply. By this, synchronization with the 1 s cycle of the cold head was achieved (important for stable tagging with He at 4 K), as well as synchronization to the 10 Hz laser pulses of FELIX.
2.2. Experimental conditions
In the current experiment, we used hydrogen gas (Linde 6.0) in the ion source to produce H+2. In order to avoid excitation of the produced ions, the electron energy was reduced to about 17 eV and the hydrogen gas was diluted in helium in a ratio 1:4 (H2:He), so that efficient quenching/removal of excited H+2 could occur. Furthermore, the gas pressure in the source was minimized in order to keep the leakage of H2gas into the ion trap region to a minimum. The first quadrupole mass filter was driven at a high frequency of 2.74 MHz in order to efficiently transmit and select the ions with mass 2 u. When H+2 is injected into the 4 K cold ion trap filled with helium (and a small con- tamination of H2), a series of processes occur, which are illus- trated and explained in Fig. 2, showing a typical mass spectrum observed. Similarly, for the investigation of D2He+, a 4:1 mix- ture of helium and deuterium (Praxair 2.8) is admitted to the source, and the first mass filter is set to select D+2 ions at mass 4 u. A typical mass spectrum recorded after a trapping time of 1.5 s is shown in Fig. 3, exemplifying the efficient production of D2He+, as well as D2He+2.
The H2He+and D2He+ions are formed in the trap in the first 100 ms of the He pulse and the rest of the trapping time they are irradiated by the FELIX beam. When the FELIX frequency is on resonance, IR photodissociation (IRPD) occurs,e.g.,
H2He+ n×hν−→ H+2 +He, (1)
which is observed as a decrease in the number of the detected parent ion H2He+(similar for D2He+). In the dissociation pro- cess one photon (n = 1) or more photons (n > 1) may be needed to reach the dissociation limit. These photons might be absorbed sequentially if the time in-between these events is
1 10 100 1000 10000 100000
5 10 15 20
number of ions per trap cycle
mass / u H2+ H2He+
H2He2+ HHe+ HHe2+
HHe3+ H3+
water contamination
Figure 2: A typical mass spectrum illustrating the rich chemistry when H+2 ions are injected into a 4 K cloud of He atoms. The mass-selected H+2 ions have been injected into the 22-pole trap and stopped by a∼100 ms-long He pulse. The resulting ion cloud has been extracted from the trap after a trapping time of 1.5 s. Small H2contaminations in the trap (contained in the He pulse and primarily leaking in from the ion source) lead to the efficient formation of H+3 (mass 3 u) by the reaction H+2 +H2→H+3 +H.Additionally,excited hydrogen ions initiate the reaction H+2∗+He→HHe++H [8, 10]. Further ternary collisions with He atoms lead from HHe+(mass 5 u) to HHe+2 (mass 9 u), and even HHe+3 can be detected (mass 13 u, green arrow). Of interest in this work is the ternary reaction H+2 +2He→H2He++He, leading to the formation of H2He+(mass 6 u). A second He atom can also be attached, leading to H2He+2, but not a third (see red arrow), being an indication that H2He+2has a linear symmetric configuration, in accordance with ourab initiocomputations (not detailed). The ion signal at mass 18 and 19 u is due to water contamination contained in the He pulse.
1 10 100 1000 10000
5 10 15 20
number of ions per trap cycle
mass / u D2+
D2He+
D2He2+ DHe+ DHe2+
DHe3+
water contamination injected ions after 1.5s trap
Figure 3: Same as Fig. 2 but with D+2 injected into the 4 K cold trap filled with an intense He pulse at the beginning of the trapping sequence. Shown is the mass-selected injected ion ensemble and the ion ensemble after 1.5 s trapping time, during which reactions with He and small contaminations of H2
and D2occur. Again, up to two He atoms can attach to D+2 under the current experimental conditions (D2He+3counts are negligible, see red arrow).
shorter than the radiative lifetime of the excited state. The cor- responding excitation process is called multiple photon absorp- tion. Alternatively, because of the very short light pulses of the FELIX laser the excitation process can also occur in a coherent fashion called multi-photon absorption. The actual mechanism 3
will depend on several factors and lead to different band-profiles as will be discussed below.
The spectral signal for the measurements is obtained by counting the number of parent ions, c(f), as function of the FELIX frequency f (in cm−1). This is converted into a normal- ized spectrum by usings(f)=(c0−c(f))/(c0·P(f)), withP(f) being the frequency-dependent laser power and c0 the H2He+ (or similarly D2He+) counts with the FELIX radiation being off-resonant.
3. Theory
3.1. Preliminaries
In its ˜X2Σ+ ground electronic state H2He+may be consid- ered as a semi-rigid open-shell molecular ion with a linear equi- librium structure ofC∞vpoint-group symmetry. Nevertheless, especially in its higher rovibrational states, we may also con- sider H2He+as a more or less floppy Van der Waals complex that tunnels between two equivalent linear equilibrium struc- tures with He on either side of the H+2 subunit and assign it to the permutation-inversion symmetry group G4, also called molecular-symmetry (MS) groupC2v(M) [40]. As mentioned above, this molecular ion has two nuclear-spin isomers, ortho andpara (o/p). The fine and hyperfine splittings in the rovi- brational spectrum of H2He+,due to coupling of electron spin and total nuclear spin, and coupling of the resultant to the ro- tational angular momentum of the nuclei, are predicted to be quite small, on the order of 0.003 cm−1 [6, 12, 18]. There- fore, they can be safely neglected during the rovibrational cal- culations and the simulation of the low-resolution results stud- ied here. When considering H2He+ and D2He+ as semi-rigid molecules, their vibrational modes can be approximately de- scribed by the(v1v2v3) ≡ (vrvbvs)notation [14, 15], withvi labeling the quanta for the H–H stretch, H–H–He bend, and H–
He stretch, respectively. At higher vibrational excitation this notation is not particularly meaningful due to the strong mix- ing of the modes. The bend mode labeled withv2 has vibra- tional angular momentumlv2 ranging from−v2 to+v2in steps of 2. Furthermore,Jis the quantum number corresponding to the overall rotation of the molecular ion. The quantum number k, the projection of J and of jH+2 or jD+2 onto the axis R that points from the H+2(D+2) center of mass to the He nucleus (see Fig. 4), is the same aslv2 in the semi-rigid molecule notation.
Usually one labels states with the absolute value ofkand dis- tinguishes the parity-adapted plus and minus combinations of +kand−kfunctions by their spectroscopic parityeand f [41].
3.2. Structure and energetics
The open-shell H2He+ and D2He+ molecular ions contain only three electrons; thus, their electronic structure can be investigated at the full configuration interaction (FCI) level, which is equivalent to coupled cluster theory with all single, double, and triple substitutions (CCSDT) [42]. Although an ac- curate PES at the FCI level was already calculated by Koner et al. [6] and we used this potential in our variational calcula- tions, we performed additional electronic-structure calculations
j
k R
J
r
C.M.
Figure 4: Sketch of the angular momentum vectors in the H2He+system. J andjH+
2 have the same projectionkonto theRaxis. The origin ofJhas been shifted from the center-of-mass of the overall complex (C.M.) to the center-of- mass of H+2 for easier viewing.
in view of our VPT2 study of the rovibrational levels and in order to compute the dipole moment surface that we used in our calculations of the transition line strengths. We utilized the CFOUR [43], the MRCC [42, 44, 45], and the Gaussian˙16 [46]
codes and employed the aug-cc-pVTZ and aug-cc-pVQZ basis sets, members of the correlation-consistent (cc) family [47] of atom-centered, fixed-exponent, Gaussian basis functions.
According to the aug-cc-pVQZ FCI (CCSDT) optimization, the equilibrium HH and HHe distances in the global minimum of ˜X2Σ+H2He+ are re(HH)=1.098 Å andre(HHe)=1.024 Å, respectively. The transition state (TS) connecting the two equivalent minima of H2He+ (He on the left and right of the central H+2 unit) is characterized by re(HH) = 1.049 Å and re(HHe)=2.159 Å (no primary bond between H and He) and it hasC2vpoint-group symmetry. The energy difference between the global minimum and the TS, without vibrational correction, is 2383 cm−1; thus, somewhat less than De. In line with the structural characteristics of the TS, its harmonic wavenumbers are 2361(a1), 227(a1), and 278i(b2) cm−1. All these values were obtained at the aug-cc-pVQZ FCI level. Thus, at the highest energies of IR excitation the dynamics switches from a single- minimum to a symmetric double-well problem, with appropri- ate consequences for the measurable spectra of the molecular ion.
3.3. VPT2 results
For H2He+, the harmonic fundamentals at the aug-cc-pVQZ FCI[UCCSD(T)] level are 1937[1940], 721[730], and 988[992]
cm−1, showing the consistency of the results. The VPT2 anhar- monic corrections [34] computed are only substantial forν3, at the aug-cc-pVQZ FCI[UCCSD(T)] level they are−103(−100),
−73(−79), and −242(−247) cm−1, respectively (quite good agreement even for the anharmonic corrections). Thus, theab initioVPT2 computations predict an intenseν1(σ+) fundamen- tal at 1835 cm−1. Furthermore, the same VPT2 computations predict the first overtone of the bend, 2ν2, at 1258 cm−1, and the overtone of the HHe stretch, 2ν3, at 1280 cm−1.
At the aug-cc-pVQZ FCI[UCCSD(T)] levels the harmonic fundamentals of D2He+ are 1371[1370], 523[523], and
807[806] cm−1, adding confidence to the reliability of the com- puted results. The VPT2 results of this study, corresponding to the aug-cc-pVQZ FCI level of electronic-structure theory, are as follows. The anharmonic DD stretch fundamental,ν1, is at 1299 cm−1and it has high intensity. The doubly-degenerate bending fundamental, ν2, is at 481 cm−1, while the DHe stretch funda- mental,ν3, is at 644 cm−1. The VPT2 computations predict the first overtone of the bend at 943 cm−1, with a surprisingly large intensity, larger than that of the DHe stretch fundamental. The overtone of the DHe stretch, 2ν3, is at 1175 cm−1, with an inten- sity similar to that of the other overtone. There are no predicted bands of any intensity between 1300 and 1800 cm−1. The first band with significant intensity is the stretch combination band, ν1+ν3, at 1975 cm−1.
The vibrational anharmonicities mentioned above, obtained through the VPT2 scheme [34], have been computed with the help of the CFOUR [43] package. The VPT2 treatment takes into account neither that the lowest dissociation energy (D0) of H2He+ is less thanν1 nor the double-well nature of the PES of H2He+. When the VPT2 results are meaningful, that is at lower-energy excitations, they fully support the variational re- sults of this study (vide infra). Thus, in what follows only the variational results will be discussed in detail; the VPT2 results are listed, alongside the variational ones, in Table 3 (vide infra).
3.4. Dynamics
Two different, independently coded, variational nuclear- motion approaches were employed to calculate the rovibra- tional energy levels and wavefunctions of H2He+and D2He+. In the first one the Tl←k one-photon dipole transition ampli- tudes in the spectrum of H2He+ and D2He+ were evaluated as Tl←k ∝ hΨl|µeˆ (p)|Ψkiδ(El−Ek±~ωp), wheree(p) and~ωp are the polarization vector and the photon energy of the probe pulse, respectively,andµis the dipole vector. The rovibrational
|Ψiiwave functions and theEieigenenergies were obtained by solving the time-independent rovibrational Schr¨odinger equa- tion in full dimension, employing the variational D2FOPI pro- tocol [48] and the PES of Koner et al. [6]. In the D2FOPI program, the rovibrational Hamiltonian of a triatomic molecule is constructed in an orthogonal coordinate system (Jacobi coor- dinates in this study) using a mixed discrete variable representa- tion (DVR) and finite basis representation [49] along the vibra- tional degrees of freedom, and symmetry adapted Wigner ma- trices as rotational basis functions. TheC2v(M) molecular sym- metry is utilized as described in Ref. [50], and the eigenpairs are obtained by a variant of the L´anczos iterative eigensolver.
For each value of Jand each irreducible representation of the C2v(M) molecular symmetry group, we employed in the calcu- lations a complete set of rotational basis functions, 35 potential- optimized (PO) spherical DVR basis functions [48] along ther coordinate (H-H stretch), 75 PO spherical DVR basis functions along theRcoordinate (H2–He stretch), and 30 associated Leg- endre functions along the Jacobian angle coordinateθ. The co- ordinate rangesR∈(0,15)a0andr∈(0,4)a0, and the atomic masses mH = 1.007 825 032 1 u, mD = 2.014 101 778u, and mHe =4.002 603 249 7uwere employed. Because the FELIX
pulse was linearly polarized during the experiments, the frame- work detailed in Ref. [23] could be followed for the theoretical evaluation of the dipole matrix elements.
The second variational approach employed is the coupled- channels variational method (CCVM) [27]. This method was already used in Ref. [6] to compute the bound rovibrational states of H2He+, here it is also used to compute the bound states of D2He+. It is similar to a coupled-channels scattering cal- culation, but instead of propagating the radial coordinateRto solve the CC differential equations it uses a basis also inRand obtains the desired number of eigenstates of the Hamiltonian matrix with the iterative Davidson algorithm [51]. The angular channel basis expressed in body-fixed (BF) coordinates is de- scribed for the most general case in Eq. (16) of Ref. [52], here it just contains symmetry-adapted products of spherical harmon- ics for the internal rotation of H+2 in the H2He+ion and sym- metric rotor functions for the overall rotation of the ion. The spherical harmonic basis was limited to jH+2 from 0 to 19, with even values of jH+2 forpara-H+2 and odd values forortho-H+2. Therbasis contained thev=0−7 eigenfunctions of the free H+2 Hamiltonian for jH+
2 =0 on a grid of 110 equidistant points withr=0.25−5.5a0. The basis inR, the He-H+2center-of-mass distance, was obtained as described in Ref. [6] on an equidis- tant 357-point grid withR = 2−50a0. In order to converge also near-dissociative states, we included 120 radial basis func- tions in the 3D direct-product basis. We used somewhat finer grids in our CCVM calculations for D2He+, but the same basis except in the D+2 vibrational coordinaterwhere the basis was limited tov=0−5, because we established that this is amply sufficient for convergence. Even values of jD+2 correspond to ortho-D+2 and odd values topara-D+2. In the calculations of the vibrational bases in the coordinatesrandR, as well as in the full 3D calculations we replaced the hydrogen atomic mass by that of deuterium.
The dipole moment surfaces (DMS) of H2He+ and D2He+ were obtained from theab initiovalues calculated on a uniform grid in the Jacobi coordinatesr,R, andθ, consisting of 11 900 points. Thez- andx-components of the dipole vectorµin the BF frame were replaced by spherical components: µ0 = µz
andµ±1 = ∓µx/√
2. Then, they were fitted with the appro- priate angular expansion functions given in general in Eq. (36) of Ref. [52], which in this case are simply Racah-normalized spherical harmonicsCL,M(θ,0) withMvalues 0,±1 equal to the corresponding spherical dipole components andLranging from 0 to 14 in steps of 2. Theab initiodipole values were calculated forR=(1,10)a0andr=(0.5,4)a0. Since atR=10a0they are already very close to the isotropic long-range dipole mo- ment that originates from a charge of+e at the center of H+2 and the charge-induced dipole on the He atom, they could be extended to the largestRvalue of 50a0in our grid with the use of the corresponding long-range formula. The extension to the fullrgrid is not important, since all of the calculated 3D wave functions have completely decayed forr<0.5a0andr>4a0. After these extensions of the dipole function, we obtained its values on ourRandrgrids by cubic-spline interpolations and calculated its matrix elements over the vibrational bases inR andr. A general formula for the angular matrix elements of the
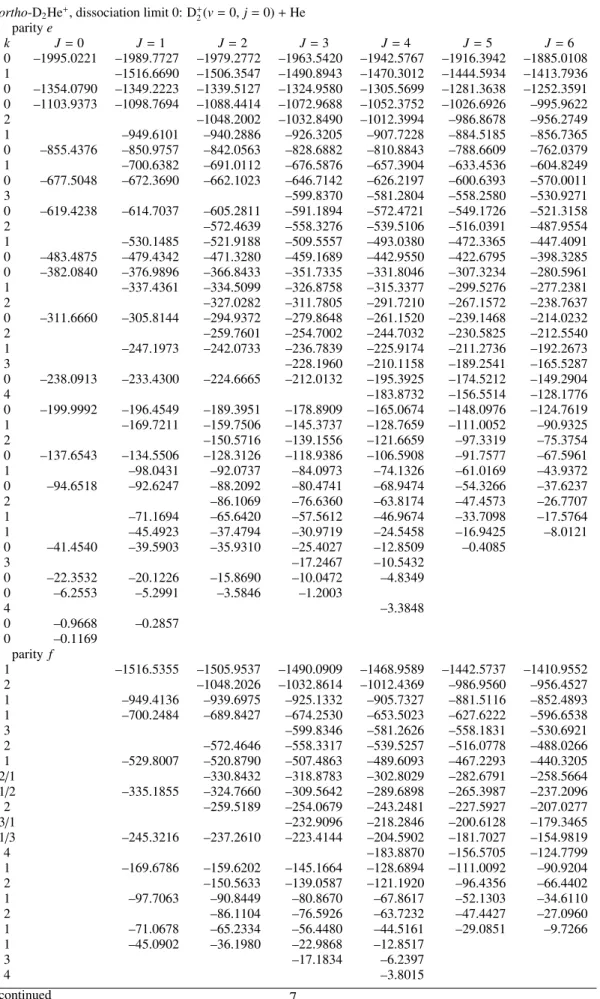
Table 1: Rovibrational energy levels of H2He+from CCVM calculations. The approximate quantum numberkcorresponds to the projection ofJonto the H+2–He axisR; different values ofkare mixed by Coriolis coupling.
para-H2He+, dissociation limit 0: H+2(v=0,j=0)+He paritye
k J=0 J=1 J=2 J=3 J=4 J=5 J=6
0 –1793.9100 –1785.7456 –1769.4259 –1744.9687 –1712.4011 –1671.7591 –1623.0883 1 –1153.8922 –1138.1614 –1114.6113 –1083.2991 –1044.3048 –997.7342 0 –1062.3122 –1054.9462 –1040.2212 –1018.1510 –988.7549 –952.0563 –908.0805 0 –659.8318 –652.0388 –636.4863 –613.2428 –582.4166 –544.1638 –498.7059 1 –562.4269 –554.2751 –538.3626 –515.9214 –487.2021 –452.3557
2 –539.8618 –515.3600 –484.3458 –447.0176 –403.6516
0 –538.2728 –531.0274 –516.5188 –494.6779 –465.3325 –428.2043 –383.0657 0 –300.6222 –295.0990 –284.0509 –267.5138 –245.6279 –218.7084 –187.2875 1 –212.5983 –201.4328 –187.4625 –168.8983 –144.8920 –115.0667 0 –214.0134 –209.6966 –200.8680 –184.7947 –163.2747 –137.2054 –106.9923
2 –177.3430 –160.3962 –137.6056 –108.8875 –74.2254
1 –154.6440 –139.8068 –118.1424 –90.1826 –57.0053 –32.0779
0 –109.8312 –105.4874 –96.9863 –84.7071 –69.1914 –50.6674 –17.3708 0 –60.7977 –57.1436 –49.8068 –38.7917 –24.3893 –8.0949
0 –16.0065 –14.3159 –11.0230 –6.3126 –0.6845
0 –1.5401 –0.9845 –0.0804
parity f
1 –1153.5711 –1137.1921 –1112.6540 –1079.9935 –1039.2603 –990.5168 1 –561.1550 –551.7892 –533.5403 –507.9355 –475.2482 –435.6702
2 –538.5092 –512.4039 –479.0583 –438.3645 –390.3449
1 –212.4118 –200.7862 –183.5501 –160.9711 –133.4036 –101.2238
2 –177.3710 –160.4629 –137.6661 –108.8531 –73.9986
1 –154.8206 –140.1269 –118.2691 –89.4298 –53.8527 –11.9027
ortho-H2He+, dissociation limit 58.3124 cm−1: H+2(v=0,j=1)+He paritye
k J=0 J=1 J=2 J=3 J=4 J=5 J=6
0 –1793.9093 –1785.7450 –1769.4254 –1744.9683 –1712.4008 –1671.7590 –1623.0884 1 –1153.9249 –1138.1849 –1114.6224 –1083.2960 –1044.2872 –997.7037 0 –1062.2765 –1054.9132 –1040.1934 –1018.1303 –988.7427 –952.0532 –908.0861 0 –657.8564 –650.1900 –634.8830 –611.9896 –581.5960 –543.8286 –498.8688 1 –564.5792 –555.6514 –539.3139 –516.2964 –486.9120 –451.4157
2 –538.8675 –514.1997 –483.2973 –446.3583 –403.3916
0 –537.5536 –530.4963 –516.2789 –494.6767 –465.3467 –427.9695 –382.5138 1 –263.1765 –252.2197 –236.4432 –216.0998 –191.1843 –161.6599 0 –254.1435 –248.6453 –237.5731 –221.0038 –199.4074 –173.4850 –143.7602 0 –189.9439 –186.0880 –176.8071 –161.4668 –139.9266 –112.4335 –79.6339
1 –174.2914 –159.5639 –138.4376 –110.7061 –76.0767 –34.5730
2 –127.7872 –110.4400 –87.4584 –58.9374 –25.0044
1 –68.8869 –60.5497 –48.3629 –32.5161 –13.1131 9.8467
0 –48.2670 –44.8744 –38.1982 –28.4248 –15.7706 –0.4739 17.2797
1 –27.1164 –15.6317 –27.3970 1.6627 37.3617 55.6235
0 18.4100 22.3442 28.7083 0.9802 20.9859 40.5563
1 30.4736 36.4081 36.5138 45.6453 55.2153
0 39.5628 42.9216 49.2003 44.4892 54.0577
1 54.4848 56.6101 55.4116
0 55.6552 56.9079 58.2551
parity f
1 –1153.6077 –1137.2268 –1112.6860 –1080.0223 –1039.2852 –990.5377 1 –563.6444 –553.6612 –535.6203 –510.2378 –477.7349 –438.2883
2 –537.9399 –511.6998 –478.2236 –437.4526 –389.4213
1 –262.8018 –250.8828 –233.3604 –210.5984 –182.9822 –150.8663
1 –175.9529 –163.0626 –143.4725 –117.0023 –83.6388 –43.8879
2 –127.8158 –110.5865 –87.9073 –59.9876 –26.9424
1 –68.6670 –59.9106 –47.1821 –30.8058 –11.0218 12.1083
1 –27.5906 –16.9382 –27.3987 1.6625 37.3375
1 29.9116 34.5573 –1.1404 18.9917 40.8410
1 54.5926 56.3036 41.4620 50.5264
Table 2: Rovibrational energy levels of D2He+from CCVM calculations. The approximate quantum numberkis the projection ofJon the D+2–He axisR; different values ofkare mixed by Coriolis coupling. This mixing is stronger for the higher states.
ortho-D2He+, dissociation limit 0: D+2(v=0,j=0)+He paritye
k J=0 J=1 J=2 J=3 J=4 J=5 J=6
0 –1995.0221 –1989.7727 –1979.2772 –1963.5420 –1942.5767 –1916.3942 –1885.0108 1 –1516.6690 –1506.3547 –1490.8943 –1470.3012 –1444.5934 –1413.7936 0 –1354.0790 –1349.2223 –1339.5127 –1324.9580 –1305.5699 –1281.3638 –1252.3591 0 –1103.9373 –1098.7694 –1088.4414 –1072.9688 –1052.3752 –1026.6926 –995.9622
2 –1048.2002 –1032.8490 –1012.3994 –986.8678 –956.2749
1 –949.6101 –940.2886 –926.3205 –907.7228 –884.5185 –856.7365 0 –855.4376 –850.9757 –842.0563 –828.6882 –810.8843 –788.6609 –762.0379 1 –700.6382 –691.0112 –676.5876 –657.3904 –633.4536 –604.8249 0 –677.5048 –672.3690 –662.1023 –646.7142 –626.2197 –600.6393 –570.0011
3 –599.8370 –581.2804 –558.2580 –530.9271
0 –619.4238 –614.7037 –605.2811 –591.1894 –572.4721 –549.1726 –521.3158
2 –572.4639 –558.3276 –539.5106 –516.0391 –487.9554
1 –530.1485 –521.9188 –509.5557 –493.0380 –472.3365 –447.4091 0 –483.4875 –479.4342 –471.3280 –459.1689 –442.9550 –422.6795 –398.3285 0 –382.0840 –376.9896 –366.8433 –351.7335 –331.8046 –307.3234 –280.5961 1 –337.4361 –334.5099 –326.8758 –315.3377 –299.5276 –277.2381
2 –327.0282 –311.7805 –291.7210 –267.1572 –238.7637
0 –311.6660 –305.8144 –294.9372 –279.8648 –261.1520 –239.1468 –214.0232
2 –259.7601 –254.7002 –244.7032 –230.5825 –212.5540
1 –247.1973 –242.0733 –236.7839 –225.9174 –211.2736 –192.2673
3 –228.1960 –210.1158 –189.2541 –165.5287
0 –238.0913 –233.4300 –224.6665 –212.0132 –195.3925 –174.5212 –149.2904
4 –183.8732 –156.5514 –128.1776
0 –199.9992 –196.4549 –189.3951 –178.8909 –165.0674 –148.0976 –124.7619 1 –169.7211 –159.7506 –145.3737 –128.7659 –111.0052 –90.9325
2 –150.5716 –139.1556 –121.6659 –97.3319 –75.3754
0 –137.6543 –134.5506 –128.3126 –118.9386 –106.5908 –91.7577 –67.5961
1 –98.0431 –92.0737 –84.0973 –74.1326 –61.0169 –43.9372
0 –94.6518 –92.6247 –88.2092 –80.4741 –68.9474 –54.3266 –37.6237
2 –86.1069 –76.6360 –63.8174 –47.4573 –26.7707
1 –71.1694 –65.6420 –57.5612 –46.9674 –33.7098 –17.5764
1 –45.4923 –37.4794 –30.9719 –24.5458 –16.9425 –8.0121
0 –41.4540 –39.5903 –35.9310 –25.4027 –12.8509 –0.4085
3 –17.2467 –10.5432
0 –22.3532 –20.1226 –15.8690 –10.0472 –4.8349
0 –6.2553 –5.2991 –3.5846 –1.2003
4 –3.3848
0 –0.9668 –0.2857
0 –0.1169
parity f
1 –1516.5355 –1505.9537 –1490.0909 –1468.9589 –1442.5737 –1410.9552
2 –1048.2026 –1032.8614 –1012.4369 –986.9560 –956.4527
1 –949.4136 –939.6975 –925.1332 –905.7327 –881.5116 –852.4893 1 –700.2484 –689.8427 –674.2530 –653.5023 –627.6222 –596.6538
3 –599.8346 –581.2626 –558.1831 –530.6921
2 –572.4646 –558.3317 –539.5257 –516.0778 –488.0266
1 –529.8007 –520.8790 –507.4863 –489.6093 –467.2293 –440.3205
2/1 –330.8432 –318.8783 –302.8029 –282.6791 –258.5664
1/2 –335.1855 –324.7660 –309.5642 –289.6898 –265.3987 –237.2096
2 –259.5189 –254.0679 –243.2481 –227.5927 –207.0277
3/1 –232.9096 –218.2846 –200.6128 –179.3465
1/3 –245.3216 –237.2610 –223.4144 –204.5902 –181.7027 –154.9819
4 –183.8870 –156.5705 –124.7799
1 –169.6786 –159.6202 –145.1664 –128.6894 –111.0092 –90.9204
2 –150.5633 –139.0587 –121.1920 –96.4356 –66.4402
1 –97.7063 –90.8449 –80.8670 –67.8617 –52.1303 –34.6110
2 –86.1104 –76.5926 –63.7232 –47.4427 –27.0960
1 –71.0678 –65.2334 –56.4480 –44.5161 –29.0851 –9.7266
1 –45.0902 –36.1980 –22.9868 –12.8517
3 –17.1834 –6.2397
4 –3.8015
continued 7
para-D2He+, dissociation limit 29.4092 cm−1: D+2(v=0,j=1)+He paritye
k J=0 J=1 J=2 J=3 J=4 J=5 J=6
0 –1995.0221 –1989.7727 –1979.2772 –1963.5420 –1942.5767 –1916.3942 –1885.0109 1 –1516.6691 –1506.3548 –1490.8944 –1470.3013 –1444.5935 –1413.7937 0 –1354.0790 –1349.2222 –1339.5126 –1324.9580 –1305.5699 –1281.3638 –1252.3591 0 –1103.9344 –1098.7670 –1088.4398 –1072.9682 –1052.3757 –1026.6942 –995.9646
2 –1048.1989 –1032.8483 –1012.3993 –986.8679 –956.2750
1 –949.6151 –940.2917 –926.3212 –907.7210 –884.5145 –856.7312 0 –855.4350 –850.9734 –842.0546 –828.6872 –810.8841 –788.6614 –762.0390 1 –700.7546 –691.0669 –676.5691 –657.3000 –633.3099 –604.6594 0 –677.4620 –672.3339 –662.0807 –646.7091 –626.2301 –600.6612 –570.0280
3 –599.8663 –581.2798 –558.2525 –530.9465
0 –618.9803 –614.3166 –604.9999 –591.0481 –572.4787 –549.2979 –521.4931
2 –572.2231 –558.1931 –539.4519 –515.9995 –487.8743
1 –530.4586 –522.0794 –509.5380 –492.8575 –472.0525 –447.1121 0 –483.3874 –479.3507 –471.2736 –459.1488 –442.9650 –422.7072 –398.3562 0 –373.8092 –369.8660 –361.8472 –349.5398 –332.7356 –311.2995 –285.2030 1 –348.8296 –340.1571 –326.8840 –309.2554 –287.8906 –263.7827
2 –320.6005 –304.3300 –284.3787 –262.0074 –237.5331
0 –298.9760 –295.8132 –289.3869 –279.4115 –265.1799 –245.3822 –219.4627
3/2 –251.8539 –241.3644 –225.9238 –205.5897
2/3 –254.3501 –241.2252 –227.0289 –210.0001 –190.0986
1 –252.0377 –240.8280 –227.1402 –210.9442 –191.4041 –167.9858 0 –234.7883 –230.8583 –222.8221 –210.4935 –193.9968 –173.6022 –149.4335
4 –181.7407 –154.5074 –122.8192
1 –194.6516 –187.0706 –175.8354 –161.0526 –142.8278 –121.2324
1 –162.1476 –152.6767 –138.4157 –119.4188 –96.2313 –72.9984
1 –115.0155 –110.5440 –103.8982 –94.8314 –82.5356 –63.0884
0 –116.1312 –112.6264 –105.9378 –96.3418 –84.3498 –70.5880 –55.1555
3 –93.6074 –80.6222 –64.2253 –44.3454
0 –92.6281 –89.7260 –83.8810 –75.1400 –63.5646 –49.1575 –32.0443
2 –67.2018 –56.5508 –43.2575 –28.3368 –11.2081
0/1 –72.7767 –70.7329 –64.0231 –54.8286 –42.4747 –26.4694 –7.6868
1/0 –69.3838 –60.9882 –47.3677 –28.8594 –7.2580 12.7821
2 –42.8938 –33.5328 –20.1733 –1.0292 14.9488
1 –21.4320 –17.3961 –11.4242 –3.5288 6.2538 20.1412
3 –7.2584 0.7089 7.6430 26.5976
0 –13.7453 –12.1959 –9.1862 –4.8452 11.0358 26.6657
1 1.3535 7.1043 14.3332 21.1633
0/1 16.6751 17.3402 19.6076 22.7282 26.0148
1/0 18.4618 21.1874 25.2904
1/0 27.3402 28.1537 29.1114
0/1 26.6910 28.2478 29.3445 parity f
1 –1516.5356 –1505.9538 –1490.0910 –1468.9590 –1442.5738 –1410.9553
2 –1048.2014 –1032.8609 –1012.4373 –986.9572 –956.4546
1 –949.4194 –939.7027 –925.1377 –905.7363 –881.5142 –852.4908 1 –700.3920 –689.9734 –674.3653 –653.5920 –627.6865 –596.6914
3 –599.8635 –581.2596 –558.1702 –530.7013
2 –572.2334 –558.2409 –539.5802 –516.2557 –488.2826
1 –530.1651 –521.1868 –507.7187 –489.7576 –467.2961 –440.3198 1 –349.8114 –342.8142 –331.5706 –315.8942 –295.7604 –271.2521
2 –320.5937 –304.0311 –282.8609 –257.3697 –228.0515
3/2 –252.5279 –243.2243 –229.6539 –211.7034
2/3 –254.4782 –240.8455 –225.6176 –206.6407 –183.8732
1 –251.5912 –239.2032 –223.5438 –204.7831 –182.6063 –156.7396
4 –181.7481 –154.5147 –122.7532
1 –194.5276 –186.7114 –175.1632 –160.0491 –141.5459 –119.8308
1 –161.9222 –151.9965 –137.0362 –117.0321 –92.2139 –65.5319
1 –114.3652 –108.7563 –100.5717 –89.8754 –76.4134 –57.2112
3 –93.5988 –80.5846 –64.1527 –44.2571
2 –67.2911 –56.7261 –43.2744 –27.7342 –10.8509
1 –70.8379 –62.7981 –51.0121 –35.7324 –17.9346 1.0107
2 –42.9583 –33.8232 –20.9170 –3.2098 18.0102
1 –21.5098 –17.5903 –11.7284 –3.8875 6.1110 20.6678
3 –7.2595 11.0208 27.0800
1 1.1218 6.6184 13.9143 21.1628
1 17.6248 20.1151 24.1565 29.3341
8
dipole function over the BF basis is given in the Appendix of Ref. [53], here it simply contains products of Wigner 3-jsym- bols. Replacing the center-of-mass coordinates and the basis of H2He+by those of D2He+yields the dipole function of D2He+. Finally, we generated theoretical line lists for both H2He+and D2He+by computing the frequencies and dipole transition mo- ments for all allowed transitions between the calculated bound rovibrational eigenstates.
3.5. Rovibrational energy levels and transitions
The rovibrational energy levels of H2He+ and D2He+, ob- tained by the CCVM method, are listed in Tables 1 and 2, re- spectively. The levels from the D2FOPI calculations calculated on the same 3D potential surface all agree with these levels to better than 0.5 cm−1. This holds even for levels close to the dis- sociation limit, which nicely confirms that both calculations are correct and precise. The first phenomenon one can observe in these tables is that the lower levels ofpara-H2He+and those of ortho-H2He+have almost the same energies, just as the lower levels ofortho-D2He+and those ofpara-D2He+. This indicates that in their lower rovibrational states the complexes are quite rigid. The levels above about−500 cm−1 become less similar for theparaandorthospecies; their energies differ more and more when they get closer to the dissociation limit. The second observation is that the spacings between the levels with increas- ing values of J, i.e., the corresponding rotational constants, become smaller with increasing energy. This implies that the higher states become more and more diffuse or, in other words, that the average distanceRbetween the subunits increases with the energy. Otherpoints worth mentioning are that D2He+has a substantially smaller zero-point energy,i.e., a largerD0value, than H2He+and that D2He+has many more bound rovibrational states than H2He+.
Among the states in Tables 1 and 2 one may distinguish the three fundamental excitations in the modes ν1 ≡ νr,ν2 ≡ νb, andν3≡νs. Thev1=1 excited state lies above the dissociation limit ofpara-H2He+, it is probably a resonance, but it is a bound state inortho-H2He+, because of its largerD0value. Actually we find two states with a substantial amount of H-H stretch character, at energies 18.4 and 39.6 cm−1for J=0. The band origins of the excitations to these states from the ground state are 1812.3 and 1833.5 cm−1. There are two of them because the H–H stretch mode couples with the bend and stretch modes of the H2He+ ion. In the D2He+ ion only a single state has dominant D-D stretch character, at −677.5 cm−1 for J = 0, which corresponds to a band origin of 1317.5 cm−1. As one will see below, this is reflected in the experimental spectra by the width and shape of the corresponding peaks in the H2He+ and D2He+spectra.
The bend fundamental mode (v2 = 1) in a linear triatomic molecule is degenerate and has a vibrational angular momen- tumlv2 =±1. In Table 1 this excited state is at−1153.9 cm−1 for H2He+and has a projection angular momentumk=1 that corresponds with theselv2 values. Theν2excitation energy is thus640.0cm−1. Table 2 shows that the bend excited state in D2He+has an energy of−1516.6 cm−1and this corresponds to an excitation energy of478.4cm−1.
0.1 0.1
0.2 0.2
0.3 0.3
0.4 0.4
0.5 0.5
0.6 0.6 (a)
2 3 4 5
R (a0) 0
30 60 90 120 150 180
(degrees)
-0.4-0.3 -0.2 -0.1
-0.1 0.1 0.1
0.2 0.2 0.30.4 (b)
2 3 4 5
R (a0) 0
30 60 90 120 150 180
(degrees)
-0.3 -0.3
-0.2 -0.2
-0.1 -0.1
0.1 0.1
0.2 0.2
0.3 0.3
0.4 0.4 (c)
2 3 4 5
R (a0) 0
30 60 90 120 150 180
(degrees) -0.2
-0.2
-0.1
-0.1
-0.1 -0.1
0.1 0.1
0.2 0.2
0.3 0.3
0.4 0.4 (d)
2 3 4 5
R (a0) 0
30 60 90 120 150 180
(degrees)
-0.1 -0.1
0.1 0.1
0.1
0.1
0.2 0.2
0.2 0.2
0.3 0.3
0.3 0.3
(e)
2 3 4 5
R (a0) 0
30 60 90 120 150 180
(degrees)
-0.2 -0.2
-0.1 -0.1
-0.1 -0.1
0.1 0.1 (f)
2 3 4 5
R (a0) 0
30 60 90 120 150 180
(degrees)
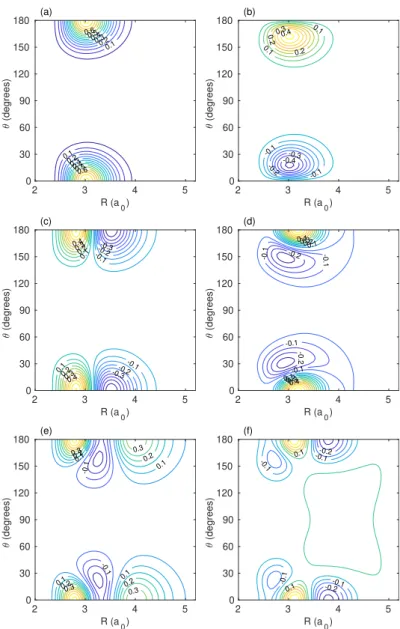
Figure 5: Wave-function contour plots of some states inpara-H2He+with the H–H distance fixed atr=2.1a0. Panel (a) shows the groundJ =0 state at energy−1793.9 cm−1, panel (b) thev2=1 bend excited state withk=J=1 at−1153.9 cm−1, panel (c) thev3=1 H+2–He stretch excited state withJ=0 at−1062.3 cm−1, panel (d) thev2 = 2 bend overtone state withJ =k = 0 at−659.8 cm−1, panel (e) thev3 = 2 stretch overtone state withJ = 0 at
−538.3 cm−1, and panel (f) theJ=0 state at−300.6 cm−1.
Thev3 =1 state excited in the H+2–He stretch mode lies at
−1062.3 cm−1 in H2He+ and the corresponding fundamental excitation energy is 731.6 cm−1. In D2He+, the D+2–He excited state lies at −1354.1 cm−1 and thev3 = 1 band origin is at 640.9cm−1.
A bend overtone (v2 = 2) and a stretch overtone (v3 = 2) state of H2He+can also be found in Table 1. The bend overtone level withlv2 =0 at−659.8 cm−1and the stretch overtone level at−538.3 cm−1, both for J = 0, correspond to band origins of 1134.1and 1255.6 cm−1, respectively. The corresponding J=0 overtone levels of D2He+in Table 2 are at−1103.8 and
−855.4 cm−1, which corresponds to band origins of891.1and 1139.6 cm−1, respectively.
9
The character of these states is illustrated in the wave- function contour plots of Fig. 5. They are displayed forpara- H2He+, but are very similar for ortho-H2He+, except that for the latter system they have a node determined by symmetry at θ = 90◦. For D2He+ they are qualitatively similar. The plot in Fig. 5(a) shows that the ground state is quite well lo- calized in the region of the two equivalent minimaof the PES.
The wave function has equal amplitude and the same sign in the minima forpara-H2He+, and opposite sign (not shown) for ortho-H2He+. It has a negligible amplitude between the two minima, however, which shows that there is practically no tun- neling between the structures localized at the two minima. Fig- ure 5(b), for thev2 = 1 bend excited state withlv2 = k = 1, clearly confirms the character of this state, it has a nodal plane in the angular coordinate at the linear structures withθ = 0◦ and 180◦. Figure 5(c) for thev3 = 1 H+2–He stretch excited state has a node in the radial coordinateR, which also confirms our assignment. Figure 5(d) and 5(e) show thev2=2 bend and v3 = 2 stretch overtone states, respectively. Finally, Fig. 5(f) corresponds to a higher excited state at−300.6 cm−1. It illus- trates that, indeed, the higher states are more delocalized and extend to larger H+2–He distancesR. The non-negligible ampli- tude atθ=90◦suggests that tunneling between the two minima is appreciable. Some further comments on the energy levels and the transitions between them are made below, when we discuss the experimental spectra and their comparison with theory.
The frequencies and line strengths of all dipole-allowed tran- sitions between these energy levels of H2He+and D2He+ are given in the Supplementary Material. The dipole transition mo- ments and line strengths were calculated from the wave func- tions of the corresponding states and theab initiodipole mo- ment function described in Section 3.4.
4. Low-Resolution Spectroscopy of H2He+
The experimental spectrum obtained for H2He+is shown in Fig. 6, together with a simulated spectrum based on the line lists from the variational calculations. The D2FOPI and CCVM calculations yield indistinguishable spectra. As we usedn-H2
as a precursor in the ion source, we assume that itso/pratio of 3:1 is transferred to theo/pratio of H2He+generated in the ion trap. At the cryogenic conditions of the experiment all transi- tions originate from the lowest quantum levels ofo/p-H2He+. At an assumed rotational temperature of about 15 K (due to known heating effects [54, 55], the rotational and translational temperatures of the ions are higher than the nominal tempera- ture of the trap, 4 K), only the lowest three levels withJ=0, 1, and 2 ofo/p-H2He+are occupied (in total six levels). Starting from these six levels, the FELIX laser has probed spectral fea- tures of H2He+in the range of 540–1900 cm−1. Most of these features, being below the dissociation limits ofD0 =1794 cm−1 forpara-H2He+andD0=1852 cm−1forortho-H2He+, must be due to multi-photon processes (the limits are indicated by ver- tical dashed lines in Fig. 6). The appearance or non-appearance of spectral features, in comparison to the predictions provided by the variational calculations, depends on the availability of
0 4 8
600 800 1000 1200 1400 1600 1800
intensity / arbitrary units
wavenumber / cm-1
1- 2-photon
3-photon 4-
experiment variational 15K
Figure 6: IR spectrum of H2He+(red), recorded by counting the number of H2He+ions (mass 6 u) as a function of the FELIX wavenumber (cm−1), and the theoretical spectrum (black) at 15 K obtained with the line lists (transition frequencies and line strengths) from the variational calculations. The ions have been trapped and exposed to the pulsed radiation for 2.5 s. The dissociation limit atD0 =1794 cm−1 for theparaspecies andD0 =1852 cm−1 for the orthospecies, as well asD0/2 andD0/3, are indicated by vertical dashed lines, providing the number of photons necessary for the detected dissociation pro- cess. The strong peak at 1840 cm−1is caused by IR-active transitions into states with considerable H-H stretch character. Further probable assignments as well as the resemblance of and differences between the experimental and theoretical spectra are explained in the text.
intermediate resonant states, as well as on experimental param- eters such as the spectral width of the FELIX frequency (typi- cally 0.5 %) and the focusing of the beam in the trap.
The most prominent peak in Fig. 6 is the one around 1840 cm−1, which lies just below the dissociation limit ofortho-
0 0.5 1 1.5
400 600 800 1000 1200 1400 1600 1800 2000
intensity / arbitrary units
wavenumber / cm-1 2-photon 3-photon
4- 5-
experiment variational 15K
Figure 7: IR spectrum of D2He+(red), recorded by counting the number of D2He+ions (mass 8 u) as a function of FELIX wavenumber (cm−1) and the theoretical spectrum (black) at 15 K obtained with the line lists from the vari- ational calculations. The ions have been trapped and exposed to the pulsed radiation for 2.5 s. The dissociation limits atD0=1995 and 2024 cm−1as well asD0/2,D0/3, etc. are indicated by vertical dashed lines. The good agreement between the measured and theoretical spectra allows the assignment of all ex- perimental features, see the summary in Table 3. In particular, the strong band at 1309 cm−1is identified as the fundamental D-D stretch.