Temperature-dependent terahertz time-domain spectroscopy study of Mg-doped stoichiometric lithium niobate
A
NDREAB
UZÁDY,
1,*R
ÉKAG
ÁLOS,
1G
ÉZAM
AKKAI,
1X
IAOJUNW
U,
2G
YÖRGYT
ÓTH,
1L
ÁSZLÓK
OVÁCS,
3G
ÁBORA
LMÁSI,
1J
ÁNOSH
EBLING,
1,4,5 ANDL
ÁSZLÓP
ÁLFALVI11Institute of Physics, University of Pécs, H-7624 Ifjúság útja 6. Pécs, Hungary
2School of Electronic and Information Engineering, Beihang University, Beijing, 100191, China
3Wigner Research Centre for Physics, H-1121 Konkoly Thege Miklós út 29-33., Budapest, Hungary
4MTA-PTE High-Field Terahertz Research Group,H-7624 Ifjúság útja 6. Pécs, Hungary
5University of Pécs SzentÃgothai Research Center, H-7624 Ifjúság útja 20. Pécs, Hungary
*buzady@fizika.ttk.pte.hu
Abstract: Terahertz time-domain spectroscopy measurements were performed on 0.7 mol%
Mg-doped stoichiometric lithium niobate crystal with ordinary and extraordinary polarization in the 4-460 K temperature range. The absorption coefficient and refractive index spectra were recorded in the terahertz frequency range from 0.5 to 1.8 THz. The data extracted from the measurements are given in simple and concise form in order to provide easily usable practical information for those who would like to use this material in the terahertz range. Through a practical example it was also pointed out, that the effect of the temperature must not be neglected during the design and adjustment of terahertz sources if the goal is to maximize the optical-to-THz conversion efficiency.
© 2020 Optical Society of America under the terms of theOSA Open Access Publishing Agreement
1. Introduction
Many applications, like high harmonic generation [1], spin control [2], molecule alignment [3], time-resolved nonlinear spectroscopy [4], or charged particle acceleration and manipulation [5–8] require terahertz (THz) pulses with extremely high pulse energy and peak electric field strength. Presently, optical rectification of visible or near-IR pulses in nonlinear materials is the most powerful method for the generation of THz pulses having extremely high (mJ-level) pulse energy with high (MV/cm-level) corresponding peak electric field strength beside percent level optical-to-THz conversion efficiency. Organic crystals are potential candidates for efficient THz generation in the higher (>2 THz) frequency regime [9]. In the sub 0.5 THz frequency range – suitable for example for particle acceleration applications – the highest so far reported THz pulse energy was achieved in 0.7 mol% Mg-doped stoichiometric LiNbO3(sLN) crystal using the conventional tilted-pulse-front (TPF) excitation scheme [10]. For nonlinear materials, like LiNbO3(LN), where the refractive index difference between the optical and THz range is large, the TPF pumping gives unique possibility for the velocity matching between the optical and the THz pulse. This condition reads as
c
nTHz,phcos(γ)= c
np,gr, (1)
wherecis the vacuum speed of light,np,gris the group refractive index of the pump pulse,nTHz,ph (in the followings simplyn) is the phase refractive index of the THz pulse, andγis the velocity matching angle i.e. the angle made by the phase and pulse fronts of the pump.
For LN the approximate value ofγis∼63◦, but its accurate value depends on the temperature, stoichiometry and the quality/quantity of dopants through the refractive indices according to Eq.
#384997 https://doi.org/10.1364/OME.384997
Journal © 2020 Received 3 Dec 2019; revised 15 Jan 2020; accepted 21 Jan 2020; published 17 Mar 2020
(1). The knowledge of the accurate value of theγvelocity matching angle is very important, since it determines the geometry of the TPF pumping excitation scheme optimized for the optical-to-THz conversion efficiency. These geometrical characteristics are the wedge angle of the prism-shaped LN crystal (which is alsoγ), the distances between the elements of the scheme and the incident angle of the pump at the diffraction grating [11,12]. Therefore the knowledge of the THz index of refraction is essential.
More importantly, the relatively large absorption of LN in the THz range due to lattice vibrations is a limiting factor in THz generation sources, where LN crystals with several millimeter thicknesses are used. It was shown by far-infrared Fourier transform measurements, that for both congruent (cLN) and stoichiometric LN the THz absorption coefficient can be reduced by adding Mg-dopant (in the form of MgO) to the melt during the crystal growth process [13]. Besides the reduction of THz absorption, the Mg causes the reduction and above a threshold dopant concentration the total suppression of the photorefraction (PR) of the material as well, which is also an important requirement in the course of THz generation processes. For both cLN and sLN the optimal Mg concentration belonging to minimal THz absorption is close to the PR threshold concentration, which is∼6 mol% for cLN, and advantageously almost ten-times less,∼0.7 mol% for sLN [13]. Therefore, from the point of view of THz generation these two compositions earn the greatest attention.
The absorption coefficient of LN monotonously decreases with the decrease of the temperature [13]. In the THz generation efficiency, beside the absorption, the electro-optic coefficient has also a key role, since the effective nonlinear optical coefficient is proportional to it [14]. The electro-optic coefficient also decreases with decreasing temperature [15]. Therefore it is not evident, that the THz generation efficiency is higher if the temperature is lower. The temperature value, which is optimal for achieving the highest THz yield is a result of a trade-off between the effects of absorptive and nonlinear optical (electro-optical) characteristics.
Based on the facts mentioned above, when high energy THz generation sources are designed, precise information on the THz dielectric properties (absorption and refraction spectra) of the THz generator material has great importance.
In the low (0.2-2 THz) THz frequency region, the terahertz time-domain spectroscopy (THz- TDS) is the most accurate method for the determination of the dielectric properties. This technique is more precise than the far-infrared Fourier transform spectroscopy, which provides reliable results only for higher (>5 THz) frequencies [16].
Results of the temperature-dependent THz-TDS measurements together with a detailed analyses were recently reported for 6.0 mol% Mg-doped cLN [17]. However, for the 0.7 mol% Mg-doped sLN [18], which is frequently used in the experiments [10,19,20] THz-TDS data are available only for room temperature. Although far-infrared Fourier transform investigations have been already performed on this sample [13] they do not provide any information below 0.9 THz, moreover the measurement data belonging to the lower frequency part of the examined (0.9 - 6 THz) range are not sufficiently accurate [16]. Furthermore, information on the ordinary polarization is completely missing. Temperature-dependent THz-TDS results of the practically important 0.7 mol% doped sLN are still lacking.
In this work, we introduce the results of the temperature dependent THz-TDS measurements performed on 0.7 mol% Mg-doped sLN. The refractive index and absorption spectra were determined in the 0.5-1.8 THz frequency, and 4-460 K temperature range for both ordinary (THz polarization parallel to the X-axis of the crystal) and extraordinary (THz polarization parallel to the Z-axis of the crystal) polarizations. The latter is more important from the point of view of THz generation. Our aim is to provide information on the temperature and frequency dependence of refraction and absorption in a concise form to provide a useful tool for those, who use this crystal as a THz material. Therefore, instead of using fitting functions with the real physical background [21], we use as simple functions as possible.
2. Experimental and evaluation
The measurements were carried out by a home-made THz-TDS spectrometer. The THz emitter was a GaAs photoconductive antenna pumped by a Ti:Sapphire laser with 70 fs pulse duration and 80 MHz repetition frequency. To collimate and focus the THz pulses into the crystal two parabolic mirrors were applied. The signal transmitted through the sample was collected by two other parabolic mirrors and was driven onto the ZnTe detectors for electro-optical sampling.
The whole space for the THz propagation was in a vacuum chamber pumped to 10−5 mbar.
The sample holder was designed both to mount and cool the sample. The cooling system to decrease the temperature of the sample for the cryogenic temperatures was filled by liquid helium.
Starting the measurements at 4 K the temperature was increased up to 460 K in 22 steps for the extraordinary and in 14 steps for the ordinary beam polatization. At each temperature, both the reference signals measured without the sample and the transmitted signals were recorded.
The 0.7 mol% Mg-doped sLN crystal was grown by the top-seeded solution-growth technique from a flux containing 12-13 mol% K2O. The built-in dopant level was determined by atomic absorption spectroscopy, and found to be above the photorefractive damage threshold. In sLN crystals a low level of Mg concentration is sufficient to remove all antisite Nb ions and their charge compensating Li vacancies resulting in the increase of lattice ordering. Consequently, already a small amount of Mg has a large impact on the lattice vibration as seen e.g. on the damping of phonons revealed by the Raman spectra [22,23]. The crystal was x-ray oriented with a precision better than 0.5◦. The 600 µm of thickness was measured by a micrometer screw with 10µm accuracy. For recording ordinary polarization data, the Y-cut sample was oriented so that the crystal X-axis was parallel to the THz polarization. To measure the extraordinary polarization the crystal was rotated by 90◦. The size of the crystal in X-Z plane was 4 mm×5 mm, the focused THz beam was 2-3 mm in diameter.
From the THz-TDS measurements the temporal waveform is known for both the reference and the sample. Fourier transforming the time domain signals the complex spectra (Esample(ν), Eref(ν)) can be derived. Knowing the amplitudes and phase the refractive index and the absorption coefficient can be calculated by the frequently used expressions [24]:
n(ν)=arg(H(ν)) · c
2πνd +1, (2)
α(ν)= 4πνκ(ν) c = 2
dln
1
|H(ν)|
4n(ν) (n(ν)+1)2
, (3)
whereνis the THz frequency,n(ν)is the THz phase refractive index,dis the thickness of the crystal,κ(ν)is the extinction coefficient,α(ν)is the absorption coefficient,H(ν)= EsampleEref(ν)(ν)is the transfer function. To apply Eqs. (2) and (3) the condition isκ <<nwhich is fullfild in the this case. The accuracy of the sample thickness measurements was 0.01 mm. The relative error of the refractive index measurements was below 0.5%. The error of the absorption coefficient data was about 2-3 cm−1.
3. Results and discussion
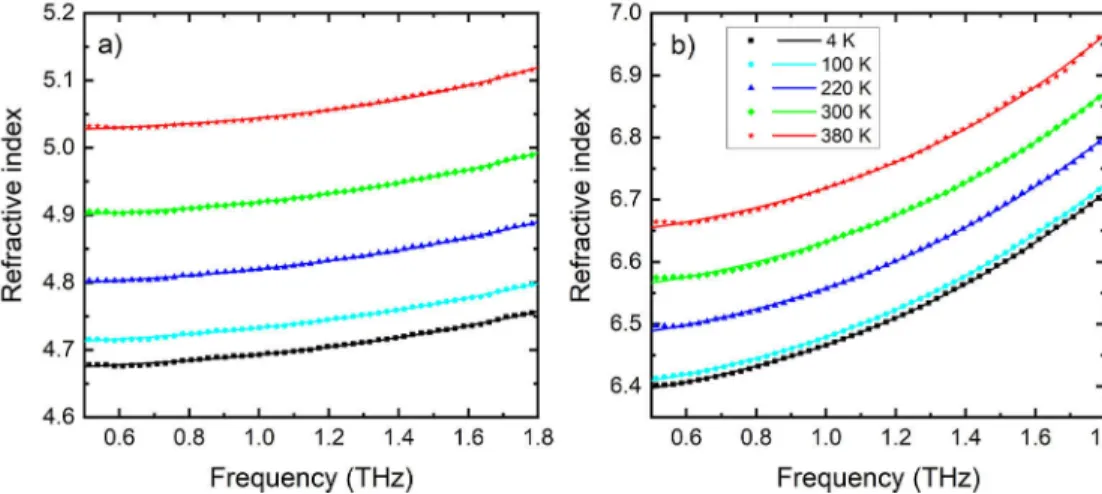
For the sake of clarity and simplicity, the refractive index and absorption coefficient spectra are shown only for a few (4, 100, 220, 300 and 380 K) selected temperatures. In Figs.1(a) and 1(b) the symbols show the refractive index values for extraordinary and ordinary polarizations, respectively. From the figures, it is obvious, that the refractive indices increase with the frequency and decrease with decreasing temperature for both polarizations. The typical values of the refractive indices and also the dispersion of the refractive index spectra are significantly larger for the ordinary polarization. Similarly as in Refs. [13,17] the refractive index spectra were fitted
by the
n(ν)=A+Bν2+Cν4 (4)
polynomial function at all temperatures. The fitting curves are the continuous lines in Figs.1(a) and1(b). The values of theA,BandCcoefficients are collected in Table1for both polarizations.
Fig. 1.Frequency dependence of refractive index of the 0.7 mol% Mg-doped sLN crystal for extraordinary (a) and ordinary polarizations (b) at a few temperature. The symbols are the measured data and the solid lines are the fitting curves according to Eq. (4).
An informative picture of the measured refraction data is the temperature-dependence of the index of refraction belonging to a given frequency. The temperature dependence of the index of refraction belonging to 0.8 and 1.6 THz frequencies for extraordinary and ordinary polarizations are shown in Figs.2(a) and2(b), respectively. These data were fitted by the
n(T)=A0+B0T2 (5)
function. TheA0andB0coefficients for both polarizations are given in Table2.
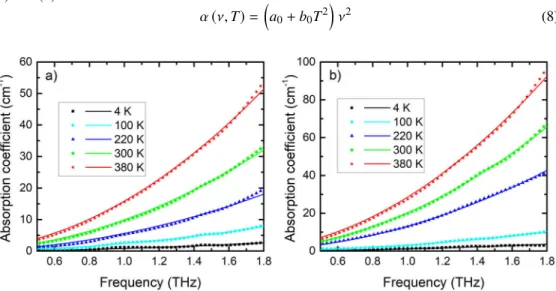
The absorption coefficient spectra extracted from the THz-TDS measurements are shown in Figs.3(a) and3(b) for extraordinary and ordinary polarizations, respectively. The measured data are shown by symbols. It is obvious, that the absorption coefficients increase with the frequency for both polarizations at all temperatures. At all temperatures and frequencies the absorption coefficients are larger for the ordinary polarization. The measured extraordinary absorption coefficient values of 0.7 mol% Mg-doped sLN (which are more important than the ordinary from the point of view of THz generation) are significantly lower than those of 6.0 mol% Mg-doped cLN (which has the smallest absorption among cLN crystals) at each temperature [13,17]. This fact has to be taken into consideration, when choosing the adequate LN composition for high energy THz applications. At all temperatures, the measured absorption spectra were successfully fitted by the
α(ν,T)=K(T)ν2 (6)
function for both polarizations. This dependence also meets the criteria that the absorption coefficient is zero at zero frequency. The fitting curves are the continuous lines. TheK(T) parameters obtained from these fittings are shown by the symbols in Figs.4(a) and4(b) for
Table 1. A,B, andCcoefficients of the refractive index polynomials (Eq. (4)) for extraordinary and ordinary polarization at different temperatures. The temperature is measured in K,Ais dimensionless, the dimensions ofBandCare 10−2THz−2and 10−3THz−4, respectively.
Extraordinary Ordinary
Temp. A B C Temp A B C
4 4.67 2.16 1.67 4 6.38 8.54 5.68
20 4.67 2.38 1.11 20 6.33 8.44 5.9
40 4.67 2.34 1.28 40 6.37 8.69 5.35
60 4.68 2.34 1.25 60 6.37 8.71 5.29
80 4.70 2.45 1.18 80
100 4.71 2.42 1.25 100 6.39 8.63 5.48
120 4.72 2.42 1.43 120
140 4.72 2.40 1.35 140 6.36 8.43 5.87
160 4.74 2.39 1.53 160
180 4.76 2.38 1.73 180 6.44 8.51 5.54
200 4.77 2.27 1.97 200
220 4.79 2.37 1.72 220 6.47 8.49 5.51
240 4.82 2.42 1.74 240
260 4.84 2.39 1.86 260 6.51 8.30 6.15
280 4.87 2.36 1.93 240
300 4.90 2.07 2.82 300 6.55 7.92 6.64
320 4.92 2.15 2.57 320
340 4.96 1.78 3.58 340 6.59 7.85 6.95
360 4.99 1.80 3.55 360
380 5.02 1.67 4.00 380 6.64 7.41 8.55
420 5.10 1.42 4.29 420 6.67 9.16 2.75
460 5.17 1.14 5.02 460 6.73 8.02 7.99
Fig. 2.Temperature-dependence of the refractive index for extraordinary (a) and ordinary polarizations (b) at two different frequencies (0.8 and 1.6 THz). The symbols are the measured data and the solid lines are the fitting curves according to Eq. (5).
Table 2. A0, andB0coefficients of the temperature-dependent index of refraction (Eq. (5)) for both polarizations at two different frequencies.
Extraordinary Ordinary
Freq. (THz) A0 B0(10−6K−2) A0 B0(10−6K−2)
0.8 4.69 2.35 6.42 1.79
1.6 4.75 2.38 6.62 1.83
extraordinary and ordinary polarizations, respectively. These points were fitted by the
K(T)=a0+b0T2 (7)
function. Thea0andb0parameters are given in Tab3for both polarizations. According to Eq.
(6) and (7) one can obtain
α(ν,T)=
a0+b0T2
ν2 (8)
Fig. 3. Frequency dependence of the absorption coefficient of the 0.7 mol% Mg-doped sLN crystal for extraordinary (a) and ordinary polarizations (b) at a few temperature. The symbols are the measured data and the solid lines are the fitting curves according to Eq. (6).
We emphasize, that according to these, for a given polarization the absorption coefficient of 0.7 mol% Mg-doped sLN can be determined at any temperature and frequency in a very simple way by using Eq. (8) together with the parameters of Table3.
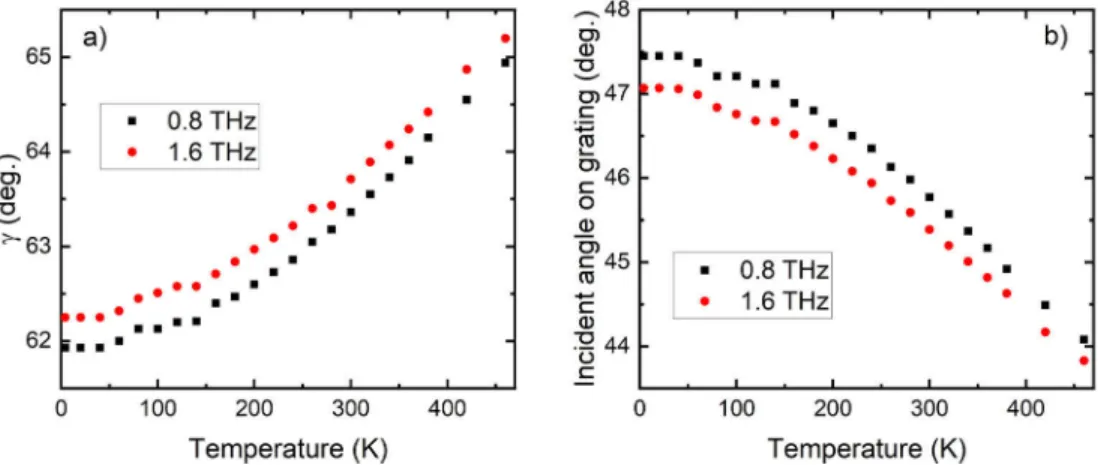
In order to get information on the influence of the temperature on the geometry of the TPF pumping setup, we determined the temperature-dependence of theγvelocity matching angle (i.e. the wedge angle of the LN prism) by using Eq. (1). The temperature-dependent index of refraction was taken from Ref. [25] for the pump, and from present investigations for the THz wavelength. For the calculations 1030 nm pump wavelength was assumed. Figure5(a) shows the temperature-dependence ofγfor 0.8 and 1.6 THz phase matching frequencies, respectively.
At 0.8 THz frequency the velocity matching angle increases from 61.93◦to 63.36◦, at 1.6 THz frequency it increases from 62.25◦ to 63.71◦, if the temperature changes from 4 to 300 K. In the entire examined temperature range the variation ofγis∼3◦. Among several geometrical parameters of the TPF pumping setup, the optimal angle of incidence of the pump beam at the optical grating also depends on the temperature. Based on the corresponding equations of Refs.
[11,12] we determined the optimal incident angle at the grating assuming 1500 lines/mm groove density. The results are shown in Fig.5(b) for 0.8 and 1.6 THz phase matching frequencies, respectively. As it is seen, the variation of the angle of incidence with the temperature is
Fig. 4. The symbols show theKparameters obtained from the fitting of the absorption spectra belonging to a given temperature for extraordinary (a) and ordinary polarizations (b).
The solid line represents the polynomial fitting ofK(T)according to Eq. (7).
practically the same as that ofγ. The results of the above examinations show, that the effect of the temperature has to be rigorously taken into consideration when the TPF pumping THz schemes are optimized. Therefore the information on the THz dielectric parameters are essential.
Fig. 5.Temperature dependence of theγvelocity matching angle (a) and the corresponding incident angle on the grating (b) for 0.7 mol% Mg-doped sLN. Pump wavelength: 1030 nm, grating density: 1500 lines/mm.
Table 3. a0, andb0parameters of the temperature and frequency dependent absorption coefficient (Eq. (8)) for both polarizations.
Extraordinary Ordinary
a0(cm−1THz−2) 0.69 2.48
b0(10−4cm−1K−2THz−2) 1.07 1.72
4. Conclusion
A detailed characterization of the refractive index and absorption coefficient of 0.7 mol%
Mg-doped stoichiometric lithium niobate crystals was performed by THz-TDS for both ordinary and extraordinary polarizations. The results (especially for the absorption) were presented as concisely as possible in order to provide an easily applicable tool for those, who need index of refraction and absorption data in the 0.5-1.8 THz, and 4-460 K temperature range. It was also pointed out, and emphasized, that the effect of temperature is crucial when the tilted-pulse-front pumping THz generation schemes are optimized for the optical-to-THz conversion efficiency.
Funding
Nemzeti Kutatási, Fejlesztési és Innovaciós Alap (2018-1.2.1-NKP-2018-00010); European Union, cofinanced by the European Social Fund (EFOP-3.6.2-16-2017-00005).
Acknowledgements
The authors appreciate the effective contribution of Tong Lin and Prof. Nanling Wang from Peking University. Gyorgy Toth would like to thank the support of the János Bolyai Research Scholarship of the Hungarian Academy of Science.
Disclosures
The authors declare no conflicts of interest References
1. E. Balogh, K. Kovacs, P. Dombi, J. A. Fülöp, G. Farkas, J. Hebling, V. Tosa, and K. Varju, “Single attosecond pulse from terahertz-assisted high-order harmonic generation,”Phys. Rev. A84(2), 023806 (2011).
2. T. Kampfrath, A. Sell, G. Klatt, A. Pachkin, S. Mährlein, T. Dekorsy, M. Wolf, M. Fiebig, A. Leitenstorfer, and R.
Huber, “Coherent terahertz control of antiferromagnetic spin waves,”Nat. Photonics5(1), 31–34 (2011).
3. S. Fleischer, Y. Zhou, R. W. Field, and K. A. Nelson, “Molecular orientation and alignment by intense single-cycle THz pulses,”Phys. Rev. Lett.107(16), 163603 (2011).
4. T. Kampfrath, K. Tanaka, and K. A. Nelson, “Resonant and nonresonant control over matter and light by intense terahertz transients,”Nat. Photonics7(9), 680–690 (2013).
5. L. J. Wong, A. Fallahi, and F. X. Kärtner, “Compact electron acceleration and bunch compression in THz waveguides,”
Opt. Express21(8), 9792–9806 (2013).
6. W. R. Huang, E. A. Nanni, K. Ravi, K.-H. Hong, A. Fallahi, L. J. Wong, P. D. Keathley, L. E. Zapata, and F. X.
Kärtner, “Toward a terahertz-driven electron gun,”Sci. Rep.5(1), 14899 (2015).
7. E. A. Nanni, W. R. Huang, K.-H. Hong, K. Ravi, A. Fallahi, G. Moriena, R. J. D. Miller, and F. X. Kärtner,
“Terahertz-driven linear electron acceleration,”Nat. Commun.6(1), 8486 (2015).
8. L. Palfalvi, J. A. Fülöp, G. Toth, and J. Hebling, “Evanescent-wave proton postaccelerator driven by intense THz pulse,”Phys. Rev. Accel. Beams17(3), 031301 (2014).
9. C. Vicario, A. V. Ovchinnikov, S. I. Ashitkov, M. B. Agranat, V. E. Fortov, and C. P. Hauri, “Generation of 0.9-mJ THz pulses in DSTMS pumped by a Cr:Mg2SiO4laser,”Opt. Lett.39(23), 6632–6635 (2014).
10. J. A. Fülöp, Z. Ollmann, C. Lombosi, C. Skrobol, S. Klingebiel, L. Pálfalvi, F. Krausz, S. Karsch, and J. Hebling,
“Efficient generation of THz pulses with 0.4 mJ energy,”Opt. Express22(17), 20155–20163 (2014).
11. J. A. Fülöp, L. Pálfalvi, G. Almási, and J. Hebling, “Design of high-energy terahertz sources based on optical rectification,”Opt. Express18(12), 12311–12327 (2010).
12. J. A. Fülöp, L. Pálfalvi, G. Almási, and J. Hebling, “Design of high-energy terahertz sources based on optical rectification: erratum,”Opt. Express19(23), 22950 (2011).
13. L. Pálfalvi, J. Hebling, J. Kuhl, A. Péter, and K. Polgár, “Temperature dependence of the absorption and refrection of Mg-doped congruent and stoichiometric LiNbO3in the THz range,”J. Appl. Phys.97(12), 123505 (2005).
14. W. D. Johnston and I. P. Kaminov, “Contributions to optical nonlinearity in GaAs as determined from Raman scattering efficiencies,”Phys. Rev.188(3), 1209–1211 (1969).
15. P. Górski, R. Ledzion, K. Bondarczuk, and W. Kucharczyk, “Temperature dependence of linear electrooptic coefficients r113and r333in lithium niobate,”Opto-Electron. Rev.16(1), 46–48 (2008).
16. P. Y. Han, M. Tani, M. Usami, S. Kono, R. Kersting, and X.-C. Zhang, “A direct comparison between terahertz time-domain spectroscopy and far-infrared Fourier transform spectroscopy,”J. Appl. Phys.89(4), 2357–2359 (2001).
17. X. Wu, C. Zhou, W. R. Huang, F. Ahr, and F. X. Kärtner, “Temperature dependent refractive index and absorption coefficient of congruent lithium niobate crystals in the terahertz range,”Opt. Express23(23), 29729–29737 (2015).
18. M. Unferdorben, Z. Szaller, I. Hajdara, J. Hebling, and L. Pálfalvi, “Measurement of Refractive Index and Absorption Coefficient of Congruent and Stoichiometric Lithium Niobate in the Terahertz Range,”J. Infrared, Millimeter, Terahertz Waves36(12), 1203–1209 (2015).
19. J. A. Fülöp, L. Pálfalvi, S. Klingebiel, G. Almási, F. Krausz, S. Karsch, and J. Hebling, “Generation of sub-mJ terahertz pulses by optical rectification,”Opt. Lett.37(4), 557–559 (2012).
20. P. S. Nugraha, G. Krizsán, C. Lombosi, L. Pálfalvi, G. Tóth, G. Almási, J. A. Fülöp, and J. Hebling, “Demonstration of a tilted-pulse-front pumped plane-parallel slab terahertz source,”Opt. Lett.44(4), 1023–1026 (2019).
21. M. Schall, H. Helmand, and S. R. Keiding, “Far infrared properties of electro-optic crystals measured by THz time-domain spectroscopy,”Int. J. Infrared Millimeter Waves20(4), 595–604 (1999).
22. K. Lengyel, A. Péter, L. Kovács, G. Corradi, L. Pálfalvi, J. Hebling, M. Unferdorben, G. Dravecz, Z. S. I. Hajdara, and K. Polgár, “Growth, defect structure and thz application of stoichiometric lithium niobate,”Appl. Phys. Rev.2(4), 040601 (2015).
23. M. D. Fontana and P. Bourson, “Microstructure and defects probed by raman spectroscopy in lithium niobate crystals and devices,”Appl. Phys. Rev.2(4), 040602 (2015).
24. P. U. Jepsen and B. M. Fischer, “Dynamic range in terahertz time-domain transmission and reflection spectroscopy,”
Opt. Lett.30(1), 29–31 (2005).
25. O. Gayer, Z. Sacks, E. Galun, and A. Arie, “Temperature and wavelength dependent refractive index equations for MgO-doped congruent and stoichiometric LiNbO3,”Appl. Phys. B91(2), 343–348 (2008).