MŰHELYTANULMÁNYOK DISCUSSION PAPERS
MT-DP – 2019/9
Healthcare Spending Inequality:
Evidence from Hungarian Administrative Data
ANIKÓ BÍRÓ – DÁNIEL PRINZ
Discussion papers MT-DP – 2019/9
Institute of Economics, Centre for Economic and Regional Studies, Hungarian Academy of Sciences
KTI/IE Discussion Papers are circulated to promote discussion and provoque comments.
Any references to discussion papers should clearly state that the paper is preliminary.
Materials published in this series may subject to further publication.
Healthcare Spending Inequality: Evidence from Hungarian Administrative Data
Authors:
Anikó Bíró senior research fellow
“Lendület” Health and Population Research Group
Institute of Economics, Centre for Economic and Regional Studies, Hungarian Academy of Sciences
biro.aniko@krtk.mta.hu
Dániel Prinz
PhD student in Health Policy and Economics at Harvard and a Pre-Doctoral Fellow in Disability Policy Research at NBER
dprinz@g.harvard.edu
March 2019
Healthcare Spending Inequality:
Evidence from Hungarian Administrative Data
Anikó Bíró – Dániel Prinz Abstract
Using administrative data on incomes and healthcare spending, we develop new evidence on the distribution of healthcare spending in Hungary. We document substantial geographic heterogeneity and a positive association between income and public healthcare spending.
JEL: H51, I14, I18
Keywords: administrative data, healthcare expenditures, inequality
Acknowledgements
Anikó Bíró was supported by the Momentum (“Lendület") programme of the Hungarian Academy of Sciences (grant number: LP2018-2/2018).
We thank Samantha Burn, David Cutler, Péter Elek, Eszter Kabos, Gábor Kertesi, Grégoire Mercier, Anna Orosz, Jonathan Skinner, and Balázs Váradi for helpful comments. Réka Blazsek provided excellent research assistance.
Egyenlőtlenségek az egészségügyi kiadásokban:
tények magyarországi adminisztratív adatok alapján
Bíró Anikó – Prinz Dániel
Összefoglaló
Jövedelemre és egészségügyi kiadásokra vonatkozó adminisztratív adatok alapján vizsgáljuk a magyarországi egészségügyi kiadások megoszlását. Kimutatjuk, hogy jelentős eltérés van a megyék között az egészségügyi kiadások tekintetében, valamint a keresetek és a társadalombiztosítás által fizetett egészségügyi kiadások között pozitív az összefüggés.
JEL: H51; I14; I18
Tárgyszavak: adminisztratív adatok, egészségügyi kiadások, egyenlőtlenség
Healthcare Spending Inequality:
Evidence from Hungarian Administrative Data ∗
Anik´ o B´ır´ o
Institute of Economics, HAS CERS
Health and Population “Lend¨ ulet” Research Group D´ aniel Prinz
Harvard University March 2019
Abstract
Using administrative data on incomes and healthcare spending, we develop new evidence on the distribution of healthcare spending in Hungary. We document sub- stantial geographic heterogeneity and a positive association between income and public healthcare spending.
∗B´ır´o: biro.aniko@krtk.mta.hu. Prinz: dprinz@g.harvard.edu. Anik´o B´ır´o was supported by the Mo- mentum (“Lend¨ulet”) programme of the Hungarian Academy of Sciences (grant number: LP2018-2/2018).
We thank Samantha Burn, David Cutler, P´eter Elek, Eszter Kabos, G´abor Kertesi, Gr´egoire Mercier, Anna Orosz, Jonathan Skinner, and Bal´azs V´aradi for helpful comments. R´eka Blazsek provided excellent research
1 Introduction
Almost all developed countries have universal health insurance: through public insurance programs or through privately provided social insurance, they give access to healthcare ser- vices to their entire population. In most European nations, regardless of income, people have nominal access to the same services, which are typically free at the point of use or come with a nominal copayment amount. However, there are many reasons why in practice individu- als with different incomes may use services differently. On the one hand, individuals with lower incomes are more likely to be in worse health (Walters and Suhrcke,2005;Mackenbach et al., 2008; Chetty et al., 2016), suggesting that they may use healthcare services more.
On the other hand, there are geographic inequalities in the availability of many services and individuals at different points in the income distribution may have different amounts of social capital or trust in medical providers, suggesting that lower income individuals may use healthcare services less because they have worse access (Walters and Suhrcke, 2005;
OECD and European Union,2014;Cylus and Papanicolas,2015). How healthcare use varies with income and whether effective access is equitable across the income distribution remain empirical questions even in developed countries with universal social insurance programs.
In this paper, we document inequalities in the use of different types of healthcare services using administrative data that covers the population of Hungary. By linking detailed data on employment, income, and geographic location with measures of healthcare spending, we are able to provide a more complete picture than the existing literature which has relied on survey data. We document two main facts. First, there is substantial heterogeneity across geographic regions of Hungary in healthcare spending. In the highest spending county, aver- age outpatient spending is 77%, inpatient spending is 27%, and prescription drug spending is 37% higher than in the lowest spending county. Second, income is broadly positively as- sociated with public healthcare spending both nationally and within geographic units. On average, individuals in the 75th percentile of the national income distribution have 11-17%
higher public healthcare spending than individuals at the 25th percentile of the national
income distribution.
Our findings contribute to the existing literature on healthcare spending inequalities in public insurance systems in general and the Hungarian system in particular. Our finding of broad geographic variation in Hungary is in line with prior studies (Orosz, 1990; Nagy, 2010; Fadgyas-Freyler and Korponai, 2016). Our finding that there is a positive association between income and healthcare spending in our sample of active workers is in line with inter- national evidence (Devaux,2015), but we are able to provide a much more precise picture of spending inequalities. For example, Devaux(2015) uses a survey in which 4,500 Hungarians were interviewed, while we use administrative data that includes a random 50% sample of the population. To our knowledge, this is the most detailed study of the relationship between public health insurance spending and income in Hungary to date.
It is important to note that our sample is limited to full-time workers who do not receive public transfers. In some sense this sample limitation helps us guard against a form of reverse causality: individuals who are out of the labor force because they are sick would appear to have low earnings and high healthcare utilization and confound the patterns that are related to other factors. But this also means that our study is applicable to active workers, rather than to the entire population. A key limitation of our work is that we observe healthcare spending, but not health. It is quite likely that health needs differ across the income distribution. To the extent that health needs are negatively correlated with income, that is lower-income individuals need more healthcare, our estimates of inequalities are lower bounds for inequities.
2 Data and sample
We use administrative data from Hungary, covering years 2003-2011 on a random 50% sample of the 2003 population of individuals aged 5-74. The data was created by linking adminis- trative data from the Hungarian tax authority, the pension fund, and the health insurance
fund, among others.1
Health expenditures are observed on the annual level. We have information on the annual public expenditures on specialist outpatient care and inpatient care, and on the annual public and private (out-of-pocket) expenditures on prescription drugs. An important limitation is that location data (city and county of residence) is only available in 2003 and is not updated subsequently.2 The income variable we use includes all employment-based income and excludes public transfers.
We restrict the sample to individuals aged 18-55, who earn at least the minimum wage each month and do not receive any public transfers (pension, unemployment benefit, or maternity payment). We do so to guard against a certain form of “reverse causality”: in- dividuals who are out of the labor force because they are sick would appear to have low earnings and high healthcare utilization, but these patterns are not informative about the longer-term relationship between earnings and healthcare spending. Table 1 shows that in- dividuals in the analytic sample are on average higher earners and about 4 years older than individuals in the full sample, while the gender composition is similar. Outpatient expen- ditures are similar in the two samples, while inpatient spending and Rx spending by social insurance are on average lower in the analytic sample than in the full sample.
3 Methods
Using our main analytic sample described in Section 2, we compute mean spending by counties and income percentiles.3 Our sample only contains active workers (earnings at least the minimum wage for each month of the year, no public transfers), but to further address
1The linked dataset is under the ownership of the Central Administration of National Pension Insurance, the National Health Insurance Fund Administration, the Educational Authority, the National Tax and Customs Administration, the National Labour Office, and the Pension Payment Directorate of Hungary.
The data used were processed by the Institute of Economics, Centre for Economic and Regional Studies of the Hungarian Academy of Sciences.
2Cross-county migration can be approximated from 10-year census data. Over the 10-year period be- tween 2001 and 2011, approximately 15% of the population moved between counties (Lakatos, L. R´edei and Kapit´any,2015).
3All health expenditure measures are winsorized at 99% of their respective distributions.
concerns about reverse causality (health influencing earnings), we relate the current year’s healthcare expenditures to the previous year’s income percentile and restrict the sample further to those who spent zero days on sick-leave the previous year. This restriction ensures that sick leave spells (hence lower earnings) do not influence the income distribution.
In our analyses, we provide plots and maps of the geographic distribution of healthcare spending for four types of spending (outpatient, inpatient, prescription drugs paid by in- surance, prescription drugs paid out-of-pocket). We also show plots of the distribution of spending across percentiles of the income distribution, both nationally and within counties.
All plots are adjusted for gender and age (in year bins).
4 Results
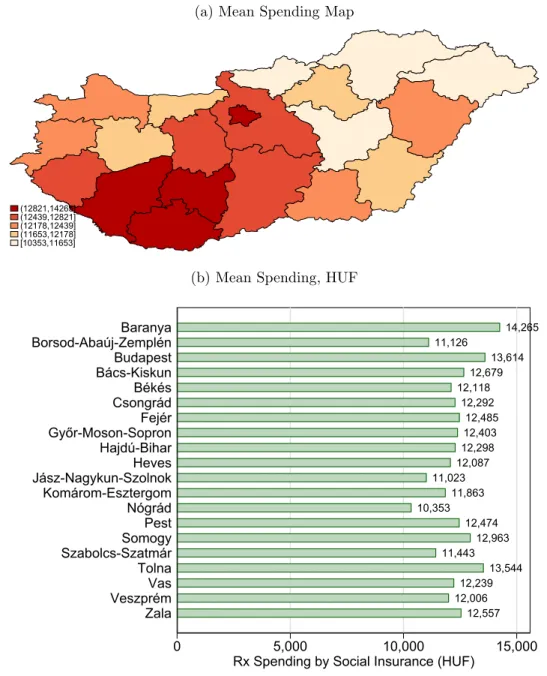
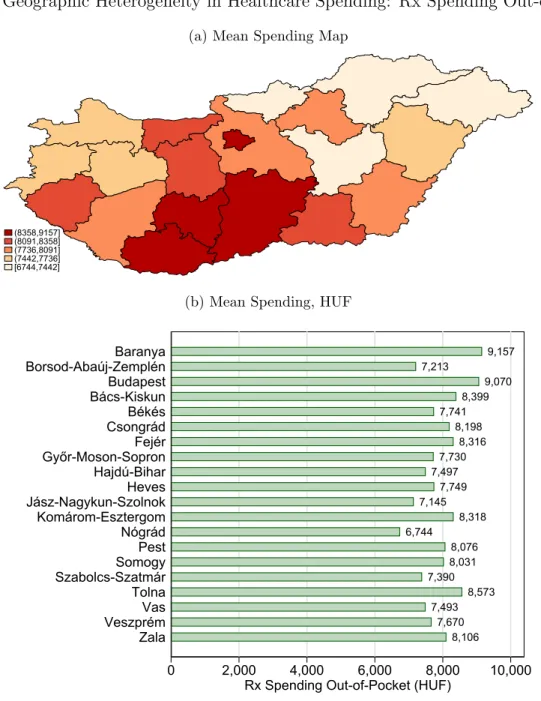
Figures 1-4 show mean expenditures in the four categories (outpatient, inpatient, prescrip- tion drugs paid by insurance, prescription drugs paid out-of-pocket) by county over years 2004-2011. We observe substantial heterogeneity across counties. In the highest spending county, average outpatient spending is 77%, inpatient spending is 27%, and prescription drug spending is 37% higher than in the lowest spending county. Interestingly, it appears that there is variation in the ranking of counties by type of spending. While Eastern and Southern counties are broadly the highest spending counties in each category, the correlation is less than perfect. The rank-rank correlation (Spearman’s rho) of outpatient and inpatient spending is ρ= 0.39, while for inpatient and prescription drug spending it is ρ= 0.53, and for outpatient and prescription drug spending it is ρ = 0.23. One area that stands out as being different on different measures of spending is Budapest. The capital, which is the most populated and wealthiest area of the country almost tops the outpatient spending distribu- tion and is almost at the top of the prescription drug spending distribution, but is in the middle of the inpatient spending distribution.
Figures 5-8 show the distribution of expenditures in the four categories (outpatient, in-
patient, prescription drugs paid by insurance, prescription drugs paid out-of-pocket) across percentiles of (previous year’s) income. Income is positively associated with public health- care spending. Age- and gender-adjusted outpatient spending is 13%, inpatient spending is 17%, and prescription drug spending is 11% higher on average at the 75th percentile of the national income distribution than at the 25th percentile. Age- and gender-adjusted out- patient spending is 34%, inpatient spending is 33%, and prescription drug spending is 27%
higher on average at the 90th percentile of the national income distribution than at the 10th percentile. Visual inspection suggests that the slope of the spending-income relationship decreases as we go higher in the distribution. Going from the first to the second decile of the national income distribution is associated with a 7% increase in outpatient spending, 17%
increase in inpatient spending, and 5% increase in prescription drug spending. Going from the fourth to the fifth decile, the respective increase is only 3%, 4%, and 3% for the three categories.
In the final set of figures, Figures9-12, we explore within-county heterogeneity in spending by income. In these figures, we plot mean spending in each of the categories by county against national wage percentiles, using Locally Weighted Scatterplot Smoothing (LOWESS) with a bandwith of 0.2. That is, the figures show (1) the difference in spending between two individuals who have the same income but live in two different counties and (2) the difference in spending between two individuals who make different incomes but live in the same county.
They also allow us to investigate whether the spending-income relationship has a different slope in different areas. The five counties that we show in the figures are the 1st, 5th, 10th, 15th, and 19th counties, by the average rank in the three spending distributions (outpatient, inpatient, prescription drug). They also represent a geographically heterogeneous group of counties, two counties from the Eastern region (J´asz-Nagykun-Szolnok, Szabolcs-Szatm´ar- Bereg), two counties from the Western region (Somogy, Vas), and one county from the central region (Budapest).4
4Data for every county is available online from http://healthpop.krtk.mta.hu/inequality/
healthcare-spending-inequality/.
The first insight from these figures is that the national relationship between income and healthcare spending we documented in Figures 5-8 also exists within counties. It is also apparent that both the level of spending at the same income percentile and the slope of the spending-income relationship is different across counties. The difference in the level of spending across counties at the same income percentile suggests that the cross-county spending differentials documented in Figures 1-4 are not purely driven by cross-county in- come differences. For example, as we report above, mean outpatient spending is 77% higher in the highest spending county relative to the lowest spending county. This spending differ- ence between the highest and lowest county by inpatient spending exists across the income distribution: it is 80% at the 25th percentile of the national income distribution and 83% at the 75th percentile. But the spending-income slope is quite different across the two counties:
while in the lowest spending county, inpatient spending is 22% higher at the 75th percentile than at the 25th percentile, in the highest spending county the same difference is 15%. Sim- ilar patterns exist for other types of spending and other counties. Some of the figures show the spending distributions crossing: this means that below a certain point in the income distribution, one county spends more on average, while above that point the other county does.
A simple way to think about how much of the documented variation is across counties versus across income groups is to do a variance decomposition of spending variation across the 2,000 county × percentile cells (20 counties × 100 income percentiles). In this exercise we ask, how much variance would be reduced if (a) spending were the same across income percentiles in a county, (b) we let everyone in the same income percentile have the same spending. If we eliminated cross-percentile variation, variance in outpatient spending would be reduced by 35%, while variance in inpatient and prescription drug spending would be reduced by 84% and 77%, respectively. If we eliminated cross-county variation, variance in outpatient spending would be reduced by 71%, variance in inpatient spending by 47%, and variance in prescription drug spending by 43%.
5 Discussion
In this short paper, we presented evidence on geographic variation and variation by income in healthcare spending in Hungary. We document substantial geographic heterogeneity and find that there is a positive relationship between income and public healthcare spending. To our knowledge, this is the first paper documenting variation in social insurance healthcare spending by income using detailed administrative data. We are able to develop a more nuanced picture than previous research, but many open questions remain.
The most important question is what causes the geographic and income differences in healthcare spending. The broader literature on geographic variation in public programs (where prices are not a primary driver of spending variation since they are set administra- tively) in other countries has considered the role of supply and demand factors (Skinner,2011;
Finkelstein, Gentzkow and Williams,2016;Cutler, Skinner, Stern and Wennberg,2019). De- mand factors include variation in patient preferences, while supply factors include physician preferences but also potentially differences in access.
We think that in our context, access may play an important role. One piece of evidence comes from geographic heterogeneity. We find that county means of outpatient and prescrip- tion drug spending (both social insurance and out-of-pocket) are positively correlated with county level average wages, while the same correlation is negative for inpatient spending.
This finding suggests that individuals in the poorer counties are on average in worse health, but have limited access to outpatient specialist care and to prescription drugs. Another suggestive pattern is the positive relationship between income and spending: higher income individuals likely have better access even to publicly provided care (in line with previous international evidence) even though they are likely to be of better health. It should be noted that we found no statistically significant correlation at the county level between simple sup- ply measures (e.g., number of hospital beds, number of physicians, number of pharmacies) and healthcare spending. Similarly, we found no statistically significant correlation between life expectancy at the county level and our spending measures. These results should be
interpreted with caution, since we do not have much statistical power using county-level observations. But one interpretation may be that instead of pure supply-side factors, in- formation, connections, and patient preferences could play a role in explaining cross-county differentials. This would be in line with the finding that there are substantial within-county gradients. In the Hungarian context, informal payments could also play a role, as docu- mented by previous research (Baji et al., 2012; Baji, Pavlova, Gul´acsi and Groot, 2013).
References
Baji, Petra, Milena Pavlova, L´aszl´o Gul´acsi, and Wim Groot. 2013. “Exploring consumers’ attitudes towards informal patient payments using the combined method of cluster and multinomial regression analysis - the case of Hungary.” BMC Health Services Research, 13(1): 62.
Baji, Petra, Milena Pavlova, L´aszl´o Gul´acsi, Homoly´an´e Csete Zs´ofia, and Wim Groot. 2012. “Informal payments for healthcare services and short-term effects of the introduction of visit fee on these payments in Hungary.” International Journal of Health Planning and Management, 27(1): 63–79.
Chetty, Raj, Michael Stepner, Sarah Abraham, Shelby Lin, Benjamin Scuderi, Nicholas Turner, Augustin Bergeron, and David Cutler. 2016. “The Association Between Income and Life Expectancy in the United States, 2001-2014.” Journal of the American Medical Association, 315(16): 1750–1766.
Cutler, David, Jonathan S. Skinner, Ariel Dora Stern, and David Wennberg.
2019. “Physician Beliefs and Patient Preferences: A New Look at Regional Variation in Health Care Spending.” American Economic Journal: Economic Policy, 11(1): 192–221.
Cylus, Jonathan, and Irene Papanicolas. 2015. “An Analysis of Perceived Access to Health Care in Europe: How Universal is Universal Coverage?” Health Policy, 119(9): 1133–1144.
Devaux, Marion. 2015. “Income-related Inequalities and Inequities in Health Care Ser- vices Utilisation in 18 selected OECD Countries.”European Journal of Health Economics, 16(1): 21–33.
Fadgyas-Freyler, Petra, and Gyula Korponai.2016. “Az Orsz´agos Eg´eszs´egbiztos´ıt´asi P´enzt´ar beteghez k¨othet¨o term´eszetbeni kiad´asai a 2015. ´ev sor´an.”Journal of Hungarian Interdisciplinary Medicine, 2016(99): 6–12.
Finkelstein, Amy, Matthew Gentzkow, and Heidi Williams. 2016. “Sources of Geo- graphic Variation in Health Care: Evidence From Patient Migration.” Quarterly Journal of Economics, 131(4): 1681–1726.
Lakatos, Mikl´os, M´aria L. R´edei, and Gabriella Kapit´any. 2015. “Mobilit´as ´es foglalkoztat´as.” Ter¨uleti Statisztika, 55(2): 157–179.
Mackenbach, Johan P., Irina Stirbu, Albert-Jan R. Roskam, Maartje M. Schaap, Gwenn Menvielle, Mall Leinsalu, and Anton E. Kunst. 2008. “Socioeconomic Inequalities in Health in 22 European Countries.” New England Journal of Medicine, 358(23): 2468–2481.
Nagy, Bal´azs. 2010. “Egy hi´anyz´o l´ancszem?: Forr´aseloszt´as a magyar eg´eszs´eg¨ugyben.”
Kozgazdasagi Szemle/Economic Review, 57.
OECD, and European Union. 2014. Health at a Glance: Europe 2014.
Orosz, Eva. 1990. “Regional Inequalities in the Hungarian Health System.” Geoforum, 21(2): 245–259.
Skinner, Jonathan. 2011. “Causes and Consequences of Regional Variations in Health Care.” InHandbook of Health Economics. Vol. 2, , ed. Mark V. Pauly, Thomas G. Mcguire and Pedro P. Barros, 45–93. Elsevier.
Walters, Sarah, and Marc Suhrcke. 2005. “Socioeconomic Inequalities in Health and Health Care Access in Central and Eastern Europe and the CIS: A Review of the Recent Literature.” WHO European Office for Investment for Health and Development Working Paper 2005/1.
Table 1: Summary Statistics
Full Sample, 18-55 Analytic Sample, 18-55
Mean Outpatient Spending 9,913 9,305
Any Outpatient Spending 0.724 0.776
Mean Inpatient Spending 16,752 7,978
Any Inpatient Spending 0.120 0.076
Mean Rx by Social Insurance 16,860 13,037
Any Rx by Social Insurance 0.668 0.727
Mean Rx Out-of-Pocket 6,998 8,293
Any Rx Out-of-Pocket 0.680 0.741
Mean Age 36.843 40.787
Fraction Male 0.505 0.518
Mean Annual Earnings from Employment 985,181 2,511,786
Mean Number of Individuals 2,863,749 767,480
Figure 1: Geographic Heterogeneity in Healthcare Spending: Outpatient Spending
(a) Mean Spending Map
(9958,11465]
(8596,9958]
(8159,8596]
(7574,8159]
[6610,7574]
(b) Mean Spending, HUF
8,509 7,634
8,020 8,094
8,683 7,930
9,657 7,046
8,349 7,386
7,514
11,465 6,610
8,396 10,258 8,921 8,223
11,158 9,421
10,377
0 5,000 10,000 15,000
Outpatient Spending (HUF) Zala
VeszprémTolnaVas Szabolcs-SzatmárSomogyNógrádPest Komárom-Esztergom Jász-Nagykun-SzolnokGyőr-Moson-SopronBács-KiskunHajdú-BiharCsongrádBudapestHevesBékésFejér Borsod-Abaúj-Zemplén Baranya
Figure 2: Geographic Heterogeneity in Healthcare Spending: Inpatient Spending
(a) Mean Spending Map
(8406,8773]
(7921,8406]
(7663,7921]
(7357,7663]
[7069,7357]
(b) Mean Spending, HUF
8,312 7,367 7,264
8,066 8,616 8,500 7,736 7,538 7,423 7,348
7,644 8,146 7,069
8,213 7,683 7,313
8,773 7,681
7,776 8,687
0 2,000 4,000 6,000 8,000
Inpatient Spending (HUF) Zala
VeszprémTolnaVas Szabolcs-SzatmárSomogyNógrádPest Komárom-Esztergom Jász-Nagykun-SzolnokGyőr-Moson-SopronBács-KiskunHajdú-BiharCsongrádBudapestHevesBékésFejér Borsod-Abaúj-Zemplén Baranya
Figure 3: Geographic Heterogeneity in Healthcare Spending: Rx Spending by Social Insur- ance
(a) Mean Spending Map
(12821,14265]
(12439,12821]
(12178,12439]
(11653,12178]
[10353,11653]
(b) Mean Spending, HUF
12,557 12,006
12,239 13,544 11,443
12,963 12,474 10,353
11,863 11,023
12,087 12,298
12,403 12,485 12,292 12,118
12,679 13,614 11,126
14,265
0 5,000 10,000 15,000
Rx Spending by Social Insurance (HUF) Zala
VeszprémTolnaVas Szabolcs-SzatmárSomogyNógrádPest Komárom-Esztergom Jász-Nagykun-SzolnokGyőr-Moson-SopronHajdú-BiharCsongrádHevesFejér Békés Bács-KiskunBudapest Borsod-Abaúj-ZemplénBaranya
Figure 4: Geographic Heterogeneity in Healthcare Spending: Rx Spending Out-of-Pocket
(a) Mean Spending Map
(8358,9157]
(8091,8358]
(7736,8091]
(7442,7736]
[6744,7442]
(b) Mean Spending, HUF
8,106 7,670 7,493
8,573 7,390
8,031 8,076 6,744
8,318 7,145
7,749 7,497
7,730 8,316 8,198 7,741
8,399 9,070 7,213
9,157
0 2,000 4,000 6,000 8,000 10,000
Rx Spending Out-of-Pocket (HUF) Zala
VeszprémTolnaVas Szabolcs-SzatmárSomogyNógrádPest Komárom-Esztergom Jász-Nagykun-SzolnokGyőr-Moson-SopronBács-KiskunHajdú-BiharCsongrádBudapestHevesBékésFejér Borsod-Abaúj-Zemplén Baranya
Figure 5: Income Heterogeneity in Healthcare Spending: Outpatient Spending (mean and 95% confidence interval)
(a) Mean Spending
7,0008,0009,00010,00011,000Outpatient Spending (HUF)
0 20 40 60 80 100
Percentile of Wage
(b) Mean Spending, By Gender
4,0006,0008,00010,00012,00014,000
0 20 40 60 80 100
Percentile of Wage
Male Female
Figure 6: Income Heterogeneity in Healthcare Spending: Inpatient Spending (mean and 95%
confidence interval)
(a) Mean Spending
5,0006,0007,0008,0009,00010,000Inpatient Spending (HUF)
0 20 40 60 80 100
Percentile of Wage (b) Mean Spending, By Gender
4,0006,0008,00010,00012,000
0 20 40 60 80 100
Percentile of Wage
Male Female
Figure 7: Income Heterogeneity in Healthcare Spending: Rx Spending by Social Insurance (mean and 95% confidence interval)
(a) Mean Spending
10,00012,00014,00016,000Rx Spending by Social Insurance (HUF)
0 20 40 60 80 100
Percentile of Wage (b) Mean Spending, By Gender
8,00010,00012,00014,00016,000
0 20 40 60 80 100
Percentile of Wage
Male Female
Figure 8: Income Heterogeneity in Healthcare Spending: Rx Spending Out-of-Pocket (mean and 95% confidence interval)
(a) Mean Spending
6,0008,00010,00012,000Rx Spending Out-of-Pocket (HUF)
0 20 40 60 80 100
Percentile of Wage (b) Mean Spending, By Gender
4,0006,0008,00010,00012,00014,000
0 20 40 60 80 100
Percentile of Wage
Male Female
Figure 9: Income Heterogeneity in Healthcare Spending By County: Outpatient Spending
6,0008,00010,00012,000
0 20 40 60 80 100
Percentile of Wage
Jász-Nagykun-Szolnok Vas Szabolcs-Szatmár-Bereg Somogy Budapest
Figure 10: Income Heterogeneity in Healthcare Spending By County: Inpatient Spending
4,0006,0008,00010,00012,000
0 20 40 60 80 100
Percentile of Wage
Jász-Nagykun-Szolnok Vas Szabolcs-Szatmár-Bereg Somogy Budapest
Figure 11: Income Heterogeneity in Healthcare Spending By County: Rx Spending by Social Insurance
10,00015,00020,00025,000
0 20 40 60 80 100
Percentile of Wage
Jász-Nagykun-Szolnok Vas Szabolcs-Szatmár-Bereg Somogy Budapest
Figure 12: Income Heterogeneity in Healthcare Spending By County: Rx Spending Out-of- Pocket
6,0008,00010,00012,00014,000
0 20 40 60 80 100
Percentile of Wage
Jász-Nagykun-Szolnok Vas Szabolcs-Szatmár-Bereg Somogy Budapest